Mobile Navigation

  • National
    • Policy
      • High Expectations
      • Quality Choices
      • Personalized Pathways
    • Research
    • Commentary
      • Gadfly Newsletter
      • Flypaper Blog
    • Events
    • Scholars Program
  • Ohio
    • Policy
      • Priorities
      • Media & Testimony
    • Research
    • Commentary
      • Ohio Education Gadfly Biweekly
      • Ohio Gadfly Daily
  • Charter Authorizing
    • Application
    • Sponsored Schools
    • Resources
  • About
    • Mission
    • Board
    • Staff
    • Career
Home
Home
Advancing Educational Excellence

Main Navigation

  • National
  • Ohio
  • Charter Authorizing
  • About

Release Date: 12.9.2027. America’s advanced students too often stagnate. They move through curricula at the same pace as their peers, even when they’re capable of learning more, faster. For years, researchers and advocates have argued that stronger K–8 advanced education policies could help reverse this trend and put more students from diverse backgrounds on track for challenging, college-level courses in high school.

But do stronger K–8 policies actually translate into greater participation in advanced high school courses? To find out, Adam Tyner and Brian Fitzpatrick reexamined district-level survey data from our 2024 report, The Broken Pipeline, alongside new district-level data on advanced course-taking in high school.

The findings are sobering. Districts with stronger K–8 advanced education policies enroll more students in early advanced programs and offer more honors courses in high school, but they don’t see higher participation in AP, IB, dual enrollment, or advanced math. The pipeline is still leaky, and fixing it will require more than better policies on paper.

Download the full report or read it below.


Foreword

By Amber M. Northern and Michael J. Petrilli

We at Fordham have long been interested in the plight of high-achieving and high-potential students who get neglected by American education, especially those from low-income backgrounds, often overlooked by traditional identification processes for “gifted” and “advanced” courses and programs. Meeting their needs, however, has proved politically fraught, in part because efforts to serve them have collided with debates over “equity”—and the misguided notion that anything that helps high performers must be bad for their peers. That’s a shame, because the research is encouraging: Grouping students by readiness benefits high achievers without harming lower-performing children. Still, the debate continues—and we owe it to all students to develop their potential to the fullest, starting as early as possible and often as possible.

In recent years, Fordham has published two reports on how educators and policy leaders can “widen and diversify” the advanced pipeline, including a survey of school district and charter network leaders about their approach to advanced education. The latter concluded that advanced education in U.S. school districts was in “mediocre” condition, often neglecting “valuable policies that could expand access and improve student outcomes, resulting in a broken pipeline in advanced education.”

Still, we wondered whether stronger policies in the early and middle grades might “fix the leaks.” Because many students fall out of the pipeline before they attend their first pep rally, could building strong programs in the early grades help keep them on track? Specifically, are robust policies such as universal screening, automatic enrollment into advanced courses, and grade and subject acceleration linked to higher participation in advanced coursework in high school?

To find out, former Fordham researcher Adam Tyner (now at the Oklahoma Center for Education Policy) joined forces with current Fordham National Research Manager Brian Fitzpatrick. They reexamined the original data on district-level advanced education policies in K–8 and supplemented them with district-level data on high school advanced course-taking.

What they found was troubling. First, K–8 advanced education policy varies enormously, with nearly three in ten districts having none of the 13 policies we asked about, while only one in ten has a strong K–8 policy. In short, strong advanced education is the exception in U.S. elementary and middle schools, not the rule.

Second, and more encouragingly, districts with stronger K–8 policies tended to have more K–8 students participating in advanced education (Figure ES-1). Importantly, though, that increase occurs similarly across all demographic groups, so while stronger programs serve more students overall, they do not close participation gaps between underrepresented student groups (Black, Hispanic, and American Indian students) and their peers.

Figure ES-1. Strong advanced education policies enhance opportunities for underrepresented minority students, but don’t close gaps in participation.
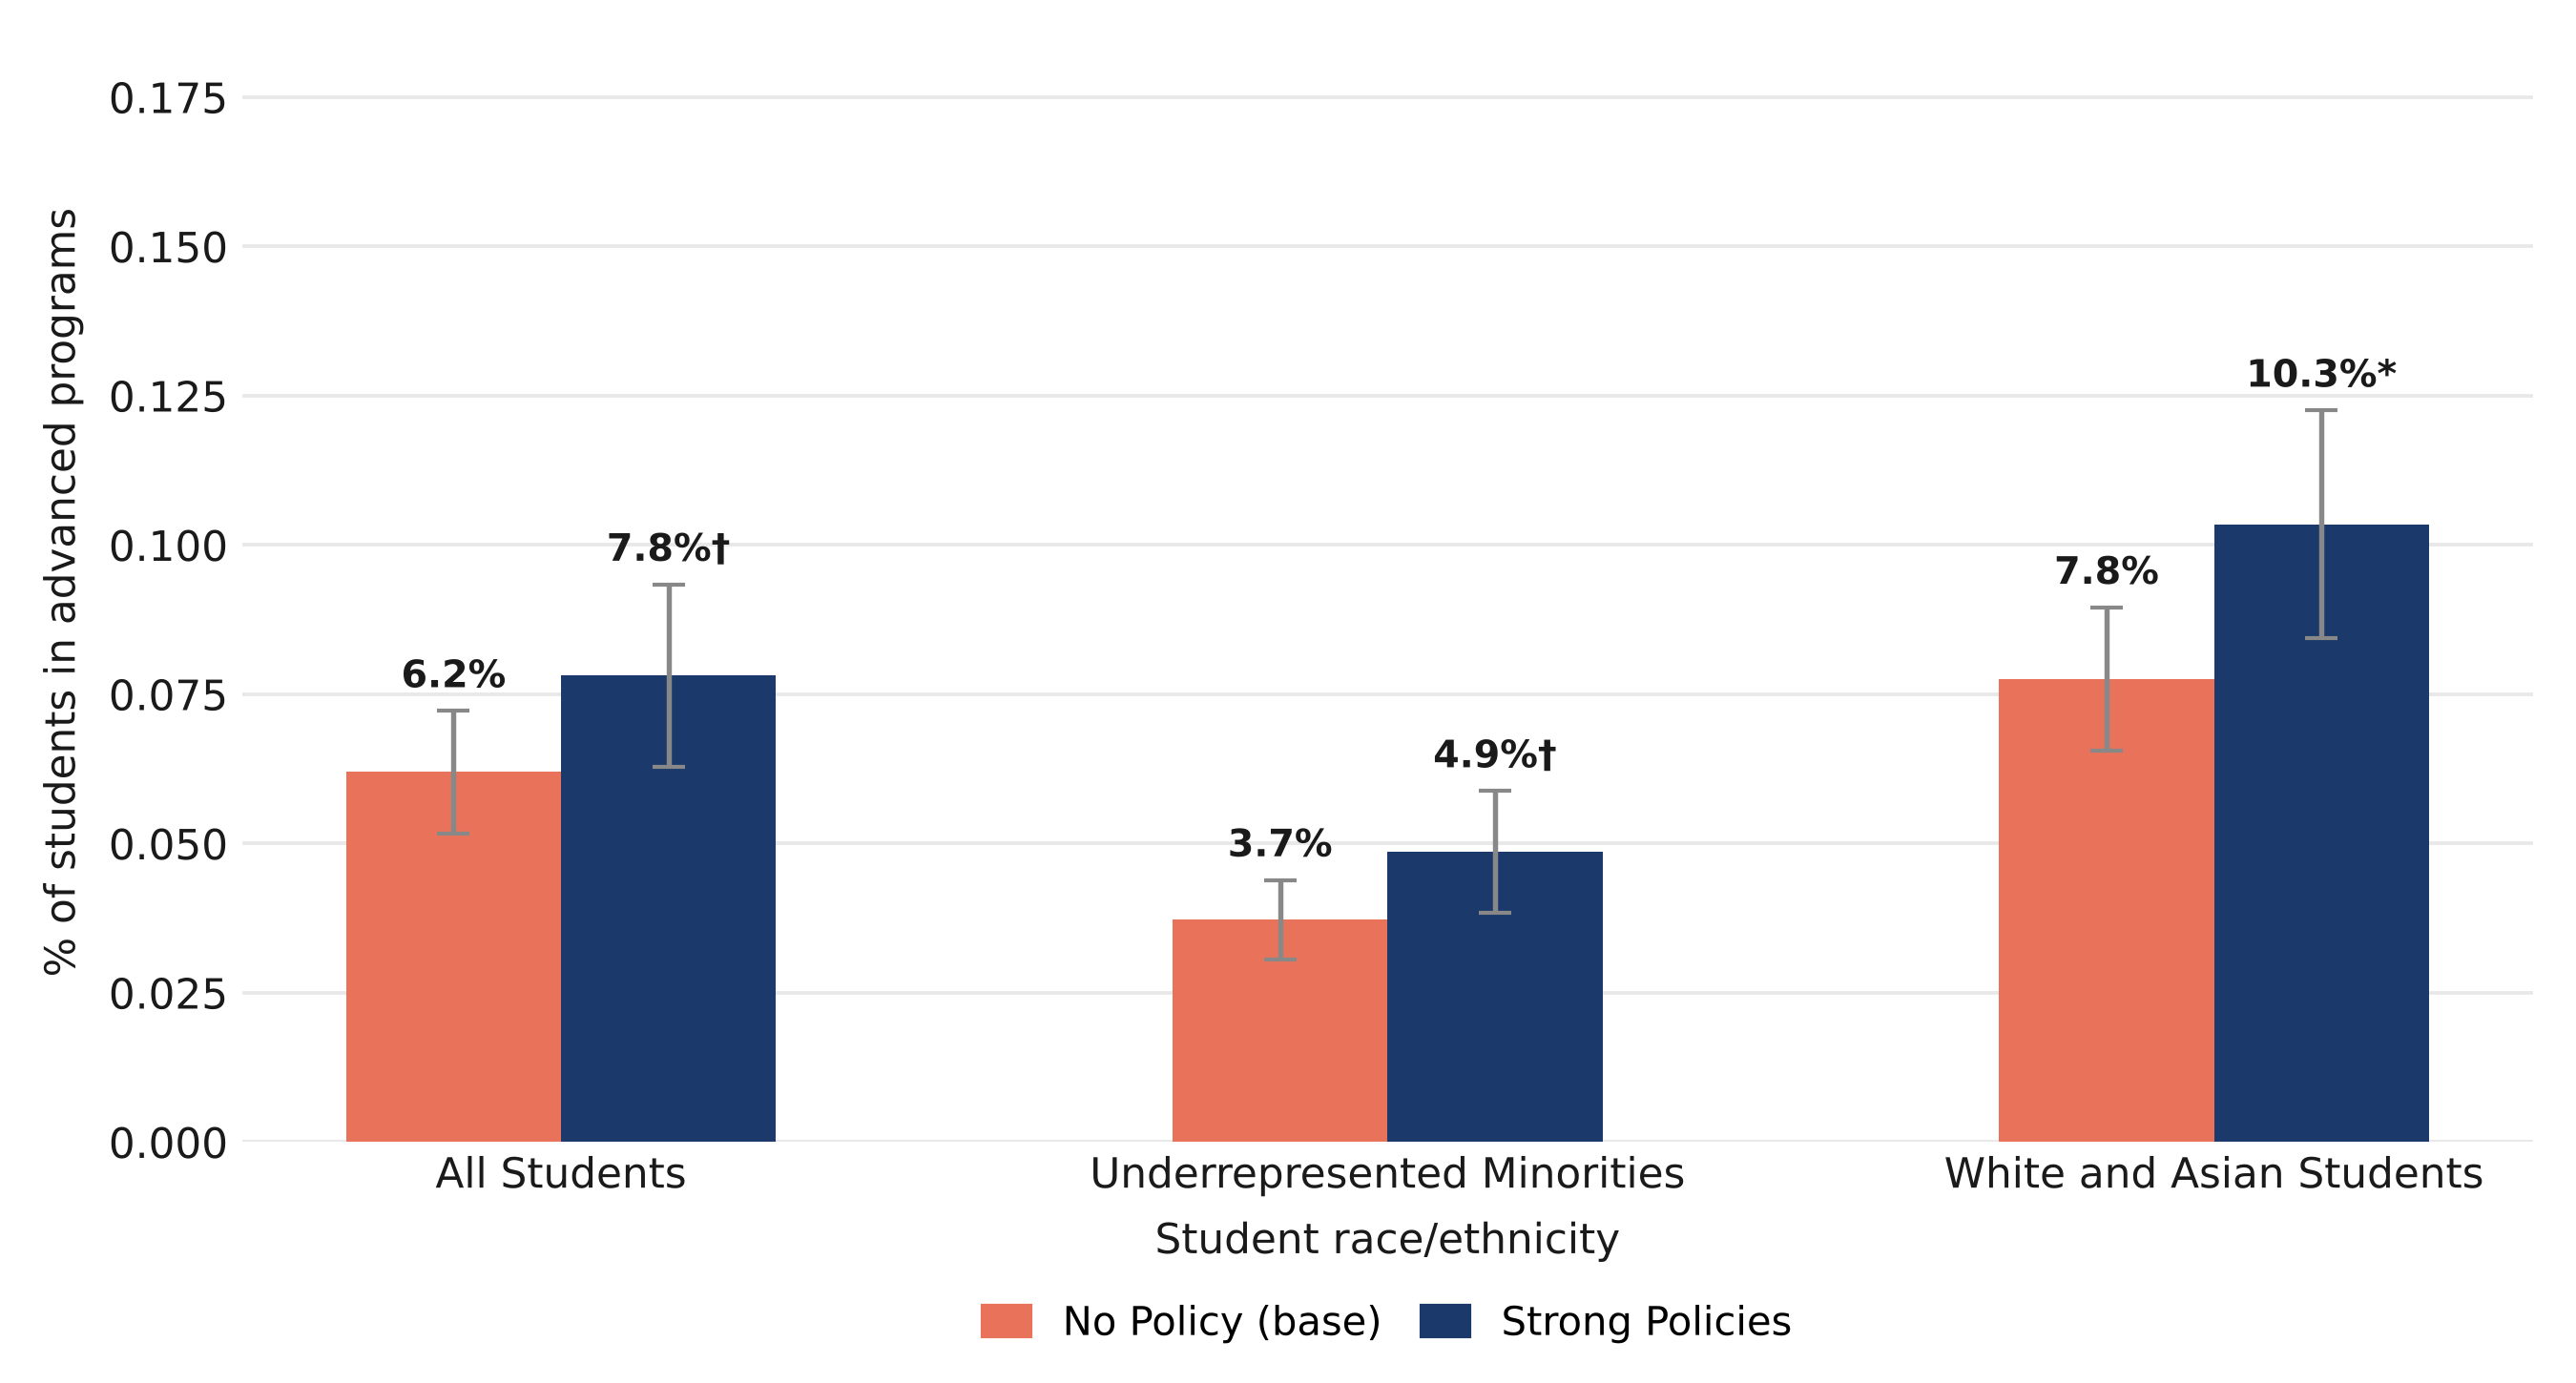
Figure ES-1. Strong advanced education policies enhance opportunities for underrepresented minority students, but don’t close gaps in participation.

Note: Stars indicate significance of "Strong Policies" vs. "No Policy" within each group (†p<0.10, *p<0.05, **p<0.01, ***p<0.001). Salmon bar = base category. Error bars indicate 95% confidence intervals. Overall p-values — All: 0.002; Underrepresented minorities: 0.003; White and Asian: 0.000.

Third, districts with stronger K–8 policies offer a wider array of honors courses in high school. But offering courses is not the same as students taking them. Unfortunately—and contrary to our expectations—stronger K–8 policy seems not to translate into higher rates of participation in Advanced Placement (AP), International Baccalaureate (IB), dual enrollment, or advanced math at the high school level. So, like our report title says, the advanced education pipeline is still leaky, with a disconnect between K–8 advanced education and high school coursework.

These findings should not be read as an argument against investing in early advanced education. As Tyner and Fitzpatrick explain, they measured policy strength using self-reported data from district leaders, and we do not have information about the scope, capacity, implementation, and accessibility of actual programs in school buildings. Or perhaps the observed relationship is reversed, meaning districts that struggle to fill advanced high school courses may be the very ones that adopt stronger early-grade policies to fix the problem.

Regardless, it’s a real issue: In most districts, even the stronger K–8 advanced policies do not push students to accelerate their learning in a way that lasts. We should be building capacious and coordinated programs that are rigorous, engaging, and thoughtfully sequenced from kindergarten through twelfth grade, so that students experience long-term positive effects. The report offers three recommendations on this front:

1.

Make greater use of grade-level and subject acceleration—that is, let students who have mastered the material move ahead a full grade or take a given subject (such as math or science) at a higher grade level, rather than keeping them with age-based peers and repeating content they already know.

2.

Measure and report publicly the quality of implementation so we can evaluate the actual delivery of advanced education on its merits.

3.

Tailor solutions to local context, as the study’s results suggest: Affluent, liberal-leaning suburban districts should build early-grade pipelines that give disadvantaged students a fair shot, while conservative-leaning districts should push for greater AP and dual enrollment participation so that their K–8 investments pay off in high school.

All of these make sense to us, but we’ll add one more. At the recent National Association for Gifted Children (NAGC) annual conference, one of us was dismayed to hear participants lament that many districts won’t let students who pass advanced courses in middle school count them toward high school graduation. This often leads to students retaking courses like Algebra I or Geometry that they already passed in middle school. National data bear this out: Of 45 states reporting, 20 have no law or rule permitting middle school students to earn high school credit. In five of those 20, districts are not allowed to grant such credit; in the other 15, districts may do so at their discretion.

Policymakers, if you want to fix the leaks, start with the ones you’ve created. Students who excel in the earlier grades have already done the work. We shouldn’t let a gap between the middle and high school pipelines undo it.

Introduction

America has never quite agreed on what to do with its most academically advanced students. In some school systems, identifying and serving high-achieving learners is a point of pride: a pipeline that begins in kindergarten and carries students all the way through to college. In others, the very concept of singling out students for advanced coursework has become politically fraught, seen as perpetuating inequality rather than expanding opportunity. Most districts split the difference: They offer advanced programs but rarely implement them with the comprehensiveness or rigor needed to make a meaningful difference for students.

In 2024, the Thomas B. Fordham Institute published The Broken Pipeline: Advanced Education Policies at the Local Level, a national survey of school district administrators that documented how uneven, and often inadequate, advanced education policies are across the country. Using a 1,000-point Advanced Education Index built from the recommendations of the Fordham-commissioned National Working Group on Advanced Education, that report found that the typical district earned fewer than half the possible points. Most districts had substantial room to improve in student identification, programming, teacher supports, and the availability of advanced coursework. The Broken Pipeline also documented a troubling imbalance between the early and later grades: Identification practices, while imperfect, were more developed than programming, and the middle grades emerged as a particular weak point. In these grades, students identified as advanced in elementary school are often left with limited, low-intensity options for continued challenge.

The natural follow-up question is whether any of this matters. Specifically, which districts tend to offer more comprehensive advanced education in the early grades? And does the strength of those early programs predict whether students go on to take rigorous advanced coursework in high school at higher rates? The logic is intuitive: Students identified early, given substantive advanced programming, and kept on an accelerated track through eighth grade should be well positioned to take Advanced Placement (AP) and other advanced courses in high school. If the pipeline is functioning, we should be able to see its downstream effects.

To test this, we drew on the same survey data that informed The Broken Pipeline and merged them with several district-level administrative datasets on district characteristics and high school advanced course participation.

Background

The research case for early advanced education rests on a body of work that has grown considerably over the past decade. Perhaps the most influential line of evidence is on identification: How districts find students for advanced programs shapes, in fundamental ways, who ends up in them. A landmark study by David Card and Laura Giuliano, published in the Proceedings of the National Academy of Sciences in 2016, used data from one large district that adopted universal screening to show that assessing all students rather than relying on teacher and parent referrals substantially increased the representation of low-income and minority students in advanced programs without lowering program quality. The mechanism is straightforward: Referral-based systems favor students whose parents know to advocate for them, while universal screening—often using state or local tests that districts already administer—gives every child a shot. The Broken Pipeline found that this lesson has taken hold to a degree: More than three-quarters of districts with K–8 advanced programs reported using some form of standardized universal screening.

The case for local norms builds on similar logic. Rather than measuring students against state or national benchmarks, local norms compare them with peers in their own school or district. A 2019 study by Scott Peters and colleagues found that local norms substantially increased the share of Black and Hispanic students identified for advanced programs, precisely because national cutoffs tend to filter out students in high-poverty schools whose absolute scores are lower but whose potential (and need for acceleration) is strong relative to their immediate peers. Despite this evidence, only about one in five districts uses local norms, signaling a continuing mismatch between research and practice that The Broken Pipeline identified as one of the field’s most stubborn problems.

On the programming side, the strongest evidence supports acceleration: moving students through content faster (or deeper) than the typical grade-level pace, whether through subject-level acceleration, grade skipping, or dedicated advanced courses. A synthesis by Karen Rogers, included in the influential A Nation Empowered volume, reviewed decades of research and found consistently positive effects of acceleration on academic outcomes, with few of the negative social or emotional effects that critics often raise. Yet The Broken Pipeline found that acceleration remains rare: Fewer than 30 percent of districts reported offering grade acceleration in elementary and middle school, and full-time advanced schools or special classes were available in only a small fraction of districts. The most common delivery modes—part-time pull-out classes and in-class differentiation—keep students in general education classrooms for most of the school day.

Less directly studied, and the motivating question for this report, is whether the strength of a district’s advanced education program in the early grades predicts advanced course-taking in high school. The theoretical case is strong. Students who are identified early, kept in challenging settings, and reach ninth grade with a rigorous academic foundation should be more likely to enroll in advanced and especially college-level courses. Auto-enrollment policies, which place high-scoring students in the most challenging courses by default, were present in about half of the districts surveyed in The Broken Pipeline. They represent a direct institutional link between early identification and later opportunity. But the empirical evidence connecting K–8 advanced education to high school outcomes is thin, partly because the data needed to draw that connection across a nationally representative sample of districts have been difficult to assemble.

This report takes a first step toward filling that gap by addressing three research questions:

1.

Which district characteristics are associated with more comprehensive advanced education policies in K–8?

2.

Do districts with stronger K–8 advanced education policies enroll a greater share of students—including underrepresented minority students—in advanced programs?

3.

Does the on-paper strength of a district’s K–8 advanced education policy predict participation in advanced coursework in high school, including AP, International Baccalaureate (IB), dual enrollment, and advanced math?

Data and Methods

This report draws on the same survey of district and charter school administrators that formed the foundation of The Broken Pipeline. Conducted between May and October 2023, the survey collected information from 581 district and charter administrators on their advanced education identification practices, program types, teacher credentials and professional development, and advanced course offerings. Results were adjusted using post-stratification weighting to be representative of large and midsize districts and charter school organizations, which together serve 90 percent of public school students.

For this analysis, we merged the survey data at the district level with three publicly available administrative datasets:

  • Civil Rights Data Collection (CRDC): District-level enrollment counts and participation rates in advanced math courses, AP courses (overall and STEM-specific), IB, and dual enrollment, disaggregated by race/ethnicity, gender, disability status, and English learner status, from the 2023–24 academic year.
  • Redistricting Data Hub: Publicly available results from the 2020 presidential election, used to measure each district’s political leaning.
  • Common Core of Data: Poverty rates, enrollment size, urbanicity, and other district-level background data from the 2022–23 academic year.

The original survey from The Broken Pipeline asked about advanced education policies spanning the full K–12 range. Here, we focus on K–8 policies and construct a new measure—the K–8 Advanced Education Index, or K8AEI—that is a subset of the original 1,000-point index. The new index excludes high school–only measures so that it does not overlap with high school course-taking data, a key outcome in this study.

As shown in Table 1, the K8AEI covers four domains: identification practices (including universal screening, local norms, auto-enrollment, and early kindergarten entry); teacher preparation; services and curriculum; and instructional setting. The maximum possible score is 800 points. The weighting scheme follows the logic of the original index: Policies with stronger evidence bases or greater likely impact receive higher point values, with identification practices weighted most heavily. Scores above 550 indicate strong policies, scores of 330–550 indicate moderate policies, and scores above zero but below 330 indicate weak policies.

The analyses in this report are descriptive. We compare K8AEI group means on district characteristics and advanced course participation outcomes, and we report correlations between the K8AEI and those outcomes.

Table 1. The K–8 Advanced Education Index (K8AEI) weights identification practices most heavily.

Policy Domain Policy Points
Identification Universal screening based on standardized assessment 150
Students identified based on local norms 150
Identification based on multiple indicators, including standardized assessment 75
Students identified in additional pre-K–8 grades (beyond one, max 5) +10 per grade, max 50
Auto-enrollment to advanced courses for high performers 50
Early entry to kindergarten if high-performing 25
Teachers All teachers receive professional development in advanced pedagogy 50
More than 25 percent of advanced teachers credentialed 25
Services Distinct advanced curriculum 50
Offer advanced enrichment outside of school day 50
Setting
(mutually exclusive)
Full-time advanced school, grade or subject acceleration, or special advanced classes 125
Part-time pull-out program 50
Cluster grouping within classrooms 25
Overall 800

Limitations

The index has a few limitations worth noting. First, it captures policy as reported by district leaders, not implementation fidelity. A district that reports having universal screening earns those points regardless of how consistently that screening is applied in practice. This limitation is inherent in survey-based research and worth keeping in mind when interpreting the results. Second, some included policies—such as early kindergarten entry—are not exclusively advanced education policies, though they reflect a district’s broader orientation toward serving high-performing students early. Third, the specific point values and inclusion decisions are debatable; we encourage readers to treat the K8AEI as an index of relative policy comprehensiveness rather than a precise measure of program quality.

Findings

Finding 1 Advanced education policies in K–8 vary widely, with 30 percent of districts having no such policies.

U.S. school districts vary widely in the strength of their advanced education offerings in K–8. Almost three in ten districts have no advanced education of any kind in K–8 (Table 2). At the other end, no district offers every option included in our measure. Just 10 percent of districts score above 550 on the K8AEI, our threshold for strong K–8 advanced education policy.

Table 2. Almost 30 percent of districts have no advanced education in K–8, and only 10 percent have a strong policy.

K8AEI Group K8AEI Score Range Percentile Range Weighted Percentage District N
No Policy 0–0 0–29 29% 167
Weak Policies 25–325 30–50 23% 132
Moderate Policies 330–550 51–90 38% 224
Strong Policies 555–720 91–100 10% 58

We tested whether five district characteristics—urbanicity, poverty rate, political leaning, racial and ethnic composition, and size—are related to the strength of K–8 advanced education policy. Of those, only two were statistically detectable[1], and only marginally so at that. Both of the following are associated with stronger K–8 advanced education policies on average (Figure 1):

1.

School districts that voted Republican in the 2020 election.

2.

Districts with higher-than-average poverty rates (but not those with the highest rates of poverty).

Figure 1. Districts with stronger advanced education policies tend to be slightly poorer and more conservative than the average U.S. district, but these relationships are weak.
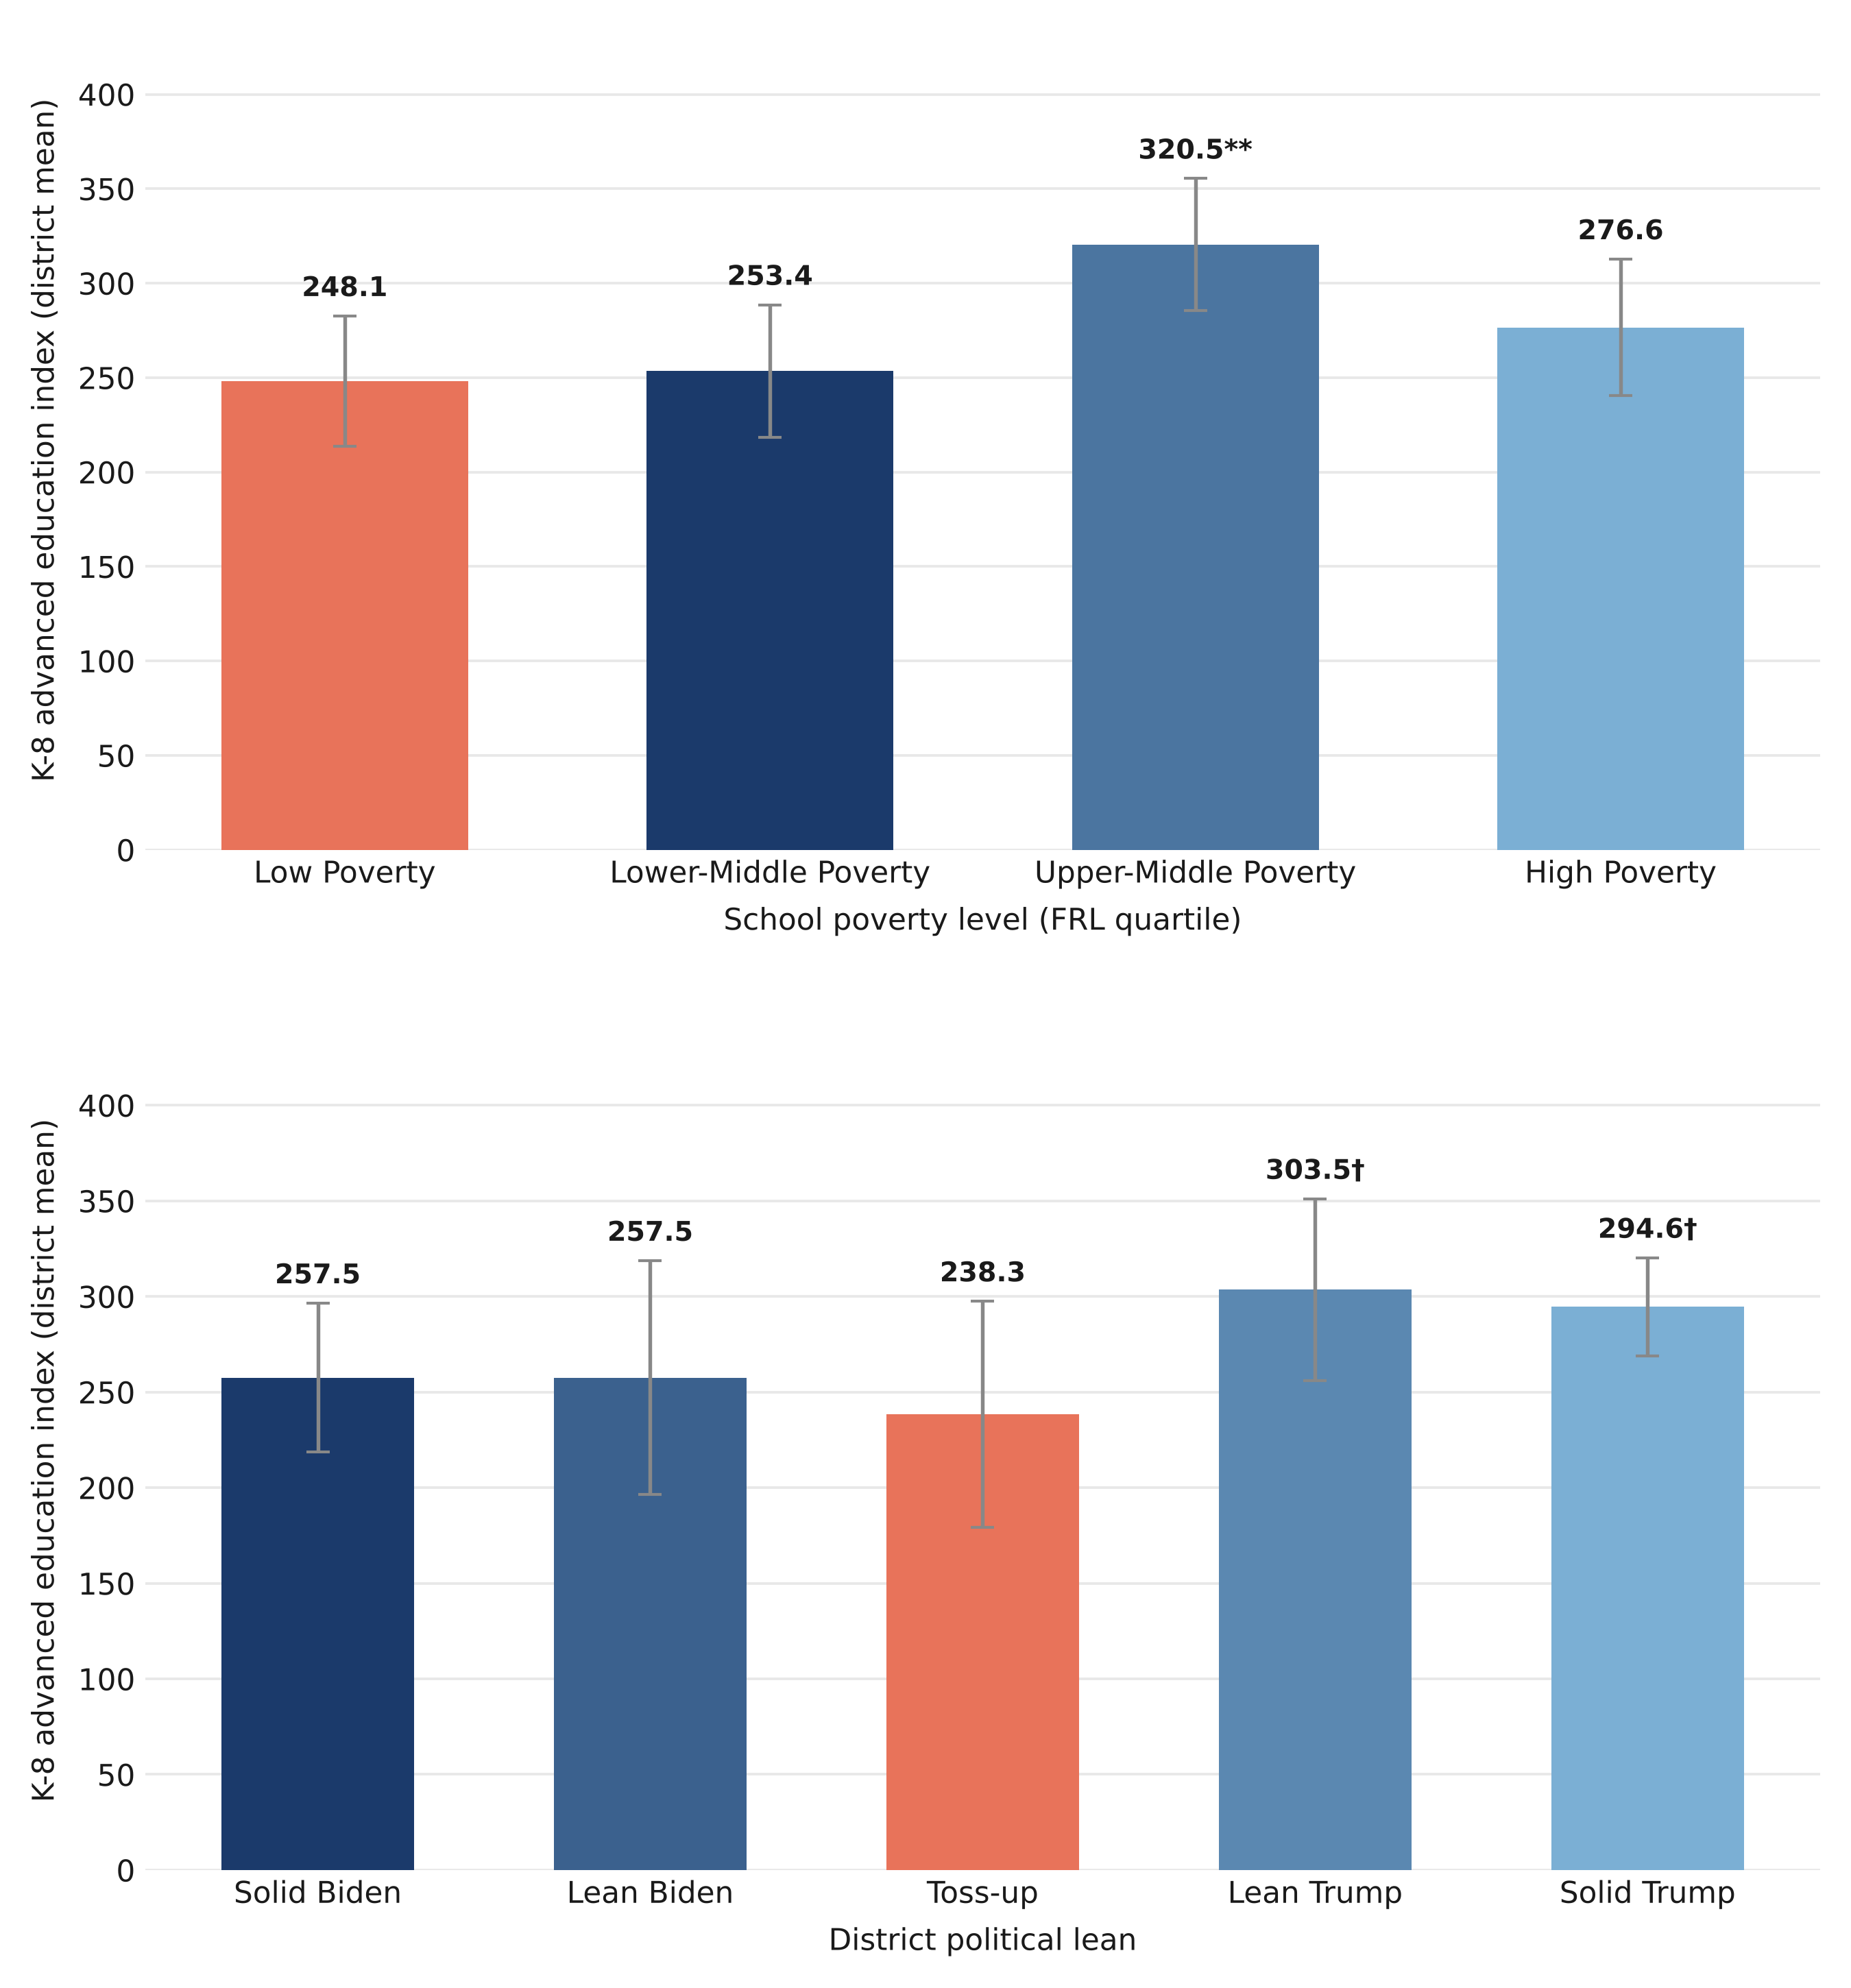
Figure 1. Districts with stronger advanced education policies tend to be slightly poorer and more conservative than the average U.S. district, but these relationships are weak.

Note: Salmon bar = base category. Error bars indicate 95% confidence intervals. Stars indicate significance vs. base category: †p<0.10, *p<0.05, **p<0.01, ***p<0.001. Overall F-test p-values — School poverty: 0.056; Political lean: 0.046.

These trends hint at a political zeitgeist where liberal-leaning areas appear slightly less open to advanced education policy in the early grades. Although the result matches some common perceptions[2], this trend should not be overstated. Both liberal aversion to early advanced education and conservative openness to it are only weakly related to district advanced education policy. The second pattern, in which higher-than-average-poverty districts have slightly stronger policies, may be a product of the first: Politically conservative districts have higher poverty rates on average.

Finding 2 Comprehensive advanced education programs in K–8 are associated with participation in K–8 for all students, but they don’t close race/ethnicity or socioeconomic gaps.

By design, the K8AEI does not account for the number or percentage of students who participate. Rather, it measures the quality of advanced track offerings and the thoroughness of a district’s approach to identifying students for advanced services. So there is no built-in reason to expect districts with stronger policies to enroll more students. Moreover, one promise of pairing early advanced education with universal or near-universal screening is that it might reach a different, more diverse set of students.

Students are, in fact, more likely to participate in advanced programs in districts with stronger advanced education policies. In the one in ten districts with the strongest policies, 8 percent of students were enrolled in advanced programming, compared with 6 percent in districts without any of the policies included in our K8AEI measure (Figure 2).

That said, the difference was only marginally significant, and the relationship is similar across demographic groups. Stronger K–8 advanced education policies are associated with greater participation among both underrepresented student groups (meaning Black, Hispanic, and American Indian students) and overrepresented student groups (meaning White and Asian students). In other words, advanced education policies are linked to more advanced participation among underrepresented groups, but they don’t narrow racial or ethnic participation gaps. We found similar patterns by student poverty status and gender (not shown).

Figure 2. Strong advanced education policies enhance opportunities for underrepresented minority students, but don’t close gaps in participation.
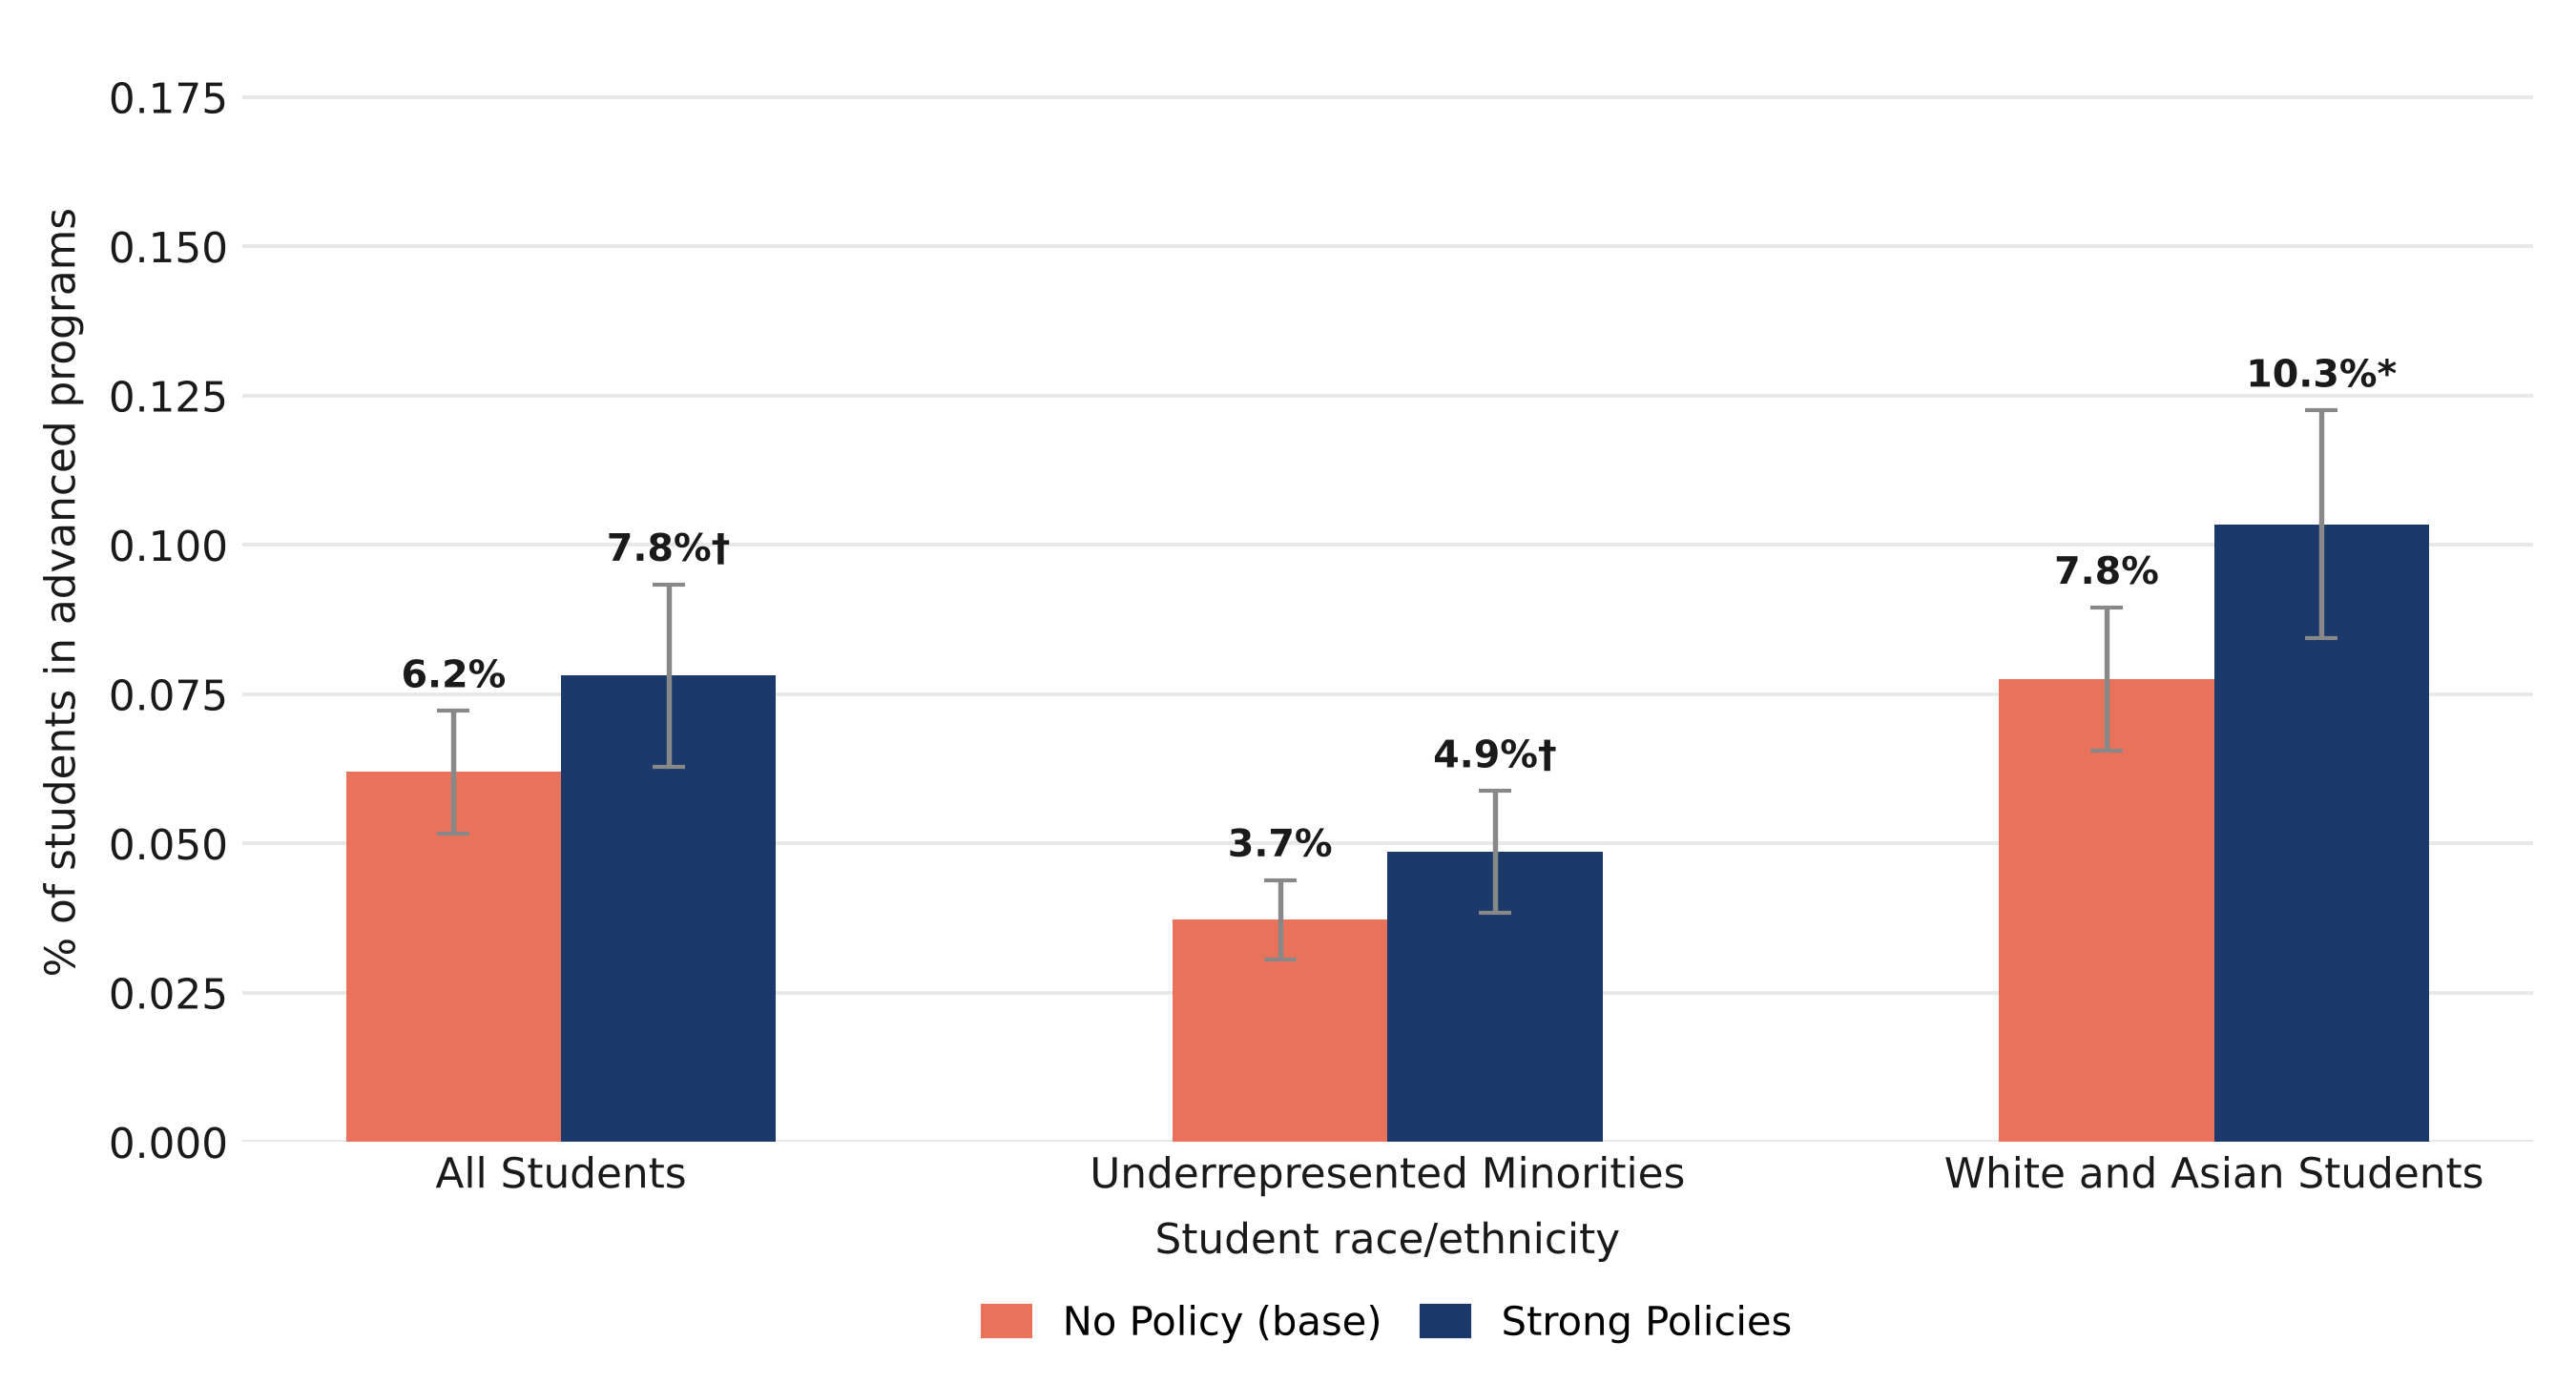
Figure 2. Strong advanced education policies enhance opportunities for underrepresented minority students, but don’t close gaps in participation.

Note: Stars indicate significance of "Strong Policies" vs. "No Policy" within each group (†p<0.10, *p<0.05, **p<0.01, ***p<0.001). Salmon bar = base category. Error bars indicate 95% confidence intervals. Overall p-values — All: 0.002; Underrepresented minorities: 0.003; White and Asian: 0.000.

Finding 3 Districts with stronger advanced education policies in K–8 offer a wider selection of advanced courses in high school, but participation is no higher.

Advanced education in K–8 might also drive greater participation in key advanced courses in high school. As a precursor to examining participation in the most consequential of those courses, such as AP and IB, we first looked at course offerings, which might be broader in districts with stronger pipelines. Our survey asked district leaders whether they offered high school honors classes in English, math, science, social studies, and foreign languages.

Districts with stronger advanced education policy in the early grades do offer honors classes in more subjects in high school. Districts with no K–8 advanced education offered honors courses in an average of 2.5 of the five subjects, compared with 3.7 in districts with strong K–8 policy (Figure 3). Districts with weak or moderate K–8 policy fell in the middle (3.3 and 3.4 subjects, respectively). This relationship suggests continuity between district advanced education policy in K–8 and in high school.

Figure 3. Districts with stronger advanced education policy in K–8 offer more honors courses to students in high school.
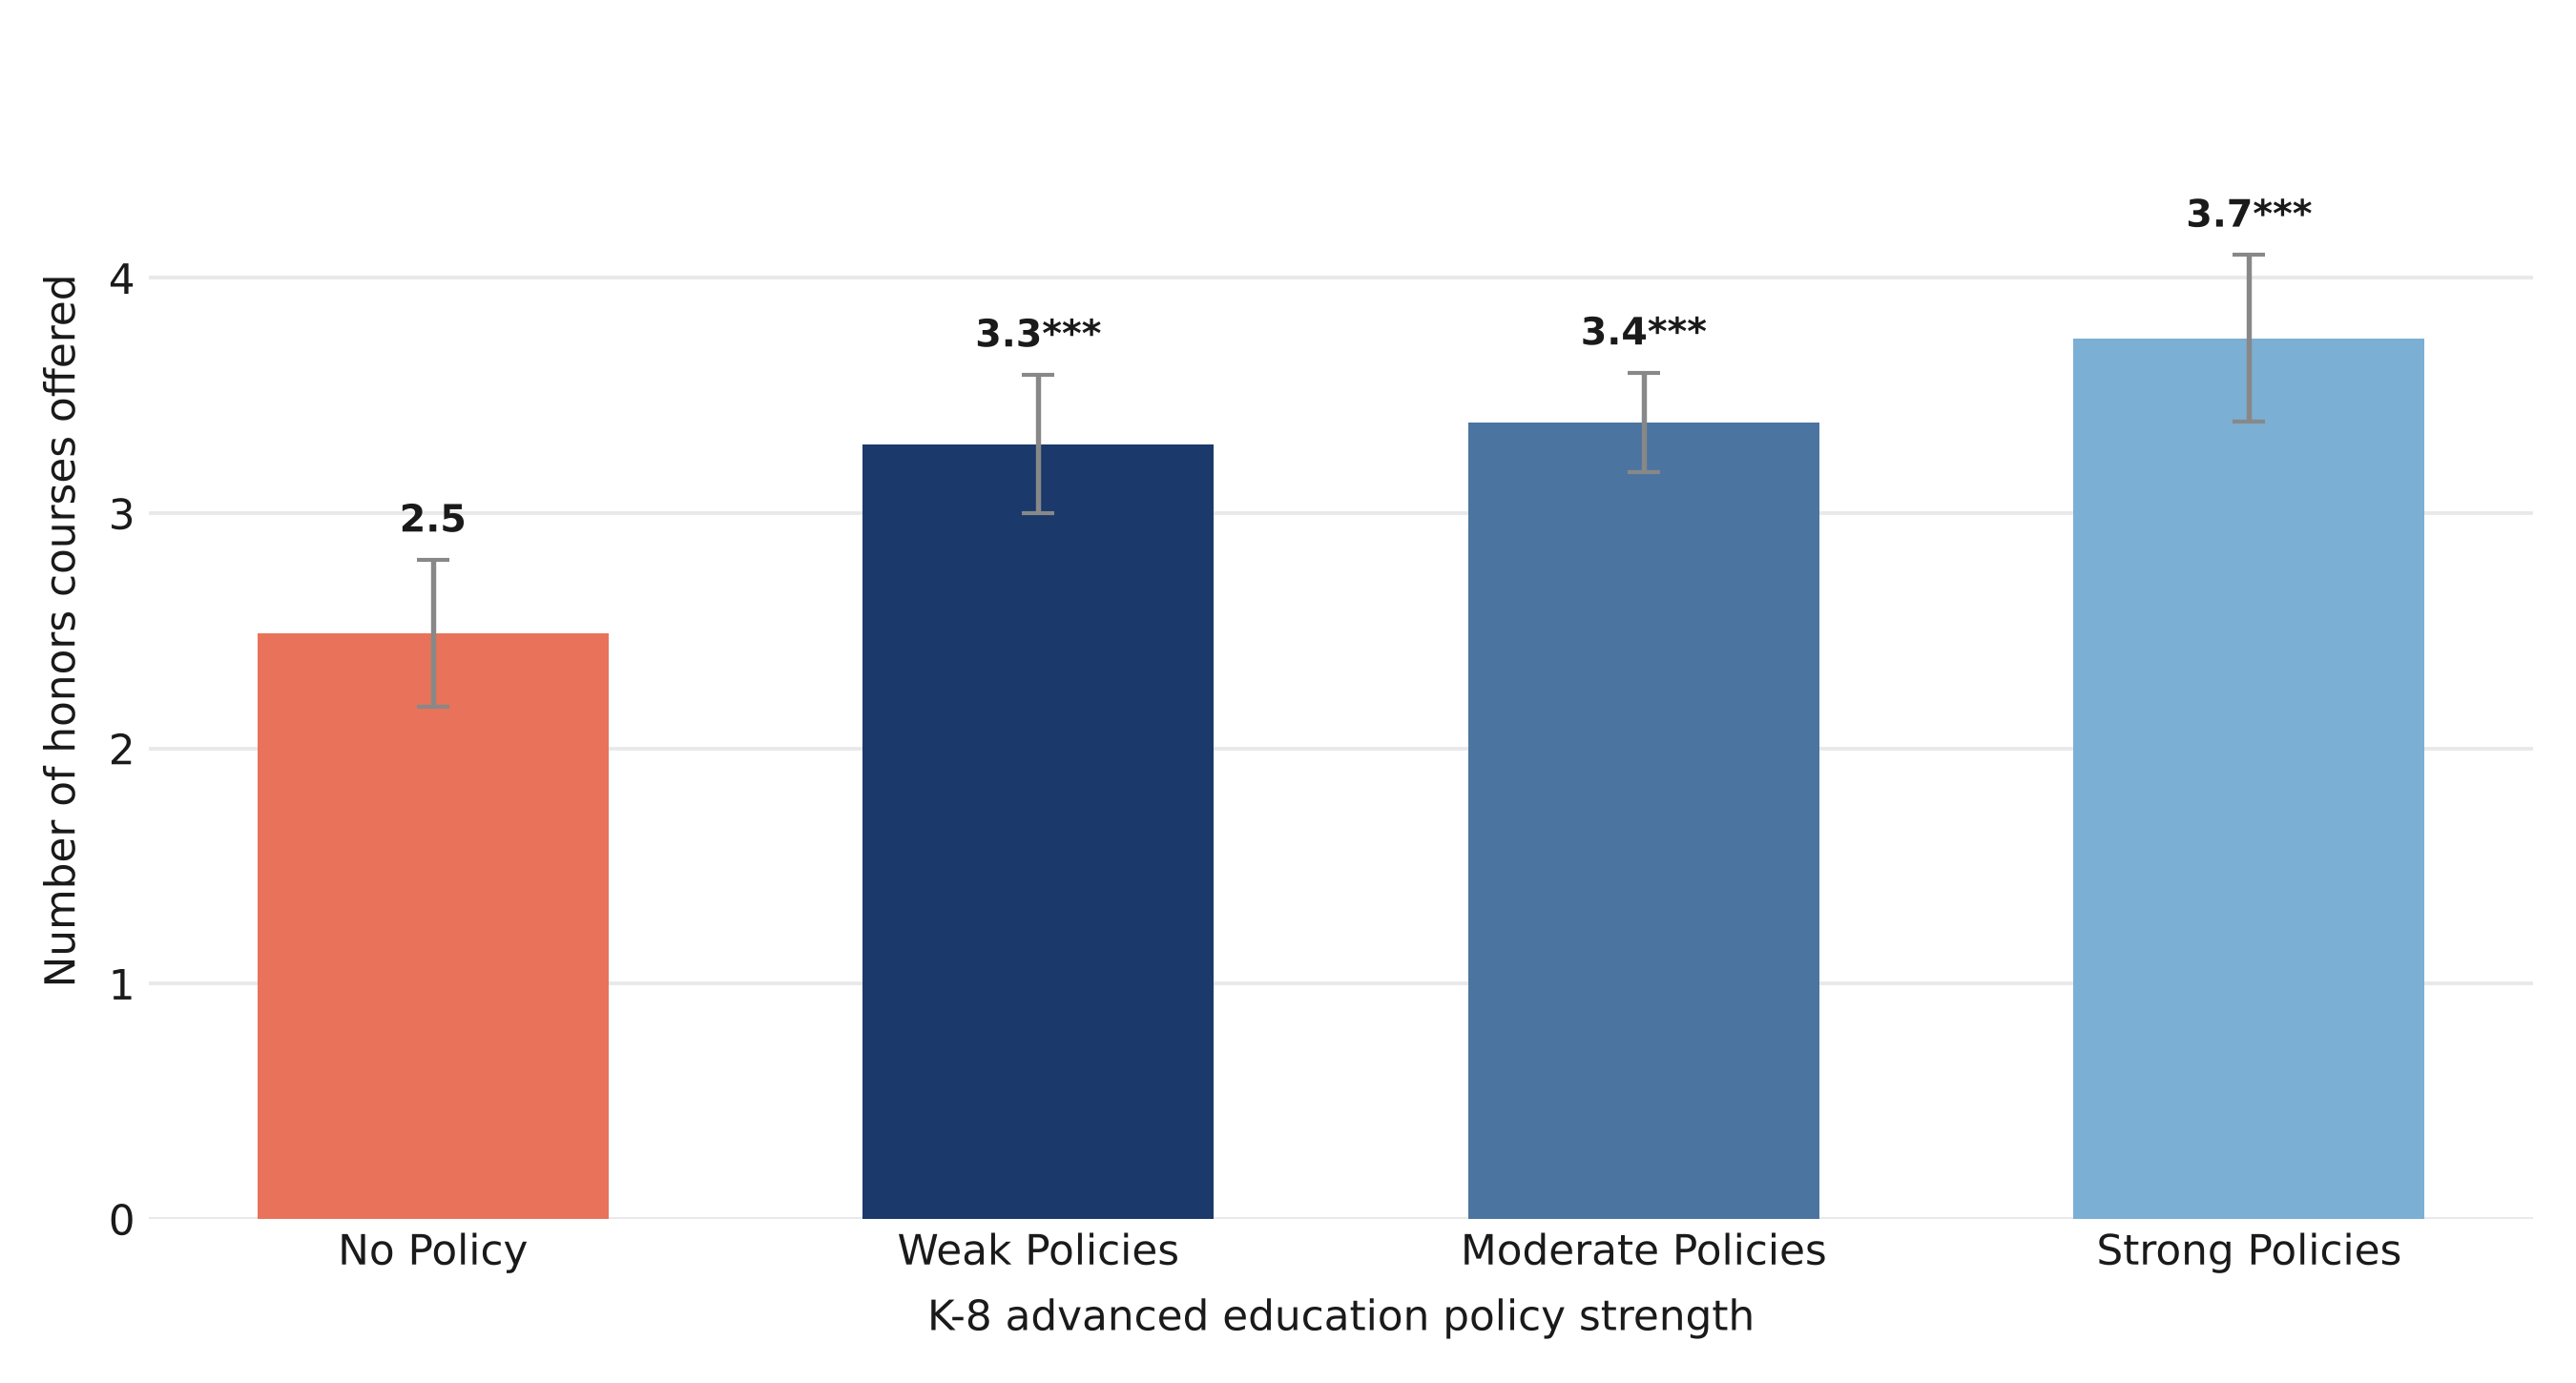
Figure 3. Districts with stronger advanced education policy in K–8 offer more honors courses to students in high school.

Note: Overall F-test p = 0.000. Salmon bar = base category. Error bars indicate 95% confidence intervals. Stars indicate significance vs. base category: †p<0.10, *p<0.05, **p<0.01, ***p<0.001.

However, in districts with stronger K–8 pipelines, broader honors offerings did not translate into greater participation in college-level coursework. Using CRDC data on the share of each district’s high school students who took at least one AP, IB, or dual enrollment course, we tested whether the strength of K–8 advanced education policy predicted participation. In fact, districts with the strongest K–8 policies had the lowest AP course participation in high school compared to districts with no, weak, or moderate K–8 policies (see Figure 4). Overall, K–8 policy strength and AP participation are significantly negatively correlated.

Outlier Effect

The negative correlation between K–8 policy strength and AP course participation is entirely driven by a small number of districts with the highest rate of participation in AP. Only eight districts had more than 30 percent of their high school students participate in AP courses. Every one of these districts has either no or very weak K–8 advanced policies, and all are in suburbs around large U.S. cities. Students enrolled in these districts are far less likely to be poor (24 percent eligible for free or reduced-price lunch, compared to 42 percent across the sample), and though they enroll many Hispanic and Asian students, few of their students are Black (4 percent versus 11 percent across the sample). In other words, high AP participation may reflect favorable demographics and suburban contexts, not a lack of strong K–8 policies.

When these eight districts are excluded from our sample, there is no correlation between the strength of a district’s K–8 advanced policies and high school AP course participation. Still, the eight districts with the highest rate of AP course participation achieved those rates without strong advanced education in the early grades. District leaders might see these districts’ high AP participation and conclude that strong advanced education policies in the early and middle grades are unnecessary. But correlation is not causation; these districts’ AP participation might be even higher with robust K–8 advanced education policies in place.

Figure 4. Districts with the strongest K–8 advanced education policies have lower rates of AP participation.
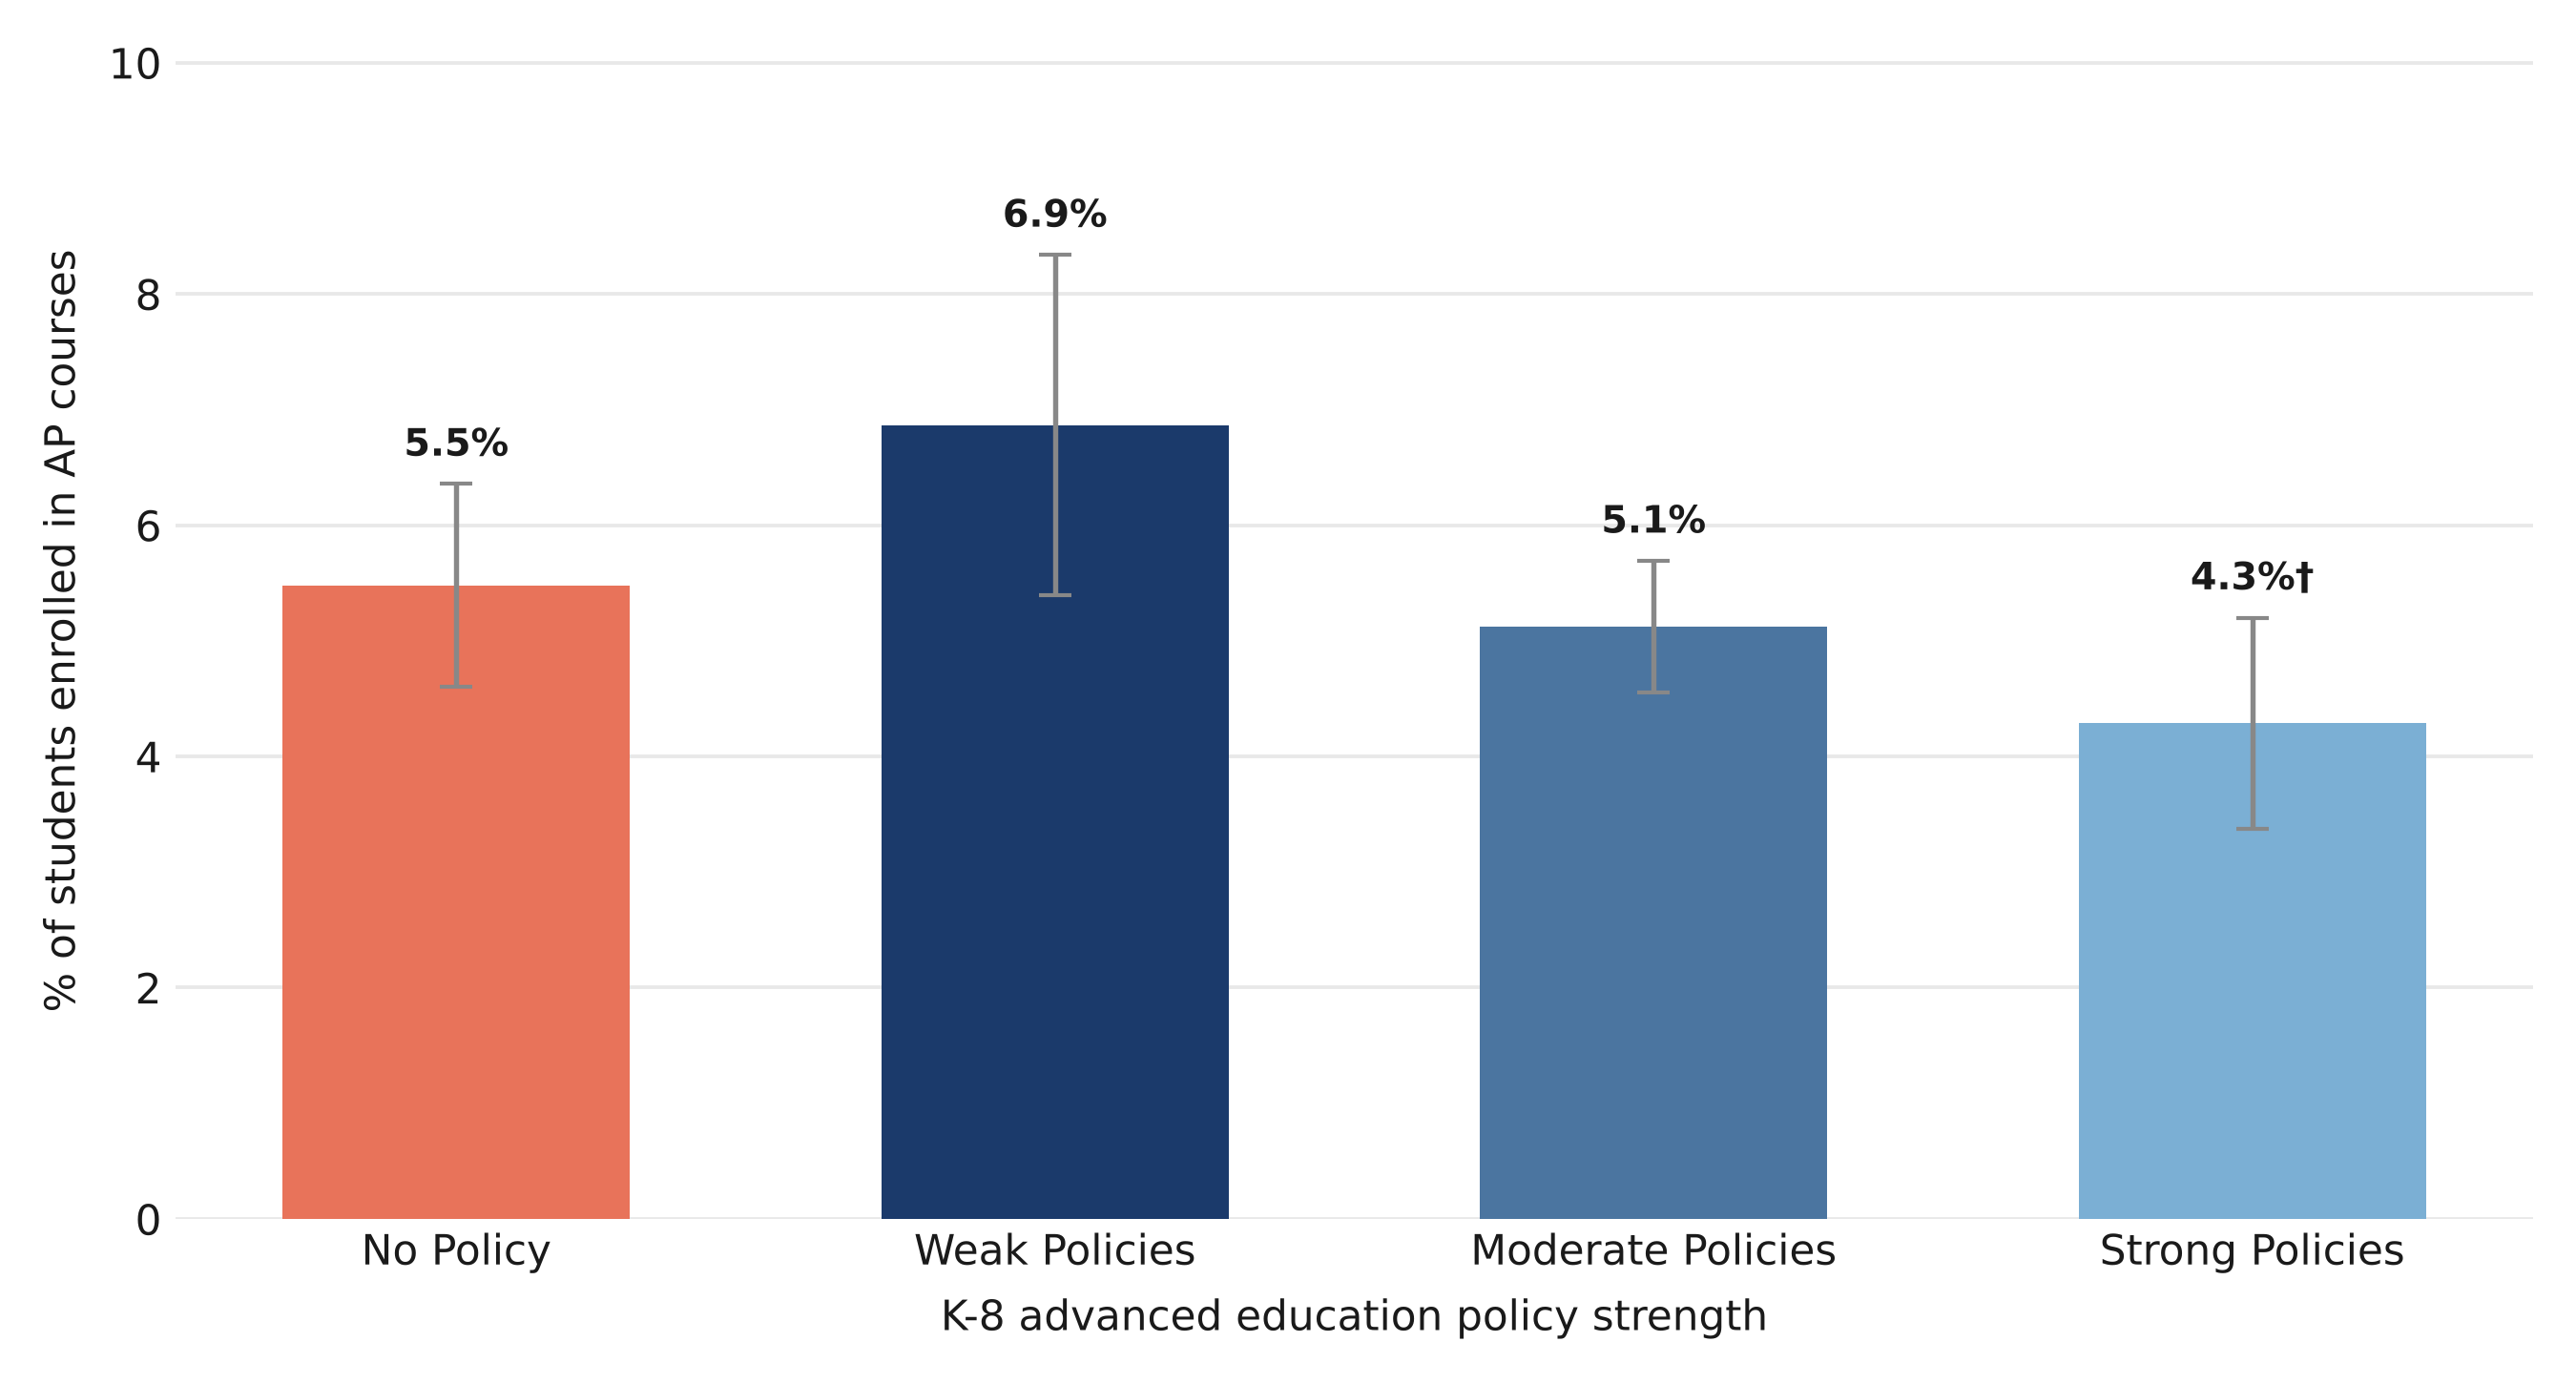
Figure 4. Districts with the strongest K–8 advanced education policies have lower rates of AP participation.

Note: Overall F-test p = 0.061. Salmon bar = base category. Error bars indicate 95% confidence intervals. Stars indicate significance vs. base category: †p<0.10, *p<0.05, **p<0.01, ***p<0.001.

Similar tests of high school participation in IB, dual enrollment, and advanced math (a key predictor of success in STEM) found no relationship between K–8 advanced education policy strength and any of these enrollment rates. Figure 5 compares districts with no early advanced education policies to those with strong policies; including districts with weak or moderate policies does not change the picture.

Figure 5. District K–8 advanced education policy is not associated with participation in advanced math, dual enrollment, or IB courses in high school.
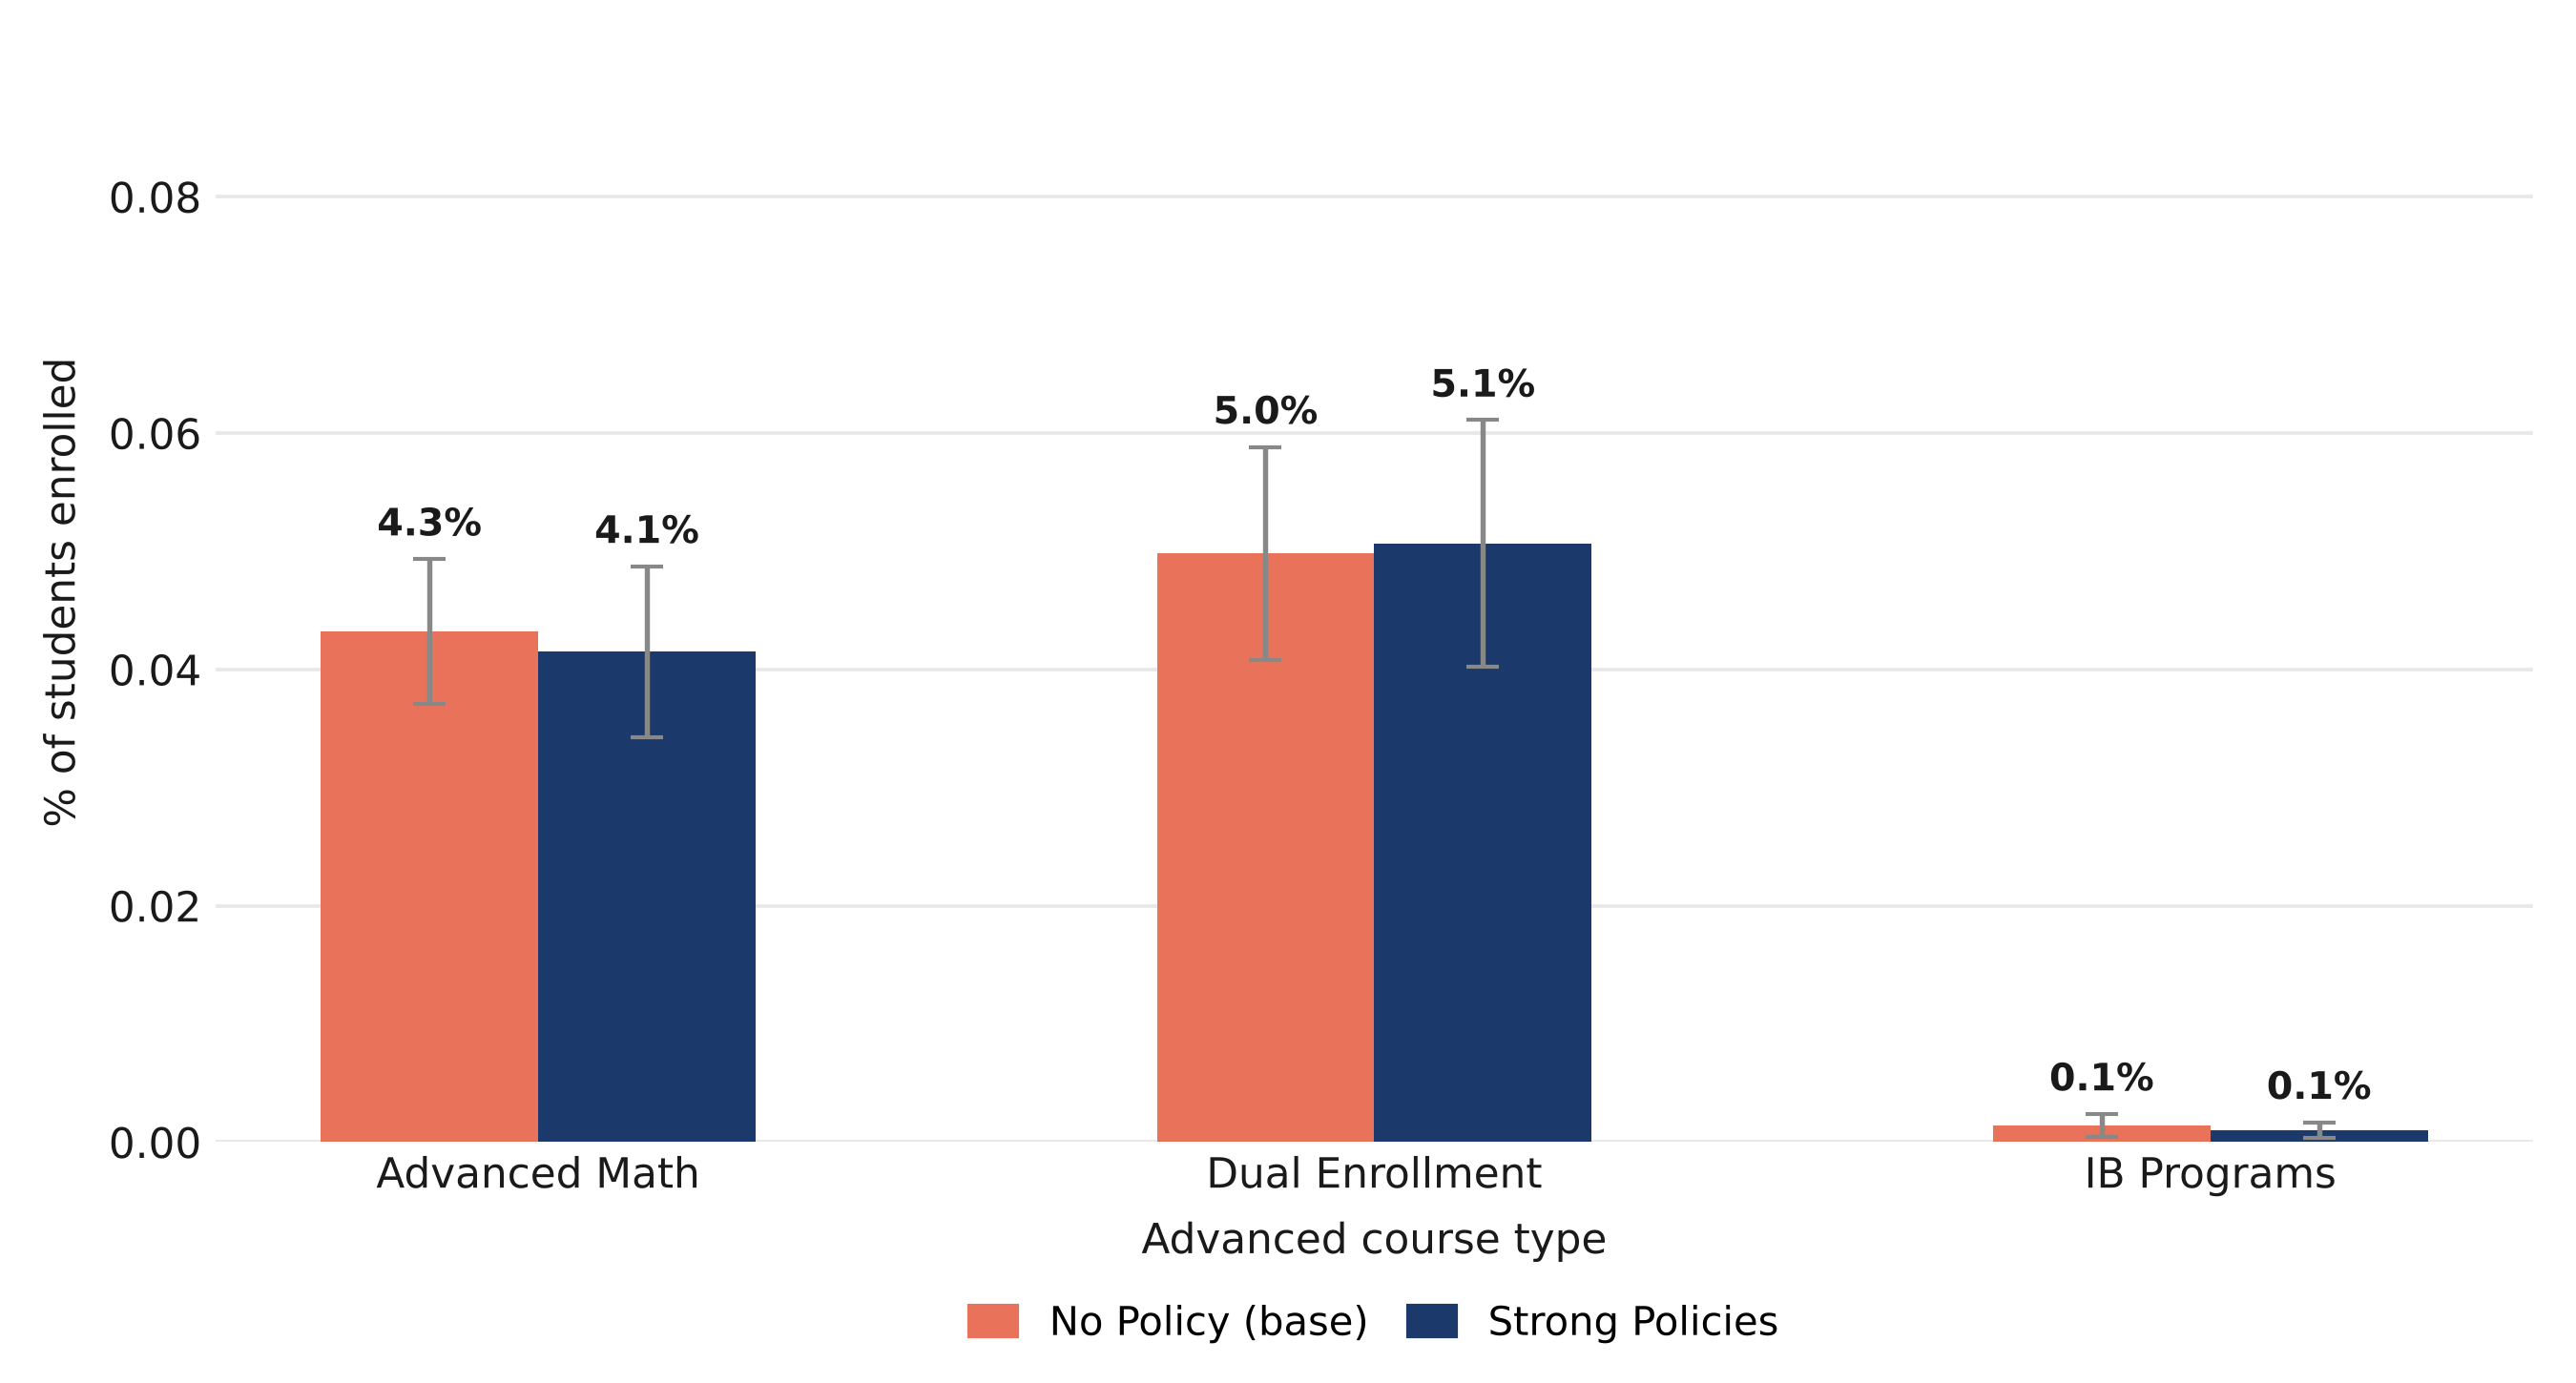
Figure 5. District K–8 advanced education policy is not associated with participation in advanced math, dual enrollment, or IB courses in high school.

Note: Stars indicate significance of "Strong Policies" vs. "No Policy" within each group (†p<0.10, *p<0.05, **p<0.01, ***p<0.001). Salmon bar = base category. Error bars indicate 95% confidence intervals. Overall p-values — Advanced Math: 0.926; Dual Enrollment: 0.772; IB Programs: 0.907.

It is worth pausing on what this finding does and does not tell us. That districts with stronger K–8 advanced education policies offer more honors courses in high school is consistent with a broader policy culture around advanced education. Districts that take advanced learning seriously in the early grades appear to also do so in high school, at least when it comes to course availability. But the availability of courses does not guarantee that students take them. As The Broken Pipeline report documented, most districts with AP programs maintain prerequisites that can limit access for students who did not arrive at ninth grade on an accelerated track.

The lack of a positive relationship between K–8 advanced policy and college-level course-taking within districts is puzzling, but as with many things, it is easier to say a district has implemented a policy than to implement it well. We measured K–8 policy strength using district leaders’ self-reports. It is entirely possible that these policies take years to implement well, or that leaders misstated what their districts actually have in place. Alternatively, this finding could come down to the limits of a descriptive study. Perhaps districts adopt stronger early-grade policies because they already struggle with advanced-course participation in high school, and without these policies, participation would be even lower.

Recommendations

The findings in this report reveal a gap between what districts intend and what their advanced education systems actually produce. Strong K–8 advanced education policy, as we have measured it, is associated with participation in K–8. But districts with strong policies do not have higher rates of advanced course-taking in high school. That is not an argument for abandoning investment in early advanced education. It is an argument for building better programs and for being clear-eyed about what it takes to get results. The following recommendations are for policymakers and district leaders who want not just advanced education policies on the books but programs that change outcomes.

1.

Make acceleration the rule, not the exception.

Advanced education works only if students actually move through material faster than their peers. Too many districts with advanced programs in name deliver something closer to enrichment—interesting, perhaps, but not materially faster-paced than general education. The Broken Pipeline found that fewer than 30 percent of districts offer grade acceleration and that full-time advanced settings remain rare. If districts want students to arrive at ninth grade ready for college-level coursework, the path runs through real content acceleration: pushing advanced students to learn more than their peers every year. That could mean more grade skipping, more subject-level acceleration in math and reading, doubling up on courses, and more settings where advanced students spend most of the school day on advanced content with similarly advanced peers.

2.

Close the data gap on implementation fidelity.

This report can tell us which districts have stronger or weaker advanced education policies on paper. It cannot tell us whether those policies are being implemented, whether identified students are actually receiving services, what those services look like in practice, or when and why students fall out of the pipeline. That gap matters enormously. A district that reports having universal screening, a distinct advanced curriculum, and an accelerated instructional setting earns points on our index regardless of whether those policies function as intended, or at all. We need better data at every stage of the pipeline: identification rates and the criteria used, the type and intensity of services provided to identified students, the proportion of identified students who remain in advanced programming through the middle grades, and the share who ultimately enroll in AP, IB, or dual enrollment in high school. Districts and states should require transparent public reporting on each of these, so that families, researchers, and policymakers can distinguish programs that exist on paper from programs that move students forward.

3.

Recognize that liberal and conservative areas face different problems and need different solutions.

The political geography of this report’s findings points to two distinct gaps that call for distinct responses—though here we are leaning on speculation. In affluent suburban districts, which tend to lean Democratic and achieve high rates of AP participation without strong early-grade advanced education programs, the gap is one of access and equity within a high-functioning system. Students in these districts reach advanced coursework in high school, but the path there runs through family resources, private tutoring, and social capital rather than systematic early identification and programming. Those systems tend to serve well-connected students well and everyone else inconsistently. Building a stronger early-grade pipeline in these districts is not about raising AP participation rates that are already high; it is about giving students who are not already finding their way to advanced coursework a fair shot.

Conservative-leaning districts face a mirror-image problem. These districts tend to have stronger K–8 advanced education policies, suggesting a more intentional early-grade pipeline, but our results indicate that this is not translating into higher participation in AP and other advanced courses. We suspect that the bottleneck in these settings is not the K–8 pipeline; it is what the pipeline leads to. These districts may lack the enrollment numbers to sustain a full AP course catalog, and students who arrive at ninth grade academically prepared for advanced work may have no in-person access to it. Expanding online AP course access, dual enrollment partnerships with community colleges, and state-level supports for districts running advanced programs would help ensure that these districts’ investment in early advanced education pays off.

Endnotes

[1] The nonsignificant results for district size and urbanicity may reflect our sample choices. We sampled only large and midsize districts. Our sample certainly includes rural districts, but the smallest and most rural districts fell outside our sampled population.

[2] New York City offers a stark example. Mayor Bill de Blasio moved to eliminate the city’s gifted and talented program in 2021 under pressure from progressive activists who viewed it as inequitable. His successor, Eric Adams, reversed course and expanded the program citywide in 2022. Mayor Zohran Mamdani, inaugurated in January 2026, has called for phasing out gifted-and-talented programs beginning in kindergarten. However, as of this report's publication, no changes to the gifted-and-talented admissions process have been announced for fall 2027.

About this Study

This report was made possible through external philanthropic support, most notably the Gates Foundation, as well as from our sister organization, the Thomas B. Fordham Foundation.

We are grateful to authors Adam Tyner, formerly of the Fordham Institute and currently with the Oklahoma Center for Education Policy, and Brian Fitzpatrick, Fordham’s National Research Manager, for their thoughtful work and commitment to the project. Here at Fordham, we thank David Griffith, Chester E. Finn, Jr., Michael J. Petrilli, and Amber M. Northern for providing feedback on the draft; Stephanie Distler for managing report production and design; and Victoria McDougald for overseeing media dissemination. The views expressed are those of the authors alone and do not necessarily reflect those of the foundations that supported this work. The Thomas B. Fordham Institute retains sole discretion over the content of this report.

coming soon cover
Sonya Yates
11.17.2026
Students reading
Getty Images/Jacob Wackerhausen
Listen to this article
Loading the Elevenlabs Text to Speech AudioNative Player...

By now, everyone who deals with education policy has heard of the “Southern Surge”: the group of Southern states bucking the national trend of declining reading achievement. One of the main players is my home state of Alabama, one of just two states in the country to improve its fourth-grade NAEP reading scores between 2019 and 2024.

A new report from the Thomas B. Fordham Institute, Studying the Southern Surge: How Alabama Beat the Odds in Reading, takes heed of this accomplishment, examining Alabama’s literacy progress and the conditions that helped make it possible. Its conclusions reinforce an important lesson for states working to improve reading outcomes: Adopting strong literacy policy is essential, but what happens after legislation passes matters just as much.

The Fordham report does a great job of capturing the high points of the effort to pass the Alabama Literacy Act and the results of its implementation. Behind those milestones are years of advocacy, unexpected connections, hard conversations, and determined people who believed Alabama could do so much better for its students.

While the report rightfully attributes much of the credit for Alabama’s recent success to the Alabama Literacy Act (ALA) and its implementation, I saw firsthand that our success story is just as much about what happened behind the scenes, both before and after the Literacy Act’s passage.

Before the Act

Back in 2015, Alabama’s state school board took an important step by adopting the Dyslexia Amendments to the Alabama Administrative Code. Alabama, like most states, had not previously formally recognized dyslexia or adequately addressed the needs of students with characteristics of dyslexia. These amendments established requirements for dyslexia screening, teacher professional development, parent notification, and early intervention by a trained interventionist. They also created the Alabama Dyslexia Advisory Council, bringing together dyslexia advocates, therapists, and parents who continued to push for implementation of the Amendments. These amendments laid the groundwork for what would eventually become the ALA.

By 2017, those of us on the Strategic Reading Committee were looking closely at Mississippi’s reading results and the early signs of what would become known as the “Mississippi Miracle” or, more aptly, the “Mississippi Marathon.” Within just four years of the passage of the 2013 Literacy-Based Promotion Act, Mississippi’s fourth-grade reading scores had improved over half a grade level, or six points, on the Nation’s Report Card. We wanted to know what Mississippi was doing differently.

In 2018, I reached out to Dr. Kymyona Burk, then Mississippi’s state literacy director. The subsequent email exchange would help change the trajectory of literacy work in Alabama. I put her in touch with Nick Moore from Alabama Governor Kay Ivey’s Office of Education, and together we planned a trip to meet with Mississippi’s Department of Education.

That trip lit a fire in us. We saw firsthand what it looked like when the pieces all worked together. There was alignment across their state department. Mississippi was paving the path, and its leaders were willing to share their road map. They were getting results and made us believe it was possible. We came home determined to develop a comprehensive literacy policy that could produce the same sustained improvements as Mississippi’s comprehensive early literacy policy approach.

1

Members of Governor Ivey’s Executive Leadership Team for Grade Level Reading and other Alabama state department staff pose for a picture during the meeting with the Mississippi State Department.

Later that year, I began working with Moore, Alabama State Representative Terri Collins, and ExcelinEd’s Cari Miller on the first draft of what would become the Alabama Literacy Act. To ensure alignment with newly adopted expectations of the Dyslexia Amendments, we included in the ALA several of those components, such as screening, early intervention, and professional learning, as well as recommendations from the Strategic Reading Committee.

The Literacy Act faced skepticism and resistance in its early days. For example, we kept hearing that Alabama was already doing much of what we’d proposed. One major challenge was helping people see how the pieces could work better as a more comprehensive, coherent system. The ALA connected science of reading professional learning, literacy coaching, aligned educator preparation, early identification of struggling readers, and intensive intervention with sustained state investment.

That sounds like a lot, but the law’s goal is simple: Ensure all students receive strong, high-quality instruction from the beginning so fewer students require intensive intervention. At its core, the ALA is a prevention-first model.

Still, another set of concerns remained around the law’s third-grade retention provision. We designed the law so that retention would be a last resort, used only when preventative supports had not yet gotten a student where he or she needed to be to meet the reading demands of later grades. Retention provides another year of intensive support, giving the student an opportunity to catch up with peers.

To address those concerns, we focused our conversations on prevention first and what was needed to support struggling readers. In one presentation, I conducted a dyslexia simulation, asking legislators to read an Old English version of “Little Red Riding Hood.” Their difficulty decoding the text proved helpful in shifting the conversation from the retention provision to experiencing what it feels like to be a struggling reader in a classroom.

We also brought the discussion back to a simple question: “Do we want all students to read?” It was difficult for anyone to answer no. This allowed us to focus the conversation on what adults could change to make it possible.

Alabama’s students needed more, and we knew it. Parents, members of the Alabama Dyslexia Advisory Council, Alabama Scottish Rite supporters, and many others called, emailed, and advocated for the bill. One state board member called us “relentless.” We had to be. Kids’ lives and the future of our state depended on getting this right.

After the Act

When the Alabama Literacy Act passed in May 2019, we celebrated. But we knew the work was far from over. Passage is only the starting line for implementation. And implementation is where policy succeeds or fails. Two things became especially important: the guidance of the Alabama Literacy Task Force and a renewed commitment to reinvesting in the Alabama Reading Initiative.

Created by the Literacy Act, the Alabama Literacy Task Force (LTF) brought together a carefully selected group of educators, specialists, and experts who met high-level criteria. They were charged with making recommendations related to curricula, assessments, and other components needed for implementation. I would later have the privilege of chairing that task force from 2021 to 2023, serving alongside Dr. Kymyona Burk for part of that time.

The law clearly outlined the LTF’s responsibilities, and we worked under the guidance of Alabama’s Department of Education using established policies and procedures for vetting and recommending resources and materials. It was intense and rigorous work, but essential to building a coherent literacy system in Alabama. We knew every recommendation could impact what happened in classrooms and the experiences of students across the state.

Alabama also needed to reinvest in its coaching infrastructure. From the late 1990s to the early 2000s, full-time reading coaches had been central to the Alabama Reading Initiative (ARI), but funding and supports had declined over time. It was time to restore ARI’s leadership and give teachers the support they needed to strengthen instruction.

As Fordham’s report notes, two concurrent developments brought new life to coaching in Alabama. First, the Literacy Act defined coaching roles and ensured that support was targeted where it was most needed. Second, ARI funding increased dramatically, from $40.7 million in 2018 to nearly $152 million for the 2026–27 school year. With these dollars, ARI was able to create a more robust coaching structure: Now, regional literacy specialists support the reading specialists already in the schools, and regional literacy leadership specialists support principals and district leaders.

And today, seven years after the Literacy Act’s passage, we are starting to see how both this comprehensive law and the structures built around it for implementation are leading to better outcomes for students. For the first time since 2011, Alabama is roughly on par with the national average for fourth graders achieving at or above proficiency.

What matters most

Looking back, Alabama’s progress can appear much more straightforward than it felt while we were living it. But no single person put Alabama on the map for literacy. It took legislators willing to act and fund the work, state leaders willing to make changes, educators willing to learn new approaches, parents willing to advocate, and organizations willing to stay engaged for the long haul.

ExcelinEd is proud to be one of those partners, from helping shape the original policy and supporting its passage to continuing to champion strong implementation. It is one of the reasons why I joined the team.

Alabama’s story reminds us that strong policy matters. But policy alone does not change outcomes. Policy creates the framework. People make it real.

And for those of us who were there from the beginning, Alabama’s progress is a reminder of why we kept pushing, even when we were told it couldn’t be done.

#UntilTheyAllCanRead

Policy Priority:
High Expectations
Topics:
Evidence-Based Learning
Curriculum & Instruction
Governance
Teachers & School Leaders
Adam Tyner, Ph.D.
11.17.2026
F grade
Getty Images/IcemanJ
Listen to this article
Loading the Elevenlabs Text to Speech AudioNative Player...

Grade inflation has run rampant since the pandemic, but people are finally starting to notice. Compared to 2022, fewer parents today believe their children are performing above grade level. Policymakers from California to South Carolina have pushed back on so-called “equitable” grading reforms, which lower academic standards in the name of “equity.”

Adopted in many schools in the Covid era, equity grading policies quickly became a major driver of grade inflation. One “equity” policy that continues to rear its ugly head is the grading floor (sometimes called “minimum grading” or “no zeros”), which requires teachers to award a minimum score—typically 50 percent—even when a student had earned a lower score or hadn’t turned anything in at all.

A persistent argument raised by some equitable grading reformers is that awarding a student a zero (or another low score) on a 0–100 scale is “mathematically inaccurate.” For example, responding to South Carolina's new law banning grading floors, grading expert Thomas Guskey told Education Week in August that the practice makes sense “from a mathematics perspective,” even if the policy “drives teachers nuts.”

Call me a cynic, but when I encounter the “mathematical accuracy” argument, I see a technocratic veneer covering a bleeding-heart impulse to lower standards and inflate grades. When grading reformers say that their grading scales are “more oriented towards success,” I have trouble believing that anyone is buying such an obvious euphemism for grade inflation. Yet the argument has marched on, essentially unrebutted.

So allow me this small contribution to the discourse.

The argument is laid out succinctly by Scott Marion in a 2022 blog post for the Center for Assessment. Marion argues that, on a traditional 100-point scale, roughly 60 percent of possible scores receive an F, while each of the other letter grades occupies only about 10 percent. “How does allocating nearly two-thirds of the number line for a grade of F make any sense?” he asks.

He then offers a thought experiment. Two equally weighted assignments receiving scores of 0 and 100 average to 50, an F. Yet if we converted those scores to letter grades first, Marion suggests, most people would say that an A and an F should average to a C. He concludes that assigning zeroes is simply "bad math." (Marion also recently wrote that “[grading] floors recognize the reality of a simple number line. This is not a woke argument. It is a mathematical one.”)

Yet these arguments are not about math.

The first is an appeal to intuition. Marion believes two-thirds of the number line should not represent failure, but there is nothing mathematical about that belief. A teacher or school requiring students to earn at least 60 percent of available points to pass is establishing a performance standard, not making a mathematical claim.

The second argument commits a more fundamental error: It incorrectly assumes that averaging numerical scores and averaging the letter grades assigned to those scores should always produce equivalent results. It is true that both the 0–100 scale and the 0–4 GPA scale are accepted for many purposes and that the GPA scale is more forgiving. Yet the acceptance of one scale does not invalidate another. Grading scales, whether 0–4, 0–100, pass/fail, check marks, percentage scores, or anything else, are social conventions, not mathematical truths.

Indeed, teachers routinely employ various grading systems, and each involves judgments about what different levels of performance mean. A teacher might award 40 percent on a five-question quiz because a student answered two questions correctly. That teacher might give scores from 0 to 100 on an essay based on a grading rubric. And she might employ a “check” scale on a low-stakes homework assignment. Neither mathematics nor measurement theory can dictate whether a given score merits “passing” or exactly how results ought to be averaged into a final grade. It is the job of teachers, administrators, and policymakers to balance all the factors that play into how grading can be calibrated to preserve transparency about performance and motivate students.

(And what could be more demotivating than earning a 60 after trying your best, only to find that your classmate received a 50 for doing nothing?)

Of course, if we want to debate mathematical accuracy in grading, it is the grading floors themselves that do violence to basic math. I once talked to a teacher who opened his digital grade book the day after their district adopted these policies and found that all grades that had been lower than a 50 had automatically been updated (i.e., inflated) to 50 percent. The idea that a kid who gets one question out of 10 correct on her homework deserves a 50 percent is the one that truly defies mathematical sense, which is probably why so many educators say grading floors harm academic engagement.

The problem with the grading reforms is not that they wish to make grading more standardized and sensible; it is that they ignore the many ways that their policies can lower standards and expectations for students. Especially in our era of grade inflation, these trade-offs must be met with open eyes—not couched in misleading language about mathematical accuracy.

Policy Priority:
High Expectations
Topics:
Evidence-Based Learning
Curriculum & Instruction
Governance
Teachers & School Leaders
Aaron Churchill
11.17.2026
School funding narrative blog image
Getty Images/
Listen to this article
Loading the Elevenlabs Text to Speech AudioNative Player...

If you’ve been following the news lately, you might be led to believe that Ohio school districts are barely scraping by. The narrative runs like this: Ill-funded public schools are in crisis, the stingy legislature has made devastating cuts, private schools (and the families they serve) are “siphoning” money, and the whole system is “unconstitutional.” Sung nonstop by the public-school establishment with its political and media allies echoing it, this catchy song is all over the airwaves.

But if you listen closely, you’ll hear nails scraping on the chalkboard. The singers have been hiding important—and basic—facts about school funding in Ohio while presenting misleading numbers to their listeners.

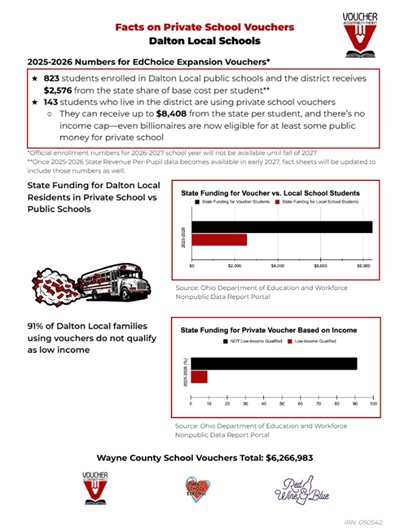
School funding narrative blog Dalton figureConsider this “fact sheet” from the advocacy group that calls itself Honesty for Ohio. It reports that my own local district (which had no part in creating the flyer) receives just $2,576 in base per-pupil state funding. Peanuts, right? Yet that amount seriously understates the district’s actual state funding which, was $5,706 per pupil in 2025–26.[1] Worse yet, the $2,576 number doesn’t come close to my district’s total per-pupil funding, which was $18,216 last year counting local, federal, and nontax sources along with state funds. But that big bottom-line number is omitted because disclosing it would weaken the goal of these “fact sheets,” which is to whip up opposition to state scholarships for kids to attend private schools.

Another example: a recent editorial by Susie Kaeser, an establishment player from Cleveland Heights-University Heights, raises alarms about a “financial crisis facing public schools” and attacks lawmakers for “triggering this crisis.” She includes a widely circulated but highly misleading 32 percent “state share” statistic—which we’ll come back to below. But nowhere in her 600-word piece does she disclose the total funding for Ohio public schools (it’s $17,568 per pupil). She also omits Cleveland Heights-University Heights’s whopping $27,527 per pupil in overall revenue, an amount that puts it among the highest-funded Ohio districts. Remember, total per-pupil funding is what matters most for students, as it represents the resources actually dedicated to their education. But those sums are intentionally ignored because they don’t fit the narrative.

On many occasions, I’ve tried to correct the record on school funding, yet plenty of misinformation keeps circulating. Allow me to review again the basics about school funding in Ohio using the most recent data from 2025–26 (FY26).

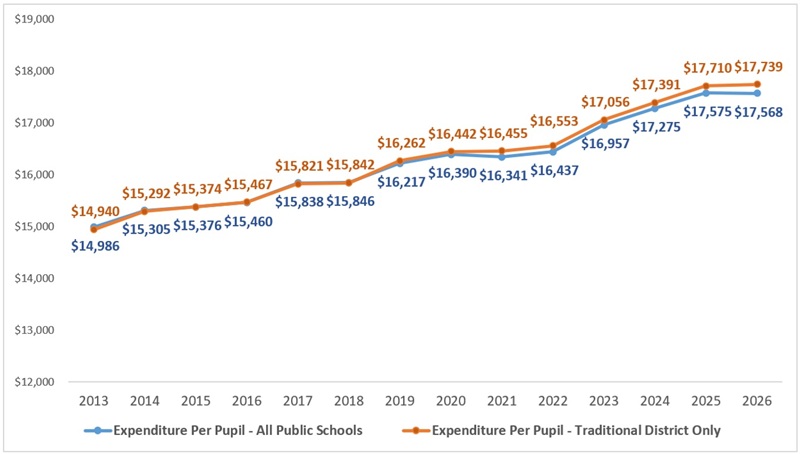
Figure 1 shows inflation-adjusted per-pupil expenditures of Ohio public schools since 2013. We see unambiguous growth, both for all forms of public schools (traditional districts, public charter schools, and JVSDs) and for traditional school districts only. District-only spending reached another record high of $17,739 per pupil last year—18.7 percent higher than in 2013 in “constant” dollars. In other words: Over the past decade—during which school choice has grown—there’s been no “disinvestment” in traditional public schools. In truth, Ohio districts are receiving more money per student now than ever before. Again, that’s after taking inflation into account.  

Figure 1. Statewide expenditures per pupil, adjusted for inflation

School funding narrative blog figure 1
Source: Ohio Department of Education and Workforce, “Expanded List” files. Note: The blue line represents inflation-adjusted (CPI-U) expenditures per pupil for all public schools: traditional district, public charter/STEM schools, and joint-vocational school districts (JVSD). The orange line shows inflation-adjusted expenditures per pupil for traditional districts only. Spending amounts reflect dollars received through state, local, federal, and non-tax sources. The chart does not include capital outlay (e.g., construction and debt service).

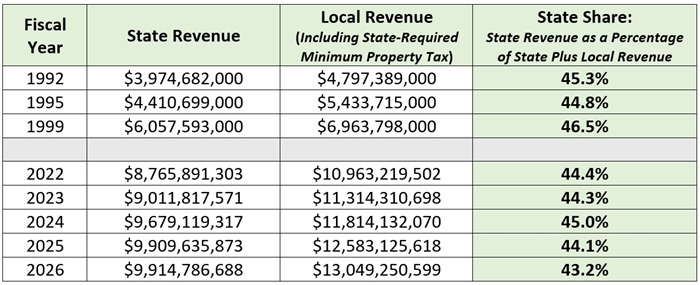
In their latest round of grievances, public-school advocates also claim that the “state share” of public school funding has fallen to 32 percent—the lowest level, they say, over the past couple decades. But that’s not true, either. As the table below shows, the state share was 43 percent in FY26. Note, too, that the table doesn’t show the state’s full involvement in funding Ohio’s public schools. The 20-mill state-required property tax—a fundamental element of the state’s overall foundation funding program—appears in this table as “local revenue.”[2] If it were included in the state column, it would show that Ohio’s overall “state” investment in public schools exceeds 75 percent out of a total that’s nearing $23 billion.

Table 1. State revenue as a percentage of state and local funding, Ohio traditional school districts

School funding narrative blog table 1
Notes: The 2022 to 2026 funding totals are for traditional districts only (excluding public charter schools, JVSDs, and private school scholarship funding) and were calculated based on Ohio Department of Education and Workforce data reported in the “Expenditure Rankings” files. The DeRolph era data (1992, 1995, 1999) are from the National Center for Education Statistics (it reports rounded numbers), and reflect public school funding before any substantial public charter and private school scholarship enrollment (the first charters opened in 1999 and the Cleveland Scholarship began in 1997). Historical revenue data are not inflation-adjusted, as the table focuses on the proportion of state to local funds, not funding levels.

How can there be such a significant difference between what Ohio provides its public schools and what advocates claim? The answer is cherry-picked data. To persuade policymakers and taxpayers that they need more money, public-school groups deceptively focus on a mechanism inside the school funding formula (the “state share percentage”), but it’s also one that disregards billions in state funding. The result is a false and misleading picture of Ohio’s contribution to its public schools.

* * *

In this Thanksgiving season, I am grateful for public schools. I am a graduate of the public school system. My mom was a public-school teacher and my son currently attends public school. I firmly believe that public schools do amazing things for many Ohio students. I root for their success and have advocated for smart and strategic uses of education funding.

My respect for public schools makes all this misinformation so frustrating. Omitting basic data, playing numbers games, and trashing their private-school counterparts may score political points. But in the long run, resorting to these kinds of tricks will further erode Ohioans’ trust in public education. It’s time to stop playing games and advocate for fair funding in an honest way.


[1] The document shows the “state share of base cost per student,” which is a fraction of the total amount districts receive from the state. Per the fine print of the “fact sheet,” the number will be revised, but has not as of the writing of this piece (2025–26 data have been available for about a month).

[2] Revenue generated from the 20-mill minimum property tax rate is officially booked and reported as “local revenue.”

Policy Priority:
School Funding
Topics:
School Finance
Jessica Poiner
11.16.2026
Three things for Acton administration blog image
Getty Images/aceshot
Listen to this article
Loading the Elevenlabs Text to Speech AudioNative Player...

On November 3, Ohioans selected former state health director Dr. Amy Acton to succeed the term-limited Mike DeWine as governor of the Buckeye State. In her victory speech, Dr. Acton emphasized that she intends to be a governor who will “fight for all of us” because “everyone deserves a chance to reach their full potential.”

There are plenty of issues that Governor-elect Acton could champion as she works to improve Ohio’s future. But education should be near the top of the list. Ensuring that every child has access to excellent schools goes hand in hand with helping everyone reach their full potential.

With the outsized importance of education in mind, here are three ways the governor-elect can help Ohio kids reach their full potential.

1. Push the pedal to the metal on early literacy.

Dr. Acton has already signaled her willingness to build on the science of reading initiative established by her predecessor. During her campaign, she promised to “continue to support and work to expand Governor DeWine’s literacy initiatives.”

One way to do so would be to maintain DeWine’s efforts to deploy regionally based instructional implementation teams. The Department of Education and Workforce (DEW) has already established these teams and identified six core objectives for their work, including strengthening instructional practice and ensuring reliable data collection. Although some schools (like those that have been federally identified) will definitely receive support from a team, the opportunity was made available to everyone—any K–5 school could request support prior to October 31. As of that deadline, teams had already completed more than 2,300 “learning walks” in 268 buildings across the state. In the interest of providing as much technical assistance to schools as possible, the Acton administration should allow teams to continue their work. Then, at the end of the school year, DEW officials should evaluate the initiative’s effectiveness, make any necessary tweaks, and go for round two.

Another way the governor-elect could build on the state’s early literacy efforts is by investing in better professional development for teachers. Ohio has made considerable progress in this area by providing general science of reading professional development to educators. Now it’s time to take the next step and provide curriculum-based professional learning (CBPL), or development that’s grounded in the specific curriculum and instructional materials that teachers use daily in their classrooms. The Acton administration could incentivize districts to offer this training by identifying the top five curriculum options on Ohio’s approved list and vetting providers who specialize in offering CBPL for those specific options. Districts that choose to work with an identified provider could then have the cost covered by the state.

2. Follow through on supporting low and high achievers.

Helping every kid reach their potential means paying close attention to those who are sometimes overlooked. One way to identify these students is to consider results from Ohio’s state exams, which are organized into five performance levels: limited, basic, proficient, accomplished, and advanced. Students who score at the lowest level (limited) need intensive support to catch up to their peers, while those who score in the top two levels (accomplished and advanced) are surpassing grade-level standards and ready for more challenging work.

The good news for the governor-elect is that Ohio policymakers already passed legislation—Senate Bill 19—to bolster support for students on both ends of the spectrum. To assist struggling students, the bill requires districts to provide evidence-based academic intervention services, free of cost, to every student who scores limited on a state test in math, ELA, or both. For high achievers, the bill requires districts to provide advanced math opportunities to those who score accomplished or advanced on state math exams.

To fulfill her promise of supporting every child, it will be crucial for Governor Acton’s DEW to ensure rigorous implementation of SB 19. There are two goals, in particular, they should focus on.

First, state officials should faithfully execute the provision that requires DEW to randomly identify 5 percent of public schools and review the academic intervention services they provide to students. SB 19 requires these reviews to be posted on each school’s website and included in student opportunity profiles on state report cards. By following the letter of the law, the Acton administration can prove to Ohioans that it’s actively working to ensure that academically struggling students are getting help.

Second, state officials should closely track students who are eligible for advanced math under SB 19. Historical testing data indicate that high-ability students who take Algebra I in eighth grade almost universally perform well on the state’s end-of-course exam. But before SB 19, more than half of these students (55 percent) weren’t enrolled in algebra during eighth grade. Those who were most likely to be left out were students of color and those from low-income backgrounds. Keeping a close eye on the data—and ensuring schools provide opportunities to all eligible students—will go a long way toward helping every kid reach their potential.

3. Invest in the battle against chronic absenteeism.

In the wake of the pandemic, Ohio has been struggling mightily to lower sky-high chronic absenteeism[1] rates. During the 2025–26 school year, almost a fourth of Ohio students were chronically absent. In some districts, absenteeism rates topped 50 percent.

Just like with SB 19, the Acton administration will inherit a new absenteeism policy that it will be responsible for implementing. (In 2025, policymakers revamped state law and required districts to update their absence policies accordingly.) And just like with early literacy, there are some efforts already underway that the governor-elect could choose to maintain or discontinue. (Earlier this year, DEW launched a new statewide attendance dashboard that helps local leaders and the public track attendance trends and chronic absenteeism rates.) But if Dr. Acton wants to put her own stamp on the fight against chronic absenteeism, there are two innovative ideas she should consider.

  • Establish a home-visit initiative. In the spring of 2021, state leaders in Connecticut launched a home-visit initiative that provided funding to 15 high-need districts to pay for school staff and community organizers to visit thousands of chronically absent students in their homes. A mixed-methods evaluation indicates that the program had a meaningful impact. The Acton administration could oversee a similar effort in Ohio by establishing a pilot project to distribute funds to a small number of districts that volunteer to implement a home-visit initiative.

  • Provide attendance coaches. Connecting and communicating with chronically absent students and their families can be time-intensive. To ease the burden on schools, the governor-elect could invite interested districts to apply for a state-funded attendance coach. These coaches could collaborate with administrators to evaluate prevention and intervention efforts, identify ways to improve, and train staff on effective implementation. They could support teachers by managing communication with families. And they could support students by building relationships with those who are frequently absent and working to dismantle attendance barriers.

***

Dr. Acton deserves kudos for her promise to help every Ohio student reach their potential. To keep her promise, the governor-elect must be willing to prioritize faithful implementation of established policies, experiment with innovative ideas, and help ensure that schools serve every kid well.


[1] Chronic absenteeism is defined as missing at least 10 percent of instructional time for any reason.

Policy Priority:
School Funding
Topics:
Governance
Aaron Churchill
11.13.2026
Charter funding gap blog image
Getty Images/Yutthana Gaetgeaw
Listen to this article
Loading the Elevenlabs Text to Speech AudioNative Player...

With elections over and the next state budget process around the corner, school funding will soon be top of mind for Ohio lawmakers. On the campaign trail, Governor-elect Acton has promised more funding for public schools, but the level of increase and how dollars are allocated to schools will certainly be subject to negotiation. Statehouse discussions are apt to center around the funding formula and the amounts provided to traditional districts.

Yet districts are not the only public schools educating Ohio students. In 2025–26, roughly 86,000 Ohio students attended 323 brick-and-mortar public charter schools—independently run, tuition-free, and publicly accountable alternatives to traditional districts.[1] Approximately three in four of these charter students attended schools in the Ohio Eight cities: Akron, Canton, Cincinnati, Cleveland, Columbus, Dayton, Toledo, and Youngstown. Funding the education of these students—most of whom are low-income—also merits serious consideration in the coming debates.

Regrettably, Ohio has long treated charter students as second-class citizens. Studies conducted between 2005 and 2019 found that urban brick-and-mortar charter students received approximately 30 to 40 percent less in education funding than their local district counterparts. These inequities were deeply unfair to charter students and their families who paid a penalty because of their educational choices. They also had real-world consequences for charter schools, such as impeding their ability to pay competitive teacher salaries and discouraging plans for expansion.

The funding gap was rooted in policy structures disadvantaging charters. Despite being public schools serving the community, charters have never had access to local taxpayer funds (with only a limited exception in Cleveland). Meanwhile, the state has struggled to fully offset the absence of these local dollars and bring charters to parity with local districts. In a 2019 report, we at Fordham called on Ohio lawmakers to equalize charter funding by “either ponying up more money from the state budget or requiring local school boards to share locally generated revenue.”

Since then, Ohio has taken commendable steps to narrow the charter funding gap via enhanced state funding. Starting in FY20, high-performing charters have received additional aid through the Quality Community School Support Fund (QCSSF). Research by Ohio State University professor Stéphane Lavertu has demonstrated the importance of these funds, as charters used them to boost teacher pay and stabilize their workforce. The program has also generated a strong return on investment, with the dollars yielding achievement gains for students attending qualifying charters.  

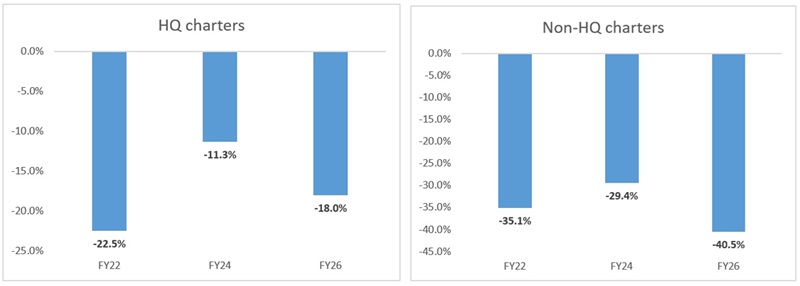
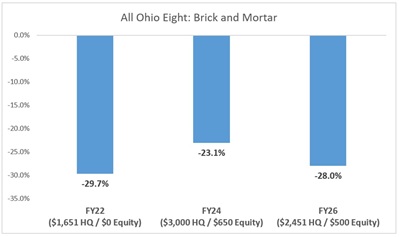
The high-quality program also put a dent in the funding gap. In my analyses of the Ohio Eight schools, the average disparity narrowed to just 11 percent in FY24 for high-performing charters. This notable gap reduction coincided with an enhanced QCSSF award ($3,000 per economically disadvantaged pupil instead of $1,750).[2] It was also the first year in which both high-quality charters and nonqualifying schools received additional state aid through an equity supplement of $650 per pupil. As Figure 2 indicates, these initiatives narrowed the overall charter funding gap to 23 percent by FY24. 

Figure 1. Ohio Eight average charter school funding gap, by high-quality (HQ) status

Charter funding gap blog figure 1

Figure 2. Overall Ohio Eight average charter school funding gap

Charter funding gap blog figure 2
Source: Analysis of Ohio Department of Education and Workforce financial data (FY22 and FY24 data were presented in an earlier piece). Notes: The analysis compares Ohio Eight charter schools’ funding to the districts in which they are located. It relies on the department’s equivalent pupil methodology—a weighted enrollment that allows for more apples-to-apples funding comparisons. State and local revenues of districts and charter schools are included, but federal and non-tax revenues are excluded. Transportation expenditures are subtracted from both sectors’ funding data, as districts are generally responsible for busing charter students. Charters’ state per-pupil facility aid is excluded, as is districts’ capital funding. The amounts under the fiscal years refer to the QCSSF per-economically disadvantaged pupil amounts (after proration, which applied in FY22 and FY26) and the per-pupil equity supplement.

As evident in the figures above, the momentum stalled out between FY24 and FY26, something we predicted with chagrin after lawmakers passed the state budget in 2025. In fact, the gap has noticeably widened, with charter schools qualifying for QCSSF dollars receiving 18 percent less than districts and non-qualifying schools funded at a startling 40 percent less. The overall charter funding disparity in the Ohio Eight rose to 28 percent, just shy of the FY22 gap. What happened?

Two factors help explain this troubling reversal.

  • In FY26, charters received significantly diminished per-pupil funding through QCSSF and the equity supplement—the two funding streams that do the heavy lifting in closing the gap. Reduced QCSSF amounts ($2,451 per economically disadvantaged pupil in FY26 compared to $3,000 in FY24) are due to the “prorations” required to avoid exceeding the program appropriation. Had charters received the maximum award, qualifying schools would have experienced a 13 percent shortfall, instead of 18 percent. The equity supplement also declined from $650 to $500 per pupil in FY26; it will fall again to $400 per pupil in FY27.    

  • Traditional districts in the Ohio Eight—the comparison group in these analyses—have enjoyed strong local tax revenue growth driven by rising property values. In FY24, the Ohio Eight districts collected $1.61 billion in local revenue and $1.80 billion two years later—a 10.2 percent increase in nominal terms. None of these gains were shared with public charter schools, thus further widening the funding disparities between districts and charters.

Governor-elect Acton and the 137th General Assembly will need to devise a fiscally responsible budget that positions Ohioans for success and treats citizens fairly. Among Ohio’s youngest citizens, 86,000 attend public charter schools, and those students merit a high-quality education—and the resources that enable their schools to deliver it. With the funding gap widening, policymakers must redouble their efforts to provide fair and equitable funding by increasing the state’s investment in the high-quality charter fund and the charter equity supplement.


[1] Another 36,000 students attend public online charter schools, which are funded slightly differently than site-based charters.

[2] $1,750 was the maximum award but due to an appropriations cap, the actual amount qualifying charters received between FY20 and FY23 was less (e.g., $1,416 per economically disadvantaged pupil in FY23). Qualifying schools received $1,000 per non-disadvantaged pupil between FY20 and FY23 and $2,250 starting in FY24 (these amounts are also subject to reductions).

Policy Priority:
School Funding
Topics:
School Finance
Jeff Murray
11.13.2026
Ohio charter news logo
Listen to this article
Loading the Elevenlabs Text to Speech AudioNative Player...

Stories featured in Ohio Charter News Weekly may require a paid subscription to read in full.

On the grow

Spectrum News this week reported that over 36,000 students are enrolled in online charter schools in Ohio this year, the third straight year that student numbers have grown and representing a 13 percent increase in enrollment since “the end of the pandemic”. A spokesperson at Ohio Connections Academy extols the virtues of flexibility and individualized education that can be strong incentives for families. The coverage is not all rosy, unfortunately, because they cite data showing that the average student loses academic ground when they attend an online school, compared to their previous school. With enrollment likely to continue rising, Ohio’s online charter school leaders will need to continue their efforts to boost student achievement.

Whack-a-mole

Wilberforce Academy, a Christian nonprofit organization, is looking to open a K-8 charter school in Cedar Bluff. However, their application was denied by the Knox County Board of Education because of a state law that bars “sectarian” and “religious” schools from participating. The case has been percolating through the court system, and this week, a district court judge ruled that Tennessee cannot require charter schools to operate as “nonreligious” in order to participate in what is termed a public benefit program. More legal wrangling will likely follow.

New research on competitive effects

A new report was released last week, looking at an array of effects of charter school operation on traditional district schools around them. The impressive amount of data comes from nearly every district in the United States where one or more charter schools opened at any time between 1991 and 2026 and analyzes a host of impacts from student achievement to school closure. This EdWeek piece gives a nice summary of the findings, including the benefits of charters to previously-low-performing students and the fact that charter funding levels impact how well they serve students. The full version of the report, including a policy brief, can be found here.

Protesting

Parents, students, and teachers rallied at several school buildings across Los Angeles this week, protesting a plan from the LA Unified School District to cut $10 million from grant funding traditionally given to charters affiliated with the district. District leaders say this is just one of many belt tightening measures to combat a projected $3.6 billion budget deficit. Charter school supporters say that the cuts will compromise school safety, trigger layoffs at their schools, and end up hurting low-income families the most. It is unclear at this point what else can be done to save the grant funding.

New support for charters in New York

The midterm election may be over, but politics continues unabated. Case in point: Great Public Schools New York was launched earlier this week. The super PAC is led by Kevin Elkins, a former political director for the NYC carpenters union and for former mayoral candidate Andrew Cuomo, and its aim will be to support charter schools across the state. Two of its most pressing goals: Get the state cap on charter schools lifted and achieve funding parity between charters and traditional district schools.

You’re invited – upcoming virtual event

What can Ohio’s charter school turnaround teach us about improving school quality in other states? That’s the topic of an upcoming virtual event hosted by the National Association of Charter School Authorizers (NACSA). The featured speaker is Aaron Churchill, Ohio Research Director at the Thomas B. Fordham Institute, who will explore findings from Fordham’s new research report examining the role of accountability and funding in the state’s charter sector and consider the implications for authorizers across the country. The event will be held Thursday, November 19, starting at 12:00 pm Central Time (1:00 pm Eastern Time). You can find more information and the registration link here.

*****

Did you know you can have every edition of the Ohio Charter News Weekly sent directly to your Inbox? Subscribe by clicking here.

Policy Priority:
School Choice
Topics:
Charter Schools
Patricia Levesque
11.13.2026
Bricks and mortar
Getty Images/Ruslan Sidorov
Listen to this article
Loading the Elevenlabs Text to Speech AudioNative Player...

Dear newly elected and returning state policymakers,

Congratulations on your victory.

When you walk into a building, you don’t worry that the floor will collapse or the walls will catch fire. We take that safety for granted.

A century ago, we couldn’t. Cities burned and buildings fell. We didn’t fix it by asking landlords to keep a few extra buckets of water on hand. We rewrote building codes, required brick and steel over wood, and engineered fire escapes. We treated it as a design flaw, and we solved it.

Now imagine four in 10 buildings failing inspection. We would halt construction until that number hit zero. Yet that’s about where we are in reading: Roughly 40 percent of fourth graders score below the basic level on the National Assessment of Educational Progress (NAEP), widely considered the “gold standard.” In K–12 education, we’ve gotten comfortable celebrating small gains while most kids are far from where they need to be—and have the potential to reach.

You have a chance to change that. Education wasn’t the headline of this year’s campaign, but the connection is simple: A strong economy needs a strong workforce, and that starts in kindergarten classrooms.

Here are five priorities that deserve your attention.

Face the numbers

The kids are not OK, and far too many people seem fine with that.

In the most recent national assessments, fourth grade reading scores fell by five points compared to 2019, leaving roughly 40 percent of these young learners performing below the NAEP Basic level. Eighth grade scores followed a similar downward trajectory, showing no meaningful post-pandemic recovery on a national scale.

Some states are doing better than others catching students up, but most are still woefully behind. Meanwhile, graduates are showing up at college and work without the basic skills they need. States need to be actively working to close these gaps in meaningful ways, especially as emerging technology continues to change what the jobs of tomorrow look like.

Build what we know works

The good news is that we know how to improve outcomes, and the solutions aren’t partisan. Pass strong “science of reading” laws. Expand early literacy intervention. Implement foundational math strategies in the early grades.

Mississippi showed that what gets measured gets done. More than a decade ago, policymakers there passed a strong school accountability system and comprehensive literacy reforms that fundamentally improved student outcomes by training teachers in the science of reading, implementing early intervention screenings, and implementing a third grade promotion policy. These reforms collectively propelled the state’s fourth grade reading scores from 49th in the nation to historic highs.

Pair these approaches with a way to see how each student is doing. If children fall behind, they should get help right away, not years later. If children are racing ahead, they should move into more advanced coursework. And as students move through school, states should support what comes next—whether that’s a job, college, or the military.

Inspect honestly and often

You can’t fix what you don’t measure. Statewide assessments and clear school grades tell you where to send resources and which schools need help.

Accurate measurement helps close the “honesty gap.” Many states report that most students are proficient while national tests say otherwise, and parents end up thinking their child is on grade level when they aren’t.

Good data also lets you modernize the high school experience and beyond. Tracking postsecondary outcomes and student progress over time lets you update graduation requirements, develop stronger college and career pathways, and connect high school to in-demand careers.

Transparency takes some courage, because the numbers won’t always be flattering. But families and taxpayers deserve to see what’s working and what isn’t.

Give families options

No single learning environment works for every child, even within the same household. 

Families need—and want—access to a variety of high-quality educational options beyond their assigned neighborhood school—including public charter schools, magnet programs, private schools, career and technical pathways, microschools, and specialized learning models.

Empowering parents with those types of meaningful choices ensures that education can be tailored to each child’s unique strengths, needs, and learning style. When states support diverse learning opportunities, they create a more responsive system that helps every student reach their full potential.

Stay with it

It might not feel like it in the moment, but passing a bill is the easy part. Once that law is in place, the pressure to water it down can begin. Real gains come from the implementation that follows: high-quality instructional materials, teacher training, program support, and ongoing funding matter. Without these sustained commitments, policy wins often stay on paper and never reach the classroom.

There will be hard conversations ahead. Enrollment is declining, budgets are tight, and many families need options beyond their assigned schools. Working through these challenges will take time and bipartisanship, and the states that stick with it will pull ahead of those that stall or adopt reforms they never carry out.

Bottom line: Every child can succeed

We should expect the same structural integrity from our schools that we expect from the buildings we walk into every day. You can make that happen, and the sooner you start, the sooner more kids benefit.

ExcelinEd is ready to help with model policies, research, expert feedback, and more. Congratulations again, and we look forward to working with you.

Sincerely,
Patricia Levesque
CEO, ExcelinEd

Editor’s note: This was first published by ExcelinEd.

Policy Priority:
High Expectations
Topics:
Governance
Teachers & School Leaders
Jeff Murray
11.13.2026
Gadfly Bites logo
Listen to this article
Loading the Elevenlabs Text to Speech AudioNative Player...

News stories featured in Gadfly Bites may require a paid subscription to read in full. You have been warned.

  1. Last week, I incorrectly celebrated what I believed was the U.S. Department of Education’s approval of Ohio’s amendment request, designed to change certain facets of the state’s ESSA plan. I should have known it wasn’t the right approval at that time because the haters who have been hating on numerous aspects of that ESSA request for months now weren’t decrying it last week. But judging by the vitriolic reaction in this coverage from yesterday, now it’s time for me to celebrate the proper amendment having been approved. Yay. (Cleveland.com, 11/12/26)

  2. Vandalia-Butler City Schools is facing a budget hole on the horizon and is working with the state to try and avoid falling into it. A new plan announced this week would close one elementary school building and reconfigure grade levels among existing buildings. And for folks who insist that such closures don’t save much money due to unspecified “fixed costs” and the like, the number crunchers at Vandalia would like a word. “Under the reconfiguration option, $1.25 million would be cut from K-12 certified staff, targeting savings through nine to 10 retirements… The reconfiguration proposal also lists savings of $500,000 in purchased services; $315,000 in administrative and support reductions; $265,000 in classified staff reductions; $100,000 in building operations; and $70,000 in athletic transportation. The transportation savings would involve limiting return trips, according to the presentation.” Even better: The district’s high school is currently operating at about 50 percent capacity (700 kids in a building built for 1,400) and moving seventh and eighth graders into that building would allow for more efficient use of remaining space. Voila! The only thing that would make this better would be for the district to sell the closed building to a charter or private school immediately and actually snag millions in new revenue. But let’s actually get through the closure part first. Sounds like it might be a tough sell. (Dayton Daily News, 11/9/26)

  3. Finally this week, here’s a look at the Genesis School, a brand-new, non-sectarian, PreK-8 private school in Cleveland. They are trying to make their model—and the budget numbers—work without charging families anything for tuition. Also sounds like a tough sell to me. (Spectrum News 1, Ohio, 11/12/26)

Did you know you can have every edition of Gadfly Bites sent directly to your Inbox? Subscribe by clicking here.

Policy Priority:
School Funding
Topics:
Governance
Alicia Anderson
11.12.2026
Texas Capitol Building
Getty Images/SeanXu
Listen to this article
Loading the Elevenlabs Text to Speech AudioNative Player...

Last week, Texas Democrats achieved what seemed impossible not long ago. Senator-elect James Talarico and Governor-elect Gina Hinojosa, along with their colleagues down ticket, have an opportunity to renew the Lone Star State’s long legacy of education leadership.

Talarico, a politically savvy former middle school teacher, charted a careful course on education, offering takes that many on the center-left and center-right can support. Hinojosa, a former Austin ISD school board member, focused her campaign’s education policy talking points more on what she was against than what she’s for, capitalizing on constituent anger over vouchers and state takeovers.

Now it’s time to lead, and both can look to fellow Texans for a policy roadmap toward better opportunities for their state’s children. If they get it right, they could also lead the way for the nation.

Almost 100 years before Talarico and Hinojosa’s unlikely victories, Lyndon Johnson was a 20-year-old student at Southwest Texas State Teachers College, working his way through an undergraduate degree that his family couldn’t afford. He left for a year to teach at the under-resourced, segregated Welhausen School in Cotulla, between San Antonio and Laredo. He later recalled spending his first month’s salary to purchase playground equipment for his fifth-, sixth-, and seventh-grade students during a time when roughly half of all Mexican American children in Texas weren’t enrolled in school at all.

Johnson returned to finish his degree and soon moved on to a career in politics, but his experience in Cotulla stayed with him as he climbed through the ranks of Congress and into the White House. As president, Johnson pushed through the most consequential federal K–12 legislation in American history. In 1965, former students from Cotulla came to watch him sign the Elementary and Secondary Education Act, which he believed would “bridge the gap between helplessness and hope for more than 5 million educationally deprived children,” largely through its Title I, designed to aid schools serving many low-income students.

The next year, President Johnson gave a speech at the Welhausen School: 

No longer can we afford to say to one group of children: Your goal should be to climb as high as you can. And then say to another group: Your goal should be to get out as soon as you can.

Talarico’s path to D.C. also led through the classroom, where he taught low-income, mostly Latino sixth graders in San Antonio during his stint with Teach For America. His commitment to high expectations for all students seems apparent from the start. A New York Times profile describes a former student “being scolded by Mr. Talarico, who warned him not to slack off just because the material was easier for him than his classmates.”

Talarico brings fresh energy to an aging Senate—as the chamber’s youngest member, he’s part of an incoming class that averages almost 15 years younger than senators who will leave their posts in January. With Democrats back in the majority, Bernie Sanders (age 85) is likely to return as chair of the powerful Health, Education, Labor, and Pensions (HELP) Committee, and is already signaling a focus on healthcare. Talarico (age 37) is a natural fit for that committee and should be given support to make education a signature issue, one that matters for swing voters. (Yes, it matters. Just ask Glenn Youngkin, who appears to be testing his 2021 Virginia strategy right on time for the GOP’s 2028 shadow primary.)

ESEA is overdue for reauthorization, last dealt with by Congress near the end of Obama’s presidency. This may not happen while Trump remains at 1600 Pennsylvania Avenue, but Talarico can use the next few years to lay the groundwork for the law’s next phase, especially if his Democratic colleagues accept that representing Texas long term requires finding common ground with center-right Republicans at least as often as siding with his own party’s left flank. He can start by talking up the Texas Teacher Incentive Allotment, which shows how the idea behind ESEA’s teacher and school leader incentive program can work at scale.

Hinojosa’s roadmap for education leadership looks very different—and should start with a positive agenda rather than her campaign’s DOGE-like talking points that throw out years of good policy. She, too, can lean on the experiences of her predecessors.

Back in 1993, Democratic Governor Ann Richards—a former social studies teacher—signed Texas SB 7, which shifted property-tax money from wealthy to poor districts around the state. The money came alongside a new statewide system to rate schools and districts on test scores, attendance, and dropout rates. George W. Bush unseated Richards in 1994, campaigning against what he characterized as inflated ratings, and as governor he worked with lawmakers in both parties to strengthen the state’s accountability system. Once in the White House, Bush tied LBJ’s Title I dollars to transparent, results-driven accountability nationwide under No Child Left Behind, the 2002 reauthorization of ESEA.

Johnson, Richards, and Bush understood that high expectations matter for all children, and that leaders must give local schools the capacity to improve and, at times, the pressure to do so.

In her campaign, Hinojosa captured the deep frustration that many Texans feel as the state directs funds toward private schools with minimal regulation while subjecting a growing number of public school districts to heavy-handed oversight. Yet while the voucher program isn’t cheap, it receives outsized attention compared to its share of overall state spending on schools. Its poor optics stem from both policy choices and politicking.

The Education Freedom Accounts offer near-universal income eligibility and welcomed many Christian schools while admitting Islamic schools only after a federal judge intervened. The program also walks away from the principle at the heart of both today’s Title I and the Richards-era law: public funding comes with public accountability for results. Voucher recipients take an annual test, but schools have broad leeway to select which one; they are not rated and face no consequences if students fall behind.

Even constituents who don’t mind the program’s design may be uneasy with the large donations from pro-voucher, out-of-state billionaires that helped unseat House Republicans who opposed Governor Abbott’s voucher plan in the 2024 primaries. This time, voters seemed less willing to be swayed by deep-pocketed donors. Abbott delivered on vouchers, but the incoming administration will test the program’s durability. 

As governor, Hinojosa must separate frustration over the state’s voucher program from efforts to hold public school leaders accountable for their students’ outcomes. Anger in takeover districts runs deep, perhaps because the laser focus on results came at the expense of building public trust. Whatever the cause, that anger isn’t an excuse to lower expectations for students and educators. Rather than abandoning efforts underway to ensure all children have access to a school that meets their needs, state leaders can make family and educator engagement a priority so that all stakeholders understand why the state is stepping in and how communities can return to local control. State takeovers should be rare and time-limited but can’t be off the table in places where intervention could create better opportunities for children.

Hinojosa should begin by ensuring that all public dollars are tied to accountability measures, regardless of a school’s location or student population. That means transparent public reporting requirements for voucher recipients and consequences for poor student outcomes regardless of school type. It also means backing off attacks on testing that allows parents, teachers, and policymakers to understand what kids know, and where they need to grow.

Texas leaders have long understood the power of education to improve children’s lives. Like Johnson before him, Talarico appears poised to champion better schools around the country if party leaders give him a seat at the table. And if Hinojosa can find a balance between community responsiveness and high expectations for the state’s struggling schools, she too can lead on education.

Policy Priority:
High Expectations
Topics:
Accountability & Testing
Evidence-Based Learning
Curriculum & Instruction
Governance
Private School Choice
Teachers & School Leaders

Pagination

  • Current page 1
  • Page 2
  • Page 3
  • Page 4
  • Page 5
  • Page 6
  • Page 7
  • Page 8
  • Page 9
  • Next page Next ›
  • Last page Last »
Fordham Logo

© 2026 The Thomas B. Fordham Institute
Privacy Policy
Usage Agreement

National

P.O. Box 110
Burke, VA 22009

202.223.5452

[email protected]

Ohio

P.O. Box 82291
Columbus, OH 43202

614.223.1580

[email protected]

Sponsorship

130 West Second Street, Suite 410
Dayton, Ohio 45402

937.227.3368

[email protected]