Mobile Navigation

  • National
    • Policy
      • High Expectations
      • Quality Choices
      • Personalized Pathways
    • Research
    • Commentary
      • Gadfly Newsletter
      • Flypaper Blog
    • Events
    • Scholars Program
  • Ohio
    • Policy
      • Priorities
      • Media & Testimony
    • Research
    • Commentary
      • Ohio Education Gadfly Biweekly
      • Ohio Gadfly Daily
  • Charter Authorizing
    • Application
    • Sponsored Schools
    • Resources
  • About
    • Mission
    • Board
    • Staff
    • Career
Home
Home
Advancing Educational Excellence

Main Navigation

  • National
  • Ohio
  • Charter Authorizing
  • About

National Menu

  • Topics
    • Accountability & Testing
    • Advanced Education
    • Career & Technical Education
    • Charter Schools
    • Curriculum & Instruction
    • ESSA
    • Evidence-Based Learning
    • Facilities
    • Governance
    • Personalized Learning
    • Private School Choice
    • School Finance
    • Standards
    • Teachers & School Leaders
    • Think Again
  • Research
  • Commentary
    • Gadfly Newsletter
    • Flypaper Blog
    • Gadfly Podcast
  • Events
  • Scholars Program

The Education Gadfly Weekly

Sign Up to Receive Fordham Updates

We'll send you quality research, commentary, analysis, and news on the education issues you care about.
Thank you for signing up!
Please check your email to confirm the subscription.

The Education Gadfly Weekly: Student outcomes have improved in more than just reading and math

Volume 19, Number 25
6.19.2019
6.19.2019

The Education Gadfly Weekly: Student outcomes have improved in more than just reading and math

Volume 19, Number 25
view

Student outcomes have improved in more than just reading and math

There’s little doubt that math and reading outcomes strengthened dramatically for the lowest-performing students and for children of color from the mid-1990s until the onset of the Great Recession. But could these gains be seen in writing, science, and other areas, too? To answer that, this post looks at results from the National Assessment of Educational Progress. It finds, among other things, that at least at the fourth and eighth grade levels, progress in student achievement went well beyond reading and math.

Michael J. Petrilli 6.19.2019
NationalFlypaper

Student outcomes have improved in more than just reading and math

Michael J. Petrilli
6.19.2019
Flypaper

The power of positive deviance

Robert Pondiscio
6.19.2019
Flypaper

Understanding race-match effects

6.19.2019
Flypaper

The relationship between TFA, student achievement, and teacher qualifications

Jessica Poiner
6.18.2019
Flypaper

How school quality differs within districts

Kara Long
6.19.2019
Flypaper

The Education Gadfly Show: Getting wonky on the Democratic candidates’ education ideas

6.19.2019
Podcast
view

The power of positive deviance

Robert Pondiscio 6.19.2019
Flypaper
view

Understanding race-match effects

Constance Lindsay 6.19.2019
Flypaper
view

The relationship between TFA, student achievement, and teacher qualifications

Jessica Poiner 6.18.2019
Flypaper
view

How school quality differs within districts

Kara Long 6.19.2019
Flypaper
view

The Education Gadfly Show: Getting wonky on the Democratic candidates’ education ideas

Michael J. Petrilli, David Griffith, Ph.D., Amber M. Northern, Ph.D., Conor Williams 6.19.2019
Podcast
view

Student outcomes have improved in more than just reading and math

Michael J. Petrilli
6.19.2019
Flypaper

As I indicated last week, I plan to spend the summer writing about whether our schools have improved over the past quarter-century or so—essentially the “reform era.”

There’s little doubt, I argued, that outcomes improved dramatically for the lowest-performing students and for children of color from the mid-1990s until the onset of the Great Recession, at least in the key subjects of reading and math. That was especially the case in elementary and middle schools, though high school graduation and college-completion rates were up sharply as well, even if some of that progress might be due to slipping standards.

A fair question, though, is whether this progress was limited to these two basic subjects, especially since they were the focus of state and federal accountability systems over this period. So let’s take a look at results from the National Assessment of Educational Progress for most of the other academic subjects, too. As has been my practice in the past, we’ll examine trends over time for the national sample, broken down by the major racial groups, as well as by percentiles. This will give us much better information than looking at averages alone.

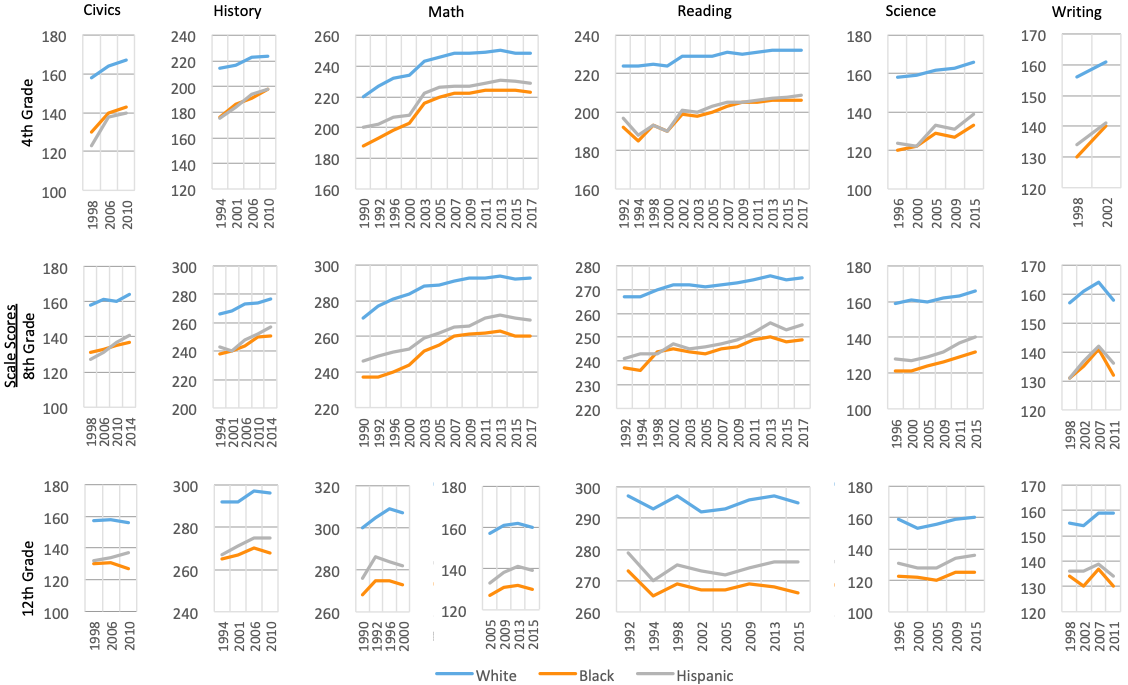
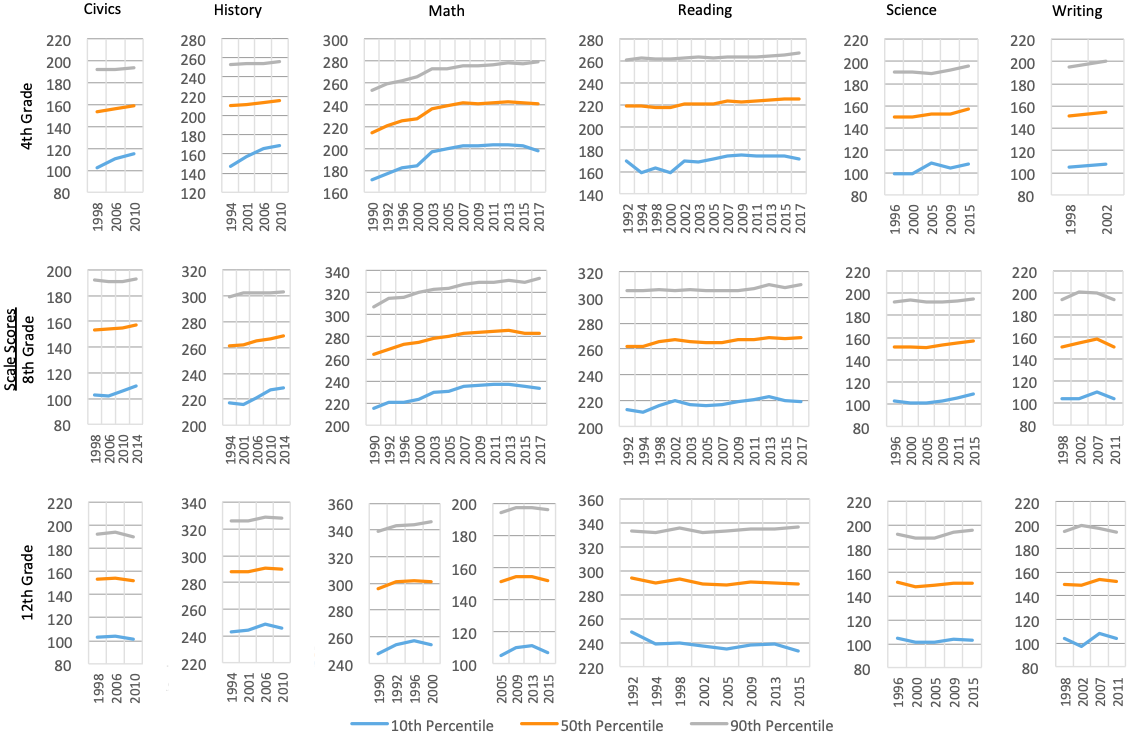
You can peruse the NAEP charts* below and come to your own conclusions, but here’s what I see:

  • Compared to the other subjects, the progress in math started earlier and was more widespread. In most subjects, we didn’t see gains until the late 1990s into the early 2000s. But math improvement started as soon as the “main NAEP” commenced in 1990, and continued all the way until 2013. And it didn’t just focus on the lowest-performing students, but was apparent in the middle and at the top of the performance spectrum, too. Perhaps most notably, even twelfth graders demonstrated progress in math—something we don’t see for most other subjects.
  • After calamitous years in the mid-1990s, the reading achievement of our lowest-performing students and students of color boomed in the late 1990s into the early 2000s. This happened first for fourth graders and then for eighth graders. White students and students in the middle and at the top of the performance spectrum made some gains, too, but they were more modest. Most of the positive trends flipped around 2013. And over the whole period, the twelfth grade trends are flat or down slightly.
  • The writing trends for fourth and eighth graders look similar to those for reading. We see big jumps in achievement for fourth grade students of color between 1998 and 2002—which unfortunately were the only years the NAEP gave that test. Eighth grade black and Hispanic students also demonstrated solid growth through 2007. And twelfth grade? Flat or down from 1998 through 2011.
  • The trends for science look like a blend of those for reading and math. Like math, the progress for fourth and eighth graders was widespread—across all racial groups and percentile levels. But they were relatively modest, except for the lowest performers—akin to reading. And (repeat after me): For twelfth grade, the trends were mostly flat or down slightly.
    • The U.S. history trends look much like those for reading. There was solid progress for fourth and eighth graders, especially for kids of color and those at the low end and the middle of the performance spectrum. And there’s finally some good news on the twelfth grade front: Achievement was up ever so slightly from 1994 to 2010 across the three major racial groups.
    • The trends for civics mirror those for reading and writing. The also resemble those in U.S. history, except civics achievement is flat or down slightly at the twelfth-grade level. But there were solid gains in fourth and eighth grades, especially for low-performing kids and students of color.

    This is dense stuff. What does it all mean?

    First, at the fourth and eighth grade levels, progress in student achievement went well beyond reading and math, especially for low-performing students and students of color, at least until 2007 or so. For example, the writing achievement of Hispanic eighth graders rose by 11 points between 1998 and 2007. The science achievement of black fourth graders rose 13 points from 1996 to 2015. Black eighth graders boosted their U.S. history achievement by 13 points from 1994 to 2014. Hispanic fourth graders gained 17 points on the civics test from 1998 to 2010. This progress is not as dramatic as what we see for reading and especially math, but it’s not nothing, signifying gains of about a grade level or so in each case.

    Second, there’s no escaping the conclusion that there’s been little to no improvement at the twelfth grade level. This disappointment is something of a mystery, one I’ll return to later this summer. But needless to say, it’s not good.

    Third, it’s hard to imagine that these various trends aren’t linked. It would stand to reason that as reading skills improve, students’ ability to understand other subjects like history and civics will improve as well. (It could also be, as E.D. Hirsch, Jr., has long argued, that students’ reading skills improve as they gain content knowledge.) Of course, it’s possible that our schools got better at teaching these other subjects, as well—a counterintuitive finding, if true, given all the talk about No Child Left Behind et al. “narrowing the curriculum.”

    —

    Fourth and eighth graders made progress across the entirety of the academic curriculum from the late 1990s until the Great Recession—especially our lowest performing students and students of color. Next week we’ll start to examine whether schools—and school reform—deserve credit for this encouraging progress, as well as the disappointing results over the last decade.

    Figure 1. NAEP average scale scores by race/ethnicity, subject, and year

    mp11

    Figure 2. NAEP average scale scores by percentile, subject, and year

    mp222

    *Note that changes in testing frameworks occurred in several subjects. The framework for science changed in 2009, and the framework for writing changed in 2011. Direct comparisons between results from before and after these framework changes cannot be made. The framework for math changed in 2005. Changes in the math framework for grades four and eight were minimal, so a continuous comparison can be made over time. Changes in the twelfth grade math framework were more extensive and included changes to scoring, so comparison of results from before and after the 2005 framework change cannot be made.

    Special thanks to Kara Long, Fordham Institute research intern, for her assistance with the data.

    view

    The power of positive deviance

    Robert Pondiscio
    6.19.2019
    Flypaper

    I’m a fan and faithful listener of EconTalk, a podcast hosted by Russ Roberts of Stanford University's Hoover Institution. A few weeks ago, I was stopped in my tracks by his interview with Mauricio “Lim” Miller, an Oakland, California-based social services pioneer and MacArthur “Genius” fellowship recipient, an honor he earned as the founder of the non-profit Family Independence Initiative (FII). I haven’t stopped thinking about it since.

    Others may be familiar with Lim Miller’s backstory and career; I was not. The son of a Mexican immigrant mother who worked multiple jobs to get her son into and through UC Berkeley where he studied to be an engineer, Miller ended up working in social services, ultimately running an organization called Asian Neighborhood Design, which focused on tenant rights, job training, and youth development, including a program in the Bay area that trained gang members to work in construction. His work was successful enough to draw the attention of then-President Bill Clinton, who invited Miller to the State of the Union address twenty years ago.

    But even as he sat in the Capitol with the First Lady, Rosa Parks, and other VIP guests, Miller was harboring secret doubts. “It was increasingly clear to me that my work wasn’t fundamentally changing things for the families I had been trying to help,” he writes in his 2017 book, The Alternative (which I ordered online even before the podcast had ended), “I also knew that my mother would never have utilized the services I offered.”

    That’s quite an admission. But the social services sector’s primary accomplishment is to “make living in poverty tolerable,” argues Miller, a phrase he attributes to Oakland Mayor Jerry Brown, who challenged him at about the same time he was having his dark night of the soul, to come up with an alternative approach to make poverty escapable. If you could do anything you wanted, if money and restrictions were not an issue, Brown wanted to know, what would you do? Miller’s initial answer was inchoate. “Well, I don’t know what I would do. But my mother figured out how to get me out of poverty,” he told the Mayor. “I think every mother, father, or guardian will know the best way to get their families’ lives together.” Instead of paying staff and social workers, he suggested, let’s pay families to show us what they would do.

    That impulse guided the formation of FII, which Miller says has proved that families like his “are not in this country for charity or to be criminals. People are not happy on welfare and don’t want to live in tolerable poverty.” FII also proves that when friends work together to improve their lives “their example becomes contagious” leading to faster and more effective social change than any program or policy can match. His approach rewards hard work and resourcefulness, and expands contributions to society. “This alternative incorporates aspect that will be attractive to people across the political spectrum, bringing us all together,” Miller says.

    The subtitle of The Alternative is “most of what you believe about poverty is wrong,” and Miller spent time both in the book and on Roberts’s podcast unpacking census data that shows only about 3 percent of Americans, not 15 percent, remain mired in poverty. For most, poverty is episodic, with families cycling in and out based on lost jobs or other crises. Of course, people need assistance in a crisis, Miller argues, “but we need a totally different and separate approach if we want people to build full, independent lives.” Listening to Miller expound on that approach is like drinking from a fire hose. But there are two first impression ideas that I found myself returning to over and over in the days after listening to him. One may already be evident in education reform; the other I’m uncertain how to apply.

    The first is “positive deviance,” uncommon but successful behaviors and strategies—“role models of what’s possible” in Miller’s description—that others in a community adopt and emulate. Historical examples abound of immigrants dominating certain trades and industries, such as Irish-born police officers in Boston, Polish-born immigrants in Chicago’s meat-packing industry, and more recently, Cambodians in Los Angeles opening donut or auto repair shops. In post-Civil War Oklahoma, Miller notes, “newly freed African Americans built over fifty all-Black townships, each its own micro-economy since Blacks were largely excluded from doing business with white Americans.” In each case there were no government services or nonprofit social service programs. “Sharing and mutuality was key,” he observes.

    You can see a version of this at work in high-performing New York City charter schools where West African families are visibly over-represented. Not long ago, I interviewed a pair of South Bronx mothers who described themselves and referred to each other as sisters, even though they were unrelated. One was from Senegal; the other from Burkina Faso. I was curious to know how their kids and so many of their friends and neighbors’ children had ended up in the same local charter school. “When we have this good thing, we watch out for each one,” explained one of the mothers. “We do it the African way.”

    It’s less clear how to apply to education another of Miller’s big ideas: simply getting out of the way. The belief that we should avoid “deficit thinking” in working with low-income families is nearly a bromide, but Miller’s means it in the most literal way. On Roberts’s podcast and in his book, he describes firing staff members for giving advice and support to families. In his view, that’s evidence that they don’t truly trust families enough or have faith in their resourcefulness or ability to help each other. “As examples of mutuality have grown, what we have found is that every time my staff has stepped back,” he writes, “the families have stepped up and their solutions are much more relevant to their circumstance or culture than ours could ever be.”

    You know you’re in the presence of powerful ideas when at once you’re knocked off-balance by their undeniable rightness, but can’t conceive of how to apply them—and you can’t let it rest. We recite the homily of empowering parents and rejecting deficit thinking in education. But just as surely, we don’t really trust low-income parents. If we did, vouchers would be less controversial, and we likely wouldn’t insist as adamantly on the muscular, test-driven accountability schemes of the past few decades “to ensure high-quality choices.” Vouchers or cash transfers might seem like the obvious answer, but Miller seems not to agree. “Just offering money, as with passing policies or providing services does not change the sense of control people need over their lives,” he notes. Education barely rates a mention in his book, but he does suggest the poor “want choices that let them take control.”

    Perhaps there is no straight translation of Miller’s way of thinking to education. Maybe he’d just fire us all for trying to help families instead of trusting them and staying out of their way. But it’s been awhile since I’ve found myself as captivated and challenged as I was listening to Lim Miller on EconTalk or by reading his book. The Alternative is on my summer reading list for rereading and reflection. I urge you to put it on your list, too.


    view

    Understanding race-match effects

    6.19.2019
    Flypaper

    A cottage industry of studies shows the critical relationship between having a same-race teacher and a host of short- and long- term educational outcomes, including test scores, expectations, disciplinary actions, college intent, and more. This research relies on state longitudinal administrative data that allow researchers to use a host of designs to estimate these relationships. In a variety of settings, black students do better when they have a black teacher.

    These studies’ conclusions engender mixed reactions from the field. At a basic level, one policy implication is to diversify the teacher workforce, which we know is not representative of the public-school student population. So from a bureaucratic representation standpoint in which teachers are viewed as street-level bureaucrats, educators should be more diverse writ large. Yet the preponderance of this research goes further and claims that the actual matching of teachers to students is what makes the differences. The results also have uncomfortable implications for the role that white teachers are playing with students of color. At the most cynical level, these findings can be used to make arguments for segregated schools and classrooms.

    Regardless of how we grapple with the implications of these studies, however, we need to start considering the mechanisms through which these matches make a difference and how we might intervene to reap some of the positive benefits. Doing so stands to affect every stage of the teacher human capital pipeline, from educator preparation through retention. Are these matches unique to certain settings, for example? And how do these relationships work in majority-students-of-color settings?

    New research from the Fordham Institute is a unique contribution to this literature because it explores how these matches might differ according to a school’s governance structure—i.e., whether it’s a charter or a traditional public school. The author, Seth Gershenson, finds that charter schools in North Carolina have more diverse teachers, as well as suggestive evidence that race-match effects are stronger in charter schools. These results are interesting because they offer more evidence that diverse teachers can lead to better outcomes for diverse students. More importantly, this provides us with actionable evidence around a potential mechanism.

    The Fordham report also offers more support for promising policy interventions that might help stakeholders attain more diverse workforces. It observes, for instance, that one potential reason for charters’ more diverse faculty is that the sector is more likely to employ educators from alternative training routes. These tend to be more diverse than traditional schools of education, in part because many explicitly focus on producing teachers of color. Elsewhere, I have written about the potential of Grow Your Own programs as one way that local districts can increase diversity and best meet the needs of their students. Such initiatives can be classified under the broad range of alternative, nontraditional ways that teachers can enter the classroom. There is also room for Federal policy to support these programs.

    Race/ethnicity-match studies have uncovered some interesting relationships that provide a compelling lever to close persistently stubborn achievement gaps. Moving forward, we should continue to document these relationships but keep an eye on the mechanisms and settings in which we see these effects. Traditional public schools can learn from charters on the question of educator diversity.

    view

    The relationship between TFA, student achievement, and teacher qualifications

    Jessica Poiner
    6.18.2019
    Flypaper

    Teach For America (TFA) has been recruiting and placing college graduates into underserved classrooms since 1989. Throughout this thirty-year tenure, the program’s teacher-training methods and recruitment strategies have evolved. Some of the most significant changes occurred around 2005, when the organization refined its training curriculum, completed a substantial expansion, and began incorporating student data into analyses of performance. 

    TFA corps members make up only a small fraction of teachers in America’s classrooms, but there is no shortage of research on their impact. Early evidence was mixed and inconclusive, but a number of more recent studies find positive effects in various subjects and grade levels. Very few of these studies, however, take into account the dynamic nature of TFA over time, opting instead to view the organization as a static intervention. This new study by Emily Penner of the University of California, Irvine, attempts to fill that gap by examining the relationship between TFA, student achievement, and observable teacher qualifications over time.

    The report analyzes data from classrooms in two of the three TFA regions that currently operate in North Carolina: Eastern North Carolina, which was founded in 1999, and Charlotte, which was founded in 2004. (The third region, North Carolina Piedmont Triad, was founded in 2015 and thus not included in this study.) The North Carolina Educational Research Data Center at Duke University (NCERDC) provided student records that were matched to their teachers, and TFA assisted in identifying teachers who joined the corps between 1999 and 2010. They matched 1,304 corps members with NCERDC data—699 in Eastern North Carolina, and 605 in Charlotte. Between both regions, 904 were assigned to teach a tested subject.

    The author focuses on schools, grades, and years that had at least one TFA and one non-TFA teacher placed in tested subjects. Achievement is based on end-of-grade or end-of-course student test scores beginning in fourth grade. In elementary and middle school that includes math and reading, but four subjects are included for high school: math, English, science, and social studies. The study controls for several student variables, including gender, race/ethnicity, parent education, English proficiency, special education status, and gifted status.

    The findings indicate that the relationship between TFA teachers and student achievement—what the author refers to as the “TFA effect”—is positive in every subject and grade except elementary reading, where the results were negative but not significant. Effects are the largest in high school science, but are also substantial in math. Having a TFA teacher is also associated with significantly higher achievement in high school social studies, elementary and middle school math, and at a more marginally significant level, high school English.

    The report also examines whether the relationship between TFA teachers and student achievement can be explained by observable teacher qualifications, such as years of experience, the selectivity of the individual’s undergraduate program, Praxis licensure exam scores, and whether a teacher was fully certified or had a master’s degree. There are large differences in these qualifications between TFA and non-TFA teachers: TFA corps members are much less experienced, and less likely to be fully certified or hold a master’s degree. But their average Praxis scores are 0.4 standard deviations higher than teachers in the same school, subject/grade, and year. This suggests that TFA teachers have a stronger grasp of the material than non-TFA teachers, even though they lack experience and formal credentials. The data also show that Praxis scores are the only observable characteristic that partly explains the relationship between TFA and student achievement for nearly all subjects.

    In terms of trends in TFA impacts over time, the report compares the effects of TFA prior to and after the 2005 organizational changes. Results from elementary math and middle school math and reading are “indicative of an improvement” pre- and post-change. Three of the four high school subjects—English, science, and social studies—also indicate improvements. In high school math, the positive association between a TFA teacher and achievement was sustained, though effects in the earlier period were slightly larger than in the latter.

    Overall, the findings of this study indicate that, in many subjects, TFA teachers have been “associated with improved academic performance over more than a decade.” Importantly, their impact has increased over time in several subjects, at least among those working in North Carolina. These improvements cannot be accounted for by teacher qualifications, and they did not occur immediately after TFA’s substantial reform efforts in 2005. Instead, the positive trends suggest “gradual improvements over time,” which could be an indication that TFA’s reforms took several years to make an appreciable impact. So far, there is no research that isolates which specific reforms led to improvements—but perhaps in the future there may be.

    SOURCE: Emily K. Penner, “Teach For America and Teacher Quality: Increasing Achievement Over Time,” SAGE Journals (May 2019).

    view

    How school quality differs within districts

    Kara Long
    6.19.2019
    Flypaper

    School quality can vary drastically within districts, so district-wide averages of ratings often leave out important information. This can cause problems for stakeholders, such as parents who use these data to choose communities in which to live. But just as individual school grades vary, the range of good versus bad schools may be substantially larger in some districts than in others. A new Manhattan Institute report by Marcus Winters examined whether this is so.

    Winters analyzed student proficiency levels on standardized assessments for sixty-eight of the largest districts in the nation. Schools serving more low-income students tend to have lower test scores for a variety of reasons, many of which lie outside the school’s control. To control for this, Winters used “adjusted overall proficiency” scores, which are based on the percentage of students who would be expected to score proficient or better on assessments if a school had the same proportion of students eligible for free and reduced-priced meals as the average U.S. school.

    Winters defined “good” schools as those above the 75th percentile on the adjusted proficiency score distribution, and “bad” schools as those below the 25th percentile. And he determined variation in school quality between districts by looking at the distance between those percentiles.

    He found that most districts had similar gaps between their good and bad schools. This tends to be between 15–20 percentage points, meaning that proficiency rates at better schools were that much higher than at their more struggling counterparts. Meanwhile, eleven cities— including New York, San Francisco, and Newark—had gaps that exceeded 25 percentage points. And in a dozen cities, including Birmingham, Alabama, and Rochester, New York, the gap was less than 15 points.

    Winters also examined whether poor and minority students were more likely to attend districts with higher variation, as well as the effect of racial and income-based segregation. He didn’t find a strong correlation between school-quality variation and districts with larger proportions of poor, black, and Hispanic students. But there was a positive relationship between higher variation and higher levels of segregation.

    Winters surmises that this correlation may exist for two reasons. First, resources like quality staff or per-pupil funding may not be equitably distributed among schools in more segregated areas. And second, research has shown that interaction with high-income peers has a positive impact on the test scores of low-income students. When low-income students are relegated to certain schools, their ability to interact with high-income peers is severely limited.

    For families attempting to send their children to high quality schools in urban areas, where average and median scores tend to lag behind those in suburban areas, these findings suggest that there are still pockets of good options there. But this is only useful if those parents can access those schools—which is too often not the case. Thus for policymakers, these results only strengthen the case for dynamic, high-quality school choice.

    SOURCE: Marcus A. Winters, “Quality Control? How School Performance Varies Within American Cities,” Manhattan Institute (2019).

    view

    The Education Gadfly Show: Getting wonky on the Democratic candidates’ education ideas

    6.19.2019
    Podcast
     

    On this week’s podcast, Conor Williams, a fellow at the Century Foundation, joins Mike Petrilli and David Griffith to discuss the leading Democratic presidential candidates’ education proposals. On the Research Minute, Amber Northern examines how student academic growth data affects parents’ choice of districts.

    Amber's Research Minute

    David M. Houston and Jeffrey R. Henig, “The Effects of Student Growth Data on School District Choice: Evidence from a Survey Experiment,” retrieved from Annenberg Institute at Brown University (June 2019).

    Fordham Logo

    © 2026 The Thomas B. Fordham Institute
    Privacy Policy
    Usage Agreement

    National

    P.O. Box 110
    Burke, VA 22009

    202.223.5452

    [email protected]

    Ohio

    P.O. Box 82291
    Columbus, OH 43202

    614.223.1580

    [email protected]

    Sponsorship

    130 West Second Street, Suite 410
    Dayton, Ohio 45402

    937.227.3368

    [email protected]