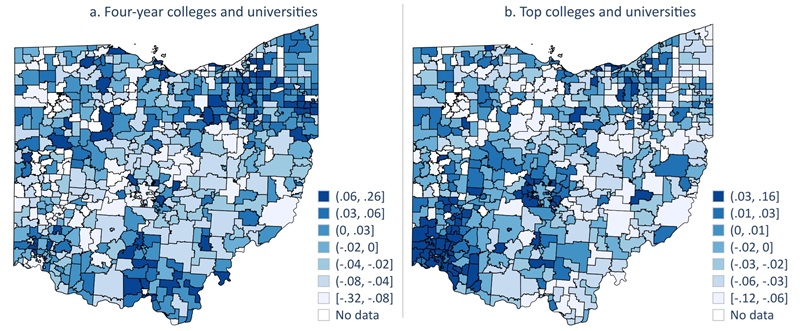
Ohio families investigating public school options have lots of readily-available data to compare. Parents interested in private schools have less information to examine, but there’s more than you might think. Here is a proposal to help make those data more user-friendly.
Ohio has a choice-based education system that empowers families to make schooling decisions based on what’s best for their children rather than what they can afford. In a conventional system, families assigned to a persistently low-performing school would be stuck there unless they could afford to move to a different neighborhood or an entirely new district. The same is true for parents looking for a safer school, one that offers specific courses or extracurriculars, or a building that’s just a better fit. But in Ohio, all families—not just the wealthy ones—have alternatives through public and private school choice programs.
Those who are interested in public options can consult state report cards, which are annually updated by the Department of Education and Workforce (DEW), to examine data on a variety of academic and non-academic measures. This information is crucial in helping families make informed choices. But parents considering one of Ohio’s five private school choice programs, which provide scholarships for eligible students to attend non-public schools, don’t have access to a similar resource.
That’s not to say data aren’t available. Ohio collects and publishes plenty of information on scholarship-accepting private schools. But most of it is scattered across various webpages and hasn’t been put into a parent-friendly format. Many private schools offer information on their websites, but meaningfully comparing schools can be difficult and time-consuming. Even when parents have the time and energy to spare (which is no small feat), it can be hard to sort through fact and fiction because choice opponents routinely floodthe media with misleading claims and inaccurate analyses.
If Ohio is going to deliver on the promise of its choice-based education system, families need user-friendly data on all their options. That’s why state officials should consider creating annually updated informational sheets for each scholarship-accepting private school and then publishing them on the state’s website.
But what would these informational sheets look like? To help visualize the possibilities, Fordham has designed two samples: one for a fictional elementary school and another for a fictional high school. Both contain the following information:
Details including the school’s address, phone number, website, grade span, and student enrollment.
Which state scholarships the school accepts, as well as the number and percentage of the student population that attends via each scholarship.
Confirmation that the school meets state operating standards and background check requirements.
Student and teacher demographics.
Academic outcomes. For achievement, that includes the percentage of students who scored proficient or above on state or state-approved alternative tests, both schoolwide and broken down by grade and subject. Student growth data, which will be calculated beginning in 2026, would appear as well.
It’s important to recognize that all the information listed above is already publicly available. Private schools are required to report these data to participate in Ohio’s five scholarship programs, which means lawmakers wouldn’t need to mandate additional reporting requirements or testing. The administrative burden would fall on the state, not schools, to create a parent-friendly information system. And unlike national websites like GreatSchools, which also offer families useful information, these sheets would be Ohio-specific.
There are, however, two areas where private schools should be given the option to submit additional information.
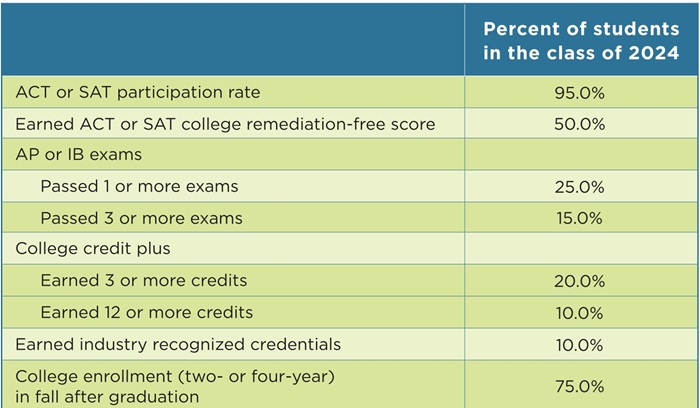
The first is college and career readiness. Public school report cards measure this via the College, Career, Workforce, and Military Readiness component. The data identified in Table 1 below would provide families considering a private school scholarship with similar information and a clearer picture of how high schools are preparing students for life after graduation.
Table 1. College and career readiness outcomes on a sample information sheet
The second is an opportunity for schools to describe unique offerings or points of pride. A language immersion program, work-based learning opportunities, high percentages of graduates accepted to Ivy-League institutions, championship athletic teams—the possibilities are endless. Giving schools an opportunity to share what makes them great acknowledges that families choose schools for all sorts of reasons.
At the end of the day, access isn’t access unless it’s accompanied by information. Ohio’s robust school choice sector is set up to ensure that every family—regardless of income—has multiple school options. To help parents navigate these options, the state should provide tools that enable them to compare and make informed choices. Ohio already has the data to provide families with these tools. It’s time for state officials to put that material to good use and empower families.
Introductory economics teaches students to distinguish between complements and substitutes. Complements are interdependent goods: things like hot dogs and buns. Substitutes, on the other hand, are products that can replace each other, like coffee and tea.
In the education world, academics and career-technical training should be viewed as complements, not substitutes. That’s exactly how federal law describes career-and-technical education, which says that it “provides individuals withrigorous academic contentand relevant technical knowledge and skills.” The “and” is pivotal. Career-tech—the serious kind that opens doors for young people—includes both strong academics and technical content. It’s not career-tech at the expense of academics.
Unfortunately, Ohio policy too often views career-tech and academics as substitutable. This is nowhere more evident than in graduation requirements. Recall that Ohio’s main graduation pathway requires students to demonstrate competency—a rather modest bar—on the state Algebra I and English II exams. So far so good, and most Ohio students do indeed achieve this standard. But here’s the catch: The state also allows students who are struggling to pass those tests to complete a career-technical alternative to graduate. To meet this option, students must attain industry credentials or pass technical course exams. The upshot: This loophole permits high schools to ignore students’ academic weaknesses and instead award diplomas based on career-technical measures alone.
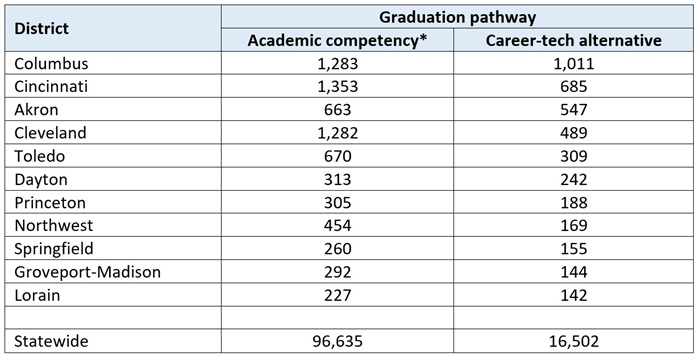
How often does this occur? Table 1 shows that 16,502 students in the class of 2024 received diplomas through the career-tech route (12 percent of the cohort). In districts such as Cincinnati, Cleveland, and Toledo, hundreds of students graduated this way. In Columbus and Akron, nearly as many students graduated via the career-tech option as met the state’s academic competency standard. Remember, such students did not demonstrate competency in English and math. Instead, as my recent report indicates, they often graduate by collecting credentials of questionable value, such as retail and public-safety certificates or generalist CPR certifications.
Table 1: Districts with the most students graduating via career-tech alternative
Source: Ohio Department of Education and Workforce. Notes. (*) This includes students who achieve the state’s competency score on the Algebra I and English II end-of-course exams, as well as a small number of students with disabilities who meet competency requirements via alternative exams. The total number of graduates in the class of 2024 were 117,979 and 15,678 non-graduates (total cohort = 133,657 students). Less than 100 students statewide graduated via the other alternatives of military enlistment, dual enrollment, or ACT/SAT scores.
When schools award diplomas to students who cannot read, write, and do math, it sets them up for a lifetime of failure and frustration. Young people with a customer service certificate might be able to find an entry-level job in retail. But what if they want to move up the corporate ladder into a better paying position—one that might allow them to provide for a family? Or what if they want to start their own business? Those positions require strong English and math skills. Consider also how many professions—even those not necessarily demanding college degrees—require candidates to pass a standardized exam just to get their foot in the door. In the area of public safety, police officers, firefighters, and paramedics have to pass exams that require academic skill. Jobs in healthcare, construction, and financial services also have exams.
Poor academic preparation doesn’t just restrict entry to professions and limit job promotion, but it also hurts workers’ ability to change careers. Some workers—perhaps tired of the same routine or backbreaking work—may simply desire a change of scenery. Others might need to reskill due to larger economic forces, including the AI revolution that could easily decimate thousands of jobs. But their chances of a successful transition are diminished when they struggle to read basic materials or solve math problems.
Career-technical education, done right, can be a game changer for students. It gives them practical skills and experiences that ready them for the workforce. But it shouldn’t be a substitute for reading, writing, and arithmetic. Ohio must insist that every student is competent in English and math before graduation, while also providing greater flexibility in its course requirements to allow for rigorous technical training for those preparing for the workforce. Academics plus strong career-connected learning is the best way to ensure that the next generation of Ohioans have what they need for long-term success.
In short, it’s been a busy few years for career-connected learning in the Buckeye State. But will that progress continue? Next fall, Ohioans will vote for a new governor—one who will have to decide if and how to sustain DeWine’s efforts.
A recent nationwide poll of registered voters[1] indicates that maintaining and expanding these efforts has significant public support. Let’s take a closer look at three key takeaways that candidates—gubernatorial and otherwise—should keep in mind as they craft their policy agendas.
1. Voters believe that better preparing students should be a top priority.
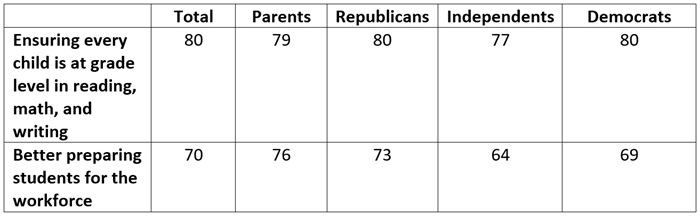
When asked how to improve education in their state, 70 percent of voters said that better preparing students for the workforce should be a “very important” priority. The only option to receive a larger share of support was ensuring that every child performs at grade level in reading, math, and writing, while improving school safety registered as equally important to workforce preparation. Collectively, these results suggest that a strong majority of voters would approve of efforts toimprove studentpreparedness. Parents, in particular, would be supportive, as more than three-fourths of those surveyed (76 percent) rated better preparing students for the workforce as very important. These priorities are also bipartisan, as they have significant support across the political spectrum.
Table 1. Percentage of voters who believe that student preparedness should be a top priority
2. Voters want students to have access to career-connected learning.
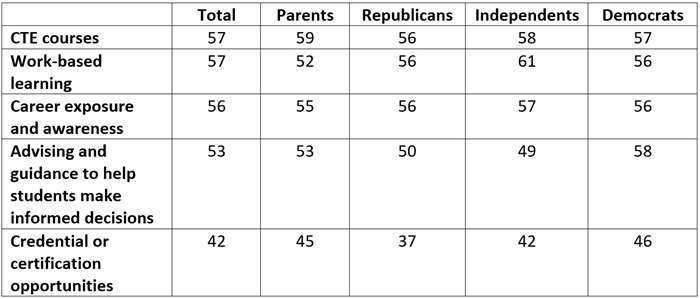
A majority of voters across the political spectrum believe students should have access to career-connected learning opportunities. Table 2 identifies several options and their levels of support. The most popular are CTE courses and work-based learning, both of which clock in at 57 percent overall. Career exposure and awareness isn’t far behind at 56 percent. Meanwhile, credential or certification opportunities have the least amount of support—perhaps a sign that efforts to improve how Ohio identifies credential value are crucial.
Table 2. Percentage of voters who believe students should have access to career-connected learning opportunities
3. Voters value individualized career planning.
According to poll results, there’s overwhelming support for ensuring that every student has “a path and plan that prepares them with the academics and job skills they need for careers.” A whopping 86 percent of voters approve of the path-and-plan idea, with 52 percent indicating that they strongly support it. These sky-high numbers offer ample proof that DeWine was on the right track with his career planning proposal, despite lawmakers failing to include it in the final version of the recent state budget. Ohio’s next governor would be wise to pick up where DeWine left off.
Candidates should also consider calling for career exploration and planning efforts to begin in middle school. Poll results indicate that 47 percent of voters believe that career exploration programming should begin in high school, compared to 40 percent in middle school. But Chart 1 indicates that parents—who are arguably the most invested in kids being prepared—are more supportive of starting in middle school. The parents of middle school students, in particular, seem to recognize the value of offering programming earlier.
Chart 1. When parents believe career exploration programming should begin
***
A hallmark of the DeWine administration has been its emphasis on career pathways. As a result, Ohio has established several promising policies aimed at expanding and improving career-connected learning. Building on those efforts will help kids—and recent polling indicates it’s popular with voters, too. Here’s hoping Ohio policymakers seize the opportunity.
[1] The poll is a national survey of 1,015 registered voters conducted by UpONE Insights and Impact Research between August 21-27.
Election day is upon us—today, for those who may have forgotten! Despite being a sleepy “off-cycle” election, citizens will be asked to vote on weighty matters of local governance, including their school board members. As a reminder, these boards set the overall direction and tone for districts by carrying out responsibilities that include:
Negotiating and approving union contracts, which include salary and benefit provisions and other stipulations that impact the culture, effectiveness, and fiscal health of the district.
Selecting the textbooks and curricula used in classrooms (not all programs are equally rigorous, and these decisions bear on instructional quality).
Deciding whether the district takes a positive or negative stance on parental rights, including their ability to choose non-district options such as public charter and private schools;
Choosing to put tax requests before local voters, a decision that directly impacts citizens’ wallets.
Given the importance of school boards, Ohio should have policies that empower local citizens to hold these elected bodies accountable. Two ways to encourage this is by maximizing voter participation and promoting transparency at the ballot box. Yet on both counts, the state falls short.
Off-cycle elections and lackluster voter participation
Ohio, by virtue of its constitution, holds school board elections in odd-numbered years when far fewer Ohioans are paying attention to politics and going to the polls. The odd timing changes the makeup of the electorate. One analysis, which includes data from Ohio, finds that school employees—people voting for their bosses—comprise a larger portion of voters in off-cycle elections. On the other hand, low-income citizens and parents are less likely to vote in these elections—not necessarily a surprise given their time and resource constraints.
The electoral skew has implications for district governance. Most notably, the outsized influence of district employees, who can vote en bloc for candidates endorsed by their unions, raises concerns about board members’ allegiances and priorities. When push comes to shove, will they put union interests first—e.g., hiring more staff, providing more generous salaries and benefits, and shielding employees from accountability? Or will school boards prioritize students, parents, and taxpayers? Given their electoral incentives, the answer is clear: School boards are more likely to pursue union-friendly policies, ones that tend to drive up costs, hinder academic excellence, and stymie school choice.
Moving school board elections “on-cycle,” as suggested by severalscholars and educationreformers, would boost voter turnout and ensure a more representative electorate. With broader participation, school board members will have to weigh others’ voices, including parents’, when they make decisions. Changing Ohio’s electoral calendar would require a constitutional amendment, which is a heavier lift than revising state law. But lawmakers are not entirely hamstrung. They can and should initiate the process to put a statewide referendum before Ohioans to amend the constitution and move school board elections on cycle.
Nonpartisan ballots and paltry voter information
The other challenge with school board elections is the anonymity of most candidates, made worse because party labels do not appear on the ballot. In the absence of this information, the burden falls on voters to find out about candidates, so they can cast ballots in ways that are congruent with their values and preferences.
But, if my experience is representative, this is no easy feat. Here in our small-town district in Northeast Ohio, we have four candidates running for three seats this fall. In an hour or so of Googling, I learned that one is an incumbent but nothing else, and came up empty on the others. No public events were posted online where community members could meet and ask candidates questions. No interviews were found in my hometown paper. I haven’t seen a single notice in parent emails from our district on where to find information about the candidates. Without a clue who these people are, this voter intends to leave the school board section of the ballot blank.
Other Ohioans may be equally perplexed. Some may vote based on which name sounds the most trustworthy or what yard sign they liked the best. Others might pick the name that appears at the top of their ballot. Still others might select based on the assumed gender or ethnicity of the candidate. Many others will simply choose to not mark their ballot, even if they vote on other matters, or just sit out the elections altogether.
As a service to citizens, Ohio should require party identification to appear next to candidates’ names on the ballot. Though not a perfect method—some have argued it could encourage even more culture war fights—party affiliation is the time-honored way that candidates for many elected offices are identified. It would give voters a general sense of how candidates might approach important education issues where there are partisan differences (e.g., unions, taxes, and choice). It would also make it more transparent to communities the political composition of their overall school board—and hold its members more accountable if they stray too far. Finally, it could also reduce the shadowy practice in someplaceswhereby partisan groups line up behind a slate of candidates, even in these outwardly “nonpartisan” elections. Why not take the masks off?
Several years ago, Ohio lawmakers added partisan labels for judicial elections, information that has increased transparency about who sits on our benches. Earlier this year, state lawmakers also attempted to shift to partisan ballots for school board elections via the state budget legislation. Unfortunately, Governor DeWine vetoed the changes. Lawmakers should continue to pursue election reform, whether through an override or attempting to pass another bill.
* * *
Healthy democracies depend on an informed and engaged electorate. But structural impediments, such as electoral timing and ballot (non)transparency, weaken the democratic process for choosing local school boards. What we end up with are low-turnout, low-information elections. This dynamic opens the door to union capture of the school board and associated dysfunctions such as spending problems, weak accountability, or cultural battles. As public school advocates like to remind us, most Ohio students still attend district-run schools. Let’s make sure they are led and overseen by individuals known by their communities and held accountable at the ballot box.
Johns Hopkins University researchers have already conducted important research that describes why families choose homeschooling, revealing the growing numbers of such families in recent years, and explaining the changing demographics of homeschoolers. And last month, they brought us another look at this burgeoning education sector, examining homeschooled students’ ability for self-regulated learning and self-efficacy. The new findings are a bit less robust than their earlier groundbreaking work, but valuable nonetheless.
The new report is credited to three JHU researchers—Xue Wang, Genevieve Smith, and Angela Watson—and is a systematic look at a number of prior studies on the topic of homeschooled students’ motivation and perseverance toward achieving learning goals. Self-regulated learning (SRL)—typically defined as the “active, constructive process whereby learners set goals for their learning and then attempt to monitor, regulate, and control their cognition, motivation, and behavior, guided and constrained by those goals and the contextual features of their environment”—and the related area of self-efficacy (or, student belief in their academic abilities) have been consistently linked toacademic achievement, motivation, and overallwell-being of young people. However, nearly all of this knowledge comes from research in conventional school settings. Reasoning that homeschooled students could experience greater autonomy in learning, more personalized instruction, and different forms of social interaction than their traditionally-educated peers, the researchers looked to a raft of existing data to see if impacts and implications specifically for homeschoolers could be teased out.
Wang and her team identified a total of 23 studies that fit their selection criteria—meaning those with original empirical findings focused on K–12 homeschooled students that reported descriptive statistics related to SRL or self-efficacy outcomes (for quantitative studies) or investigated factors influencing SRL or self-efficacy outcomes (for qualitative studies). Two-thirds of the selected studies appeared in journals, while the remainder came from dissertations. About half were published between 2000 and 2020, and the rest between 2021 and 2024. Two analyses provided both quantitative and qualitative findings, resulting in 15 studies contributing quantitative data and 10 contributing qualitative data. A majority of the studies were conducted in the United States. The combined sample size for all selected studies was 6,312 participants.
Their first research question—levels of SRL and self-efficacy reported among homeschooled students—was addressed by six of the quantitative studies. Two of those used rating schema created by the original researchers, while the other four applied existing instruments, such as the Social Skills Rating System and the Self-Efficacy for Learning Form. The researchers streamlined the various schema into a single scale of low to high self-efficacy. The combined findings suggest that homeschooled students had moderate to high levels of confidence in their academic abilities. However, available data cannot determine whether homeschooling contributes to these skills or if families select homeschooling for children who already possess these characteristics.
The second research question—how homeschooled students’ SRL and self-efficacy compared to conventionally-educated peers—was addressed via data from eight of the quantitative studies. The evidence was mixed, with one study reporting significantly higher academic self-efficacy scores for homeschooled students than their conventionally schooled peers, even after controlling for socioeconomic status and parental involvement. However, the other studies found no difference or non-significant differences with homeschooled students slightly lagging traditionally-educated students.
The final research question—examining the factors that impact SRL and self-efficacy in homeschooled students—resulted in a list of five primary influences. These are the level of parental involvement and teaching approaches used (unschooling, co-ops, virtual learning, etc.), curriculum structure and flexibility, learning environment characteristics, social interactions and community involvement outside the homeschool context, and student age and developmental factors. Data from the 10 qualitative studies show strongly interwoven influences, with individualized feedback, parent modeling of SRL and self-efficacy, and reduced performance anxiety based on curriculum structure recurring as mechanisms through which homeschooling may foster self-efficacy development. Wang and her team suggest that these qualitative findings “complement the quantitative findings by illustrating the processes and contexts that may explain the generally high levels of SRL and self-efficacy observed among homeschooled students.”
The biggest takeaway in the report is that perennial concerns about homeschooled students being academically deprived in some way by not experiencing a traditional education model are likely overstated. In fact, in the vital area of student self-motivation, homeschooled students in these studies show at least as much self-efficacy for learning than their traditionally-educated peers. And even though these are not causal findings, they still highlight the importance of considering student and family diversity when developing policies that impact education writ large. Politicians, pundits, parents, and the education establishment should accept that homeschoolers are not automatically disadvantaged for making this choice and, in many cases, are actually better off.
A new study published in The Economic Journal in the United Kingdom attempts to untangle the intertwined influences of cognitive skills and human capital development on adult wages over a person’s lifetime. It’s an ambitious effort that sheds some light on a perennial issue but raises additional questions in the end.
Researcher Uta Bolt from the University of Bristol utilizes longitudinal data from the National Child Development Study (NCDS), which has followed the same cohort of individuals—nearly all people born in the U.K. during a single week in March 1958—for almost 60 years. They were first surveyed via their parents at birth, and followed up at ages 7, 11, 16, 23, 33, 42, 46, 50, and 55. Detailed survey data include information on the circumstances of individuals while growing up—such as parental education and household size—as well as circumstances during adulthood, including wages, occupational choice, and periods of unemployment. Importantly for Bolt’s study, extensive cognitive testing was conducted with individuals at ages 7, 11, and 16, as well as at age 50. Her analytical cohort comprised all those NCDS participants who took part in cognitive testing at age 16 (1974) and at 50 (2008).
It is worth noting, as my Fordham colleague David Griffith does in his podcast review of this report, that the singular term “cognitive skills” is a simplification of a complex comparison. “The measures of adulthood cognitive skills are clearly not identical to the measures of childhood cognitive skills,” Bolt herself writes. “In particular, the age-16 cognitive skills are primarily based on learned concepts (e.g., doing algebra), whereas the age-50 cognitive skills do not require knowledge of any particular learned concept.” The age-50 tests included things like recalling 10 common words read out to them several minutes earlier and a “letter cancellation exercise” where participants were asked to cross out as many “Ps” and “Ws” as they could from a page of random letters within one minute. These test “attention and mental speed” generally, rather than specific verbal or mathematical skills. But Bolt ran additional tests on the two sets of results and ensured their comparability to her satisfaction, writing that her concerns that the tests capture completely different skills were alleviated. She still suggests keeping the variation in testing types in mind when considering the conclusions, which we shall do.
Here are the main regression analysis results: First, childhood cognitive skills persist strongly into adulthood. That is, individuals were likely to show the same skill level—relatively speaking—at 50 as at 16. Second, wages at age 50 are better predicted by cognitive skills at 16 than by cognitive skills at 50. These two findings imply that human capital development may operate on different tracks for cognitive skills versus wages, and the final three findings clarify this. To wit, additional education predicts higher cognitive skills and higher wages, while occupational choice predicts wages, but not cognitive skills at 50. Periods of time spent out of the labor market (a.k.a. unemployment) lower wages but not cognitive skills at 50.
While some of this seems counterintuitive—surely workers get paid in relation to the value of skills they possess—it would make more sense if it is true that cognitive skills and workplace skills operate on separate trajectories. As researcher Bolt puts it, “wages and cognitive skills capture distinct dimensions of adulthood human capital—adulthood investments that predict higher wages do not necessarily predict higher cognitive skills. In fact, education is the only investment which predicts both higher wages and higher cognitive skills at age 50.” All of this is predicated on the cognitive skills measured by the NCDS project at age 16 being the same as those measured at age 50, which we have already suggested may not be the case, despite the robustness checks conducted on the skills test data.
We are left with some interesting information that points to more questions than answers, such as how to best prepare young people for a prosperous future based on their cognitive starting points and how much those cognitive starting points can realistically be boosted if needed.
America is wasting much of its human capital. That’s because many high-achieving, low-income students—we call them HALO students—fall off the education track and never reach the gates of our top colleges and universities. Regrettably, these capable young people won’t reap the benefits of a four-year degree, which remains a solid engine for upward mobility and career success. Their families, communities, and states won’t benefit from maximizing their capabilities. This represents a tragic loss of potential, while also leaving our best colleges and—later—our most promising occupations bereft of socioeconomic diversity and looking less like the nation writ large.
We at the Thomas B. Fordham Institute have long been troubled by this leaky pipeline from K–12 to higher education. Throughvariousempiricalstudies, we have drawn attention to the disappointing outcomes of high achievers from less advantaged backgrounds. We have also worked to develop and widely share policies and practices that would help more high achievers reach their full potential.
The present study builds on those efforts to strengthen advanced education in U.S. schools, both generally and the Buckeye State particularly. We commissioned Ohio State University professor and Fordham research fellow Stéphane Lavertu to focus on the educational experiences and outcomes of HALO students in Ohio. His analysis addresses three main questions:
What does the K–12 education experience look like for Ohio’s HALO students?
How many of them attend four-year colleges, including more selective “top colleges”?[1]
What K–12 education factors best predict their college attendance?
To examine these questions, Dr. Lavertu used anonymous student-level records to study the trajectories of HALO students from elementary school into college (in and out of state).[2]
Key findings
This report presents irrefutable evidence that Ohio’s HALO students are underserved by most school systems, and that too many fail to reach college after high school. Compared to similarly scoring students from more affluent backgrounds, Ohio’s HALO students are:
26 percent less likely to take advanced math—primarily Algebra I—during middle school.
34 percent less likely to complete an Advanced Placement (AP), International Baccalaureate (IB), or dual-enrollment course during high school.
44 percent less likely to receive gifted services (e.g., accelerated coursework or enrichment) during middle or high school.
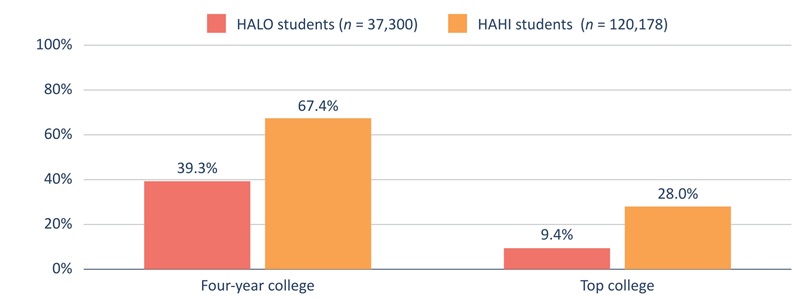
This systemic neglect has ramifications for their college-going. Figure A shows that only two in five HALO students enroll in any four-year college within two years of high school, and fewer than one in ten attends a top college. These college-going rates are far lower than those of high-achieving, high-income (HAHI) students. Specifically, Ohio’s HALO students are 42 percent less likely to attend a four-year college and 66 percent less likely to attend a top college than their similarly-scoring but more affluent peers.[3]
Figure A. HALO students attend college at much lower rates than their more affluent, similarly-scoring peers.
Note: The number of HALO and HAHI students identified in this analysis (37,300 and 120,178, respectively) is a combined total based on six years of third-grade test score data (2008–09 to 2013–14). Due to data limitations, the analysis was unable to track all HALO students into college (e.g., students moving out of Ohio), and thus the college-going rates are likely to be slightly understated.
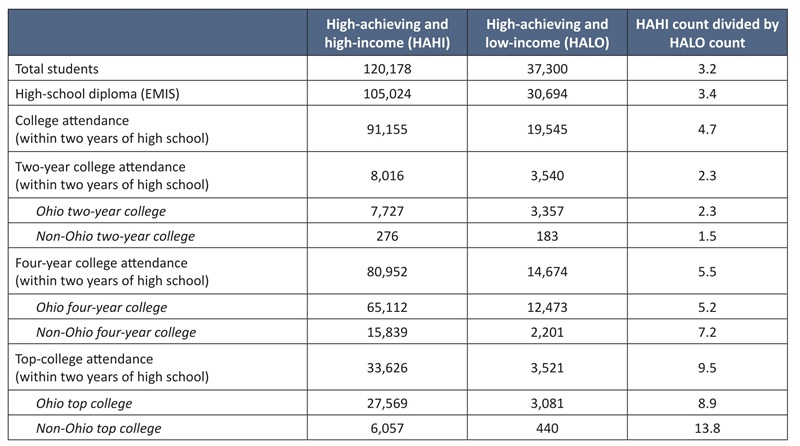
Underscoring how leaky this pipeline is for HALO students, consider this: While they are outnumbered 3-to-1 by their more affluent counterparts in the top achievement quintile in third grade, a decade later they are outnumbered 6-to-1 in four-year colleges and a staggering 10-to-1 in top colleges.
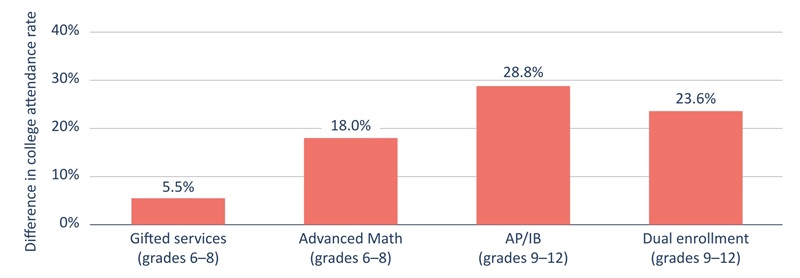
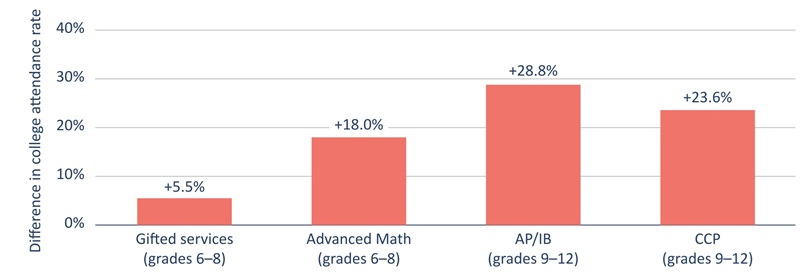
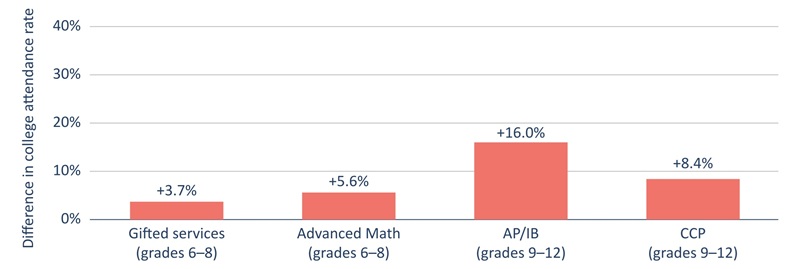
What would keep more HALO students on-track for college? Figure B shows that AP or IB and dual-enrollment course-taking during high school makes a difference in their college-going prospects, as do advanced math courses during middle school and gifted services in English language arts or math. For instance, HALO students who completed an AP or IB course had four-year college-going rates that are 29 percentage points higher than HALO students who did not complete such courses. These results provide compelling evidence that advanced learning opportunities are critical to keeping students on a college pathway.[4]
Figure B. HALO students who participate in advanced learning opportunities have higher four-year college attendance rates than HALO students who do not.
Note: This figure displays the differences in attendance rates at any four-year college. See Table 6 below for results for top colleges.
Policy implications
What should state and local policymakers do? Many solid recommendations were recently made by a national working group on advanced education, which can be found in a recent Fordham report. Here, let us highlight five ideas.
Ensure early identification of high-achieving students and provision of advanced education during elementary school. It’s hard for schools and teachers to provide advanced learning opportunities to HALO students if they don’t know who they are. Commendably, Ohio (and several other states) require universal screening in the elementary grades for gifted and talented programs (using non-state tests). Policymakers should go a step further and also require identification when students score at the highest levels on state exams—an important marker of academic ability. But identification alone won’t do students much good unless schools provide them opportunities to accelerate and advance. Here, states also have a role to play. They should require schools to provide advanced opportunities to identified students—and enforce that requirement through an audit-type process.
Promote automatic enrollment of high achievers in advanced middle school and high school math courses. A few states, including North Carolinaand Texas, have automatic enrollment policies that guarantee placement in advanced math courses based on students’ prior-year test scores. For instance, under this type of policy, high-performing seventh graders are automatically placed in eighth grade Algebra I, which is key to more advanced math in high school. Tying course placement to objective measures of achievement ensures that HALO students are in advanced courses—far more reliable than systems that rely primarily on subjective judgments or recommendations for such placements.
Expand access to AP and IB coursework into more high-poverty high schools. This goal has long been on the education-reform agenda, but there’s still much to be done to bring such challenging course options into schools that serve the most HALO students (e.g., high-poverty rural or urban campuses). This can be done in many ways, including, for example, “itinerant” programs, whereby an AP teacher covers classes in multiple schools or school districts, or virtual options that bring advanced coursework into classrooms anywhere in the state. Another possibility is to offer schools or teachers financial incentives when students pass AP or IB exams, as North Carolina does. A “weighted” bonus that provides additional funds when low-income students pass these exams could further strengthen the incentive for educators to start programs in schools that have not traditionally offered advanced coursework.
Help more HALO students access suburban public schools. In analyses pinpointing which Ohio districts most effectively boost the college-going odds of HALO students, we find several wealthy suburban districts—Solon, Mason, and Dublin among them—topping the charts (see here). That is good news for the handful of low-income students who live in those districts. However, many suburban districts, including two of the three mentioned above, prohibit non-resident pupils from attending their schools. States should require all districts, including suburban, to participate in statewide interdistrict open enrollment, a policy that enables students to cross district boundaries to attend school (or in lieu of a mandate, provide sufficient per-pupil funding to encourage district participation). This would put suburban public schools—and the advanced opportunities they typically offer—within greater reach of HALO students residing in nearby cities.
Launch specialized magnet schools for high achievers. When it comes to Ohio’s best high schools for HALO students (see here for overall rankings and here for rankings focused on top colleges), this varied mix includes a handful of urban district high schools, such as Walnut Hills in Cincinnati and Cleveland School of Science and Medicine, both of which have selective admissions. Also near the top are a few non-district options, such as Dayton Early College Academy, a public charter school that Fordham authorizes, and Metro High School, an independent STEM school in Columbus. Unfortunately, such schools are rare. School districts should work to create specialized, “early college” schools for high achievers—open to students regionally—as could charter or STEM school developers. Following in the footsteps of Illinois, North Carolina, and Oklahoma, states themselves could also create, and directly fund, a residential, competitive public high school that enrolls high-achieving students from all corners of the state.
HALO students have demonstrated their potential to reach college and use it as a springboard to the American dream. Yet due to the widespread neglect of their talents, our education system allows too many of them to fall through the cracks. There is a clear pathway that can better nurture HALO students. It includes early identification and acceleration in elementary school, access to advanced math coursework starting in middle school, and enrollment in high schools with strong college-prep curricula and college-going cultures. The playbook is there. Now the question is whether states and school systems can execute and give HALO students the challenge and rigor that prepares them to compete for spots at our top universities.
Executive Summary
Ohio has a large store of untapped human potential. Every year, thousands of students with exceptional academic ability—many from low-income households—fall off the path to college, missing out on opportunities to improve their economic well-being and, consequently, the prosperity of their families and fellow Ohioans. This report examines Ohio’s public-school pipeline to college, particularly for high-achieving low-income (HALO) students, and identifies the characteristics of districts and high schools that are most effective at getting these students into four-year colleges and universities.
The analysis defines HALO students as those who qualify for free or reduced-price lunches and whose state test scores put them in the top 20 percent of Ohio students (as of third grade or eighth grade, depending on whether the focus is on districts or high schools). It first provides a descriptive look at these students, comparing their demographic attributes and college attendance rates with those of high-achieving peers who do not qualify for free or reduced-price lunches. The analysis then employs statistical techniques to estimate “college-going value-added” for the Ohio districts in which HALO students reside and the specific high schools (including charter and STEM schools) they attend. Those estimates capture the extent to which students in a district or school exceed (or fall short of) average rates of college attendance among students with similar characteristics. Using these value-added[5] estimates, the analysis then examines factors that might explain the relative success of some districts and high schools in getting HALO students into college. Finally, the study focuses on how taking advanced coursework in middle and high school relates to HALO students’ college-going. Below are some of the most noteworthy findings.
First, there is evidence of a “leaky” pipeline to college for HALO students:
High-achieving low-income students are far less likely to attend college than their wealthier but similarly high-achieving peers. In third grade, HALO students are outnumbered 3-to-1 by similarly high-achieving students who are from wealthier households, but they are later outnumbered 6-to-1 at four-year colleges and 10-to-1 at top colleges (those where the average student scores in the top 20 percent on college admissions exams). Put differently, HALO students are 42 percent less likely to attend a four-year college than their wealthier high-achieving peers, and they are 66 percent less likely to attend a top college. If HALO students’ college-going rates matched those of their peers from wealthier households, 1,742 more of Ohio’s HALO students would enroll in a four-year college every year—and 1,153 of those students would enroll in a top college or university.
HALO students miss out on advanced coursework as they progress through school. The rate at which HALO students (identified in third grade) enroll in high school–level math courses (primarily algebra) while in middle school is 26 percent lower than it is for their wealthier peers. And the rate at which HALO students (identified in third grade) enroll in Advanced Placement (AP), International Baccalaureate (IB), or dual-credit options (as part of Ohio’s College Credit Plus program) while in high school is 34 percent lower than it is for their wealthier high-achieving peers. They are also 44 percent less likely than their wealthier peers to receive gifted services in English language arts or math in middle or high school (such as accelerated coursework or other specialized programs consistent with their gifted identification). If HALO students took advanced coursework at the same rate as their wealthier high-achieving peers, then 1,103 more HALO students in each third-grade cohort would ultimately take high school–level math courses during middle school and 1,644 more would take at least one AP course in high school.
Second, the analysis indicates that some districts and high schools provide HALO students with a bigger boost—they provide greater “college-going value-added”—and that there are commonalities between these high value-added districts and schools:
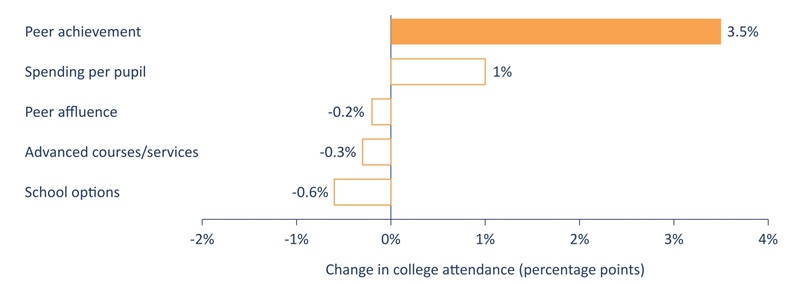
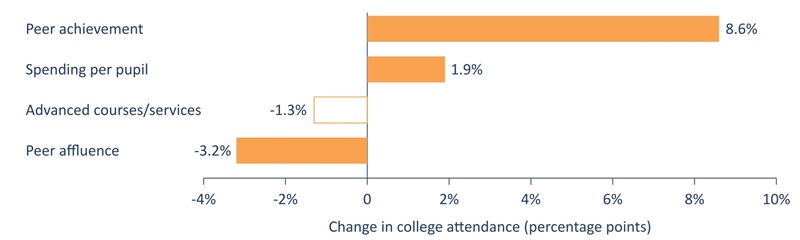
The academic achievement of HALO students’ peers is the strongest predictor of districts’ and high schools’ college-going value-added—far more predictive than common measures of district- and school-wide poverty rates or per-pupil spending. Going from a district where the average third-grade student tests at the fiftieth percentile to one where the average student tests at the sixtieth percentile (an increase of approximately one standard deviation) corresponds to a 3.5-percentage-point increase in the probability that a third-grade HALO student in the district will go on to attend a four-year college or university. Similarly, going from a high school where the average student tests at the fiftieth percentile to one where the average student tests at approximately the sixtieth percentile corresponds to an 8.6-percentage-point increase in the probability that a HALO student at the high school (identified in eighth grade) will go on to attend a four-year college. Consequently, the Ohio districts and high schools that provide the best pipelines to college for HALO students are predominantly (but not exclusively) located in high-achieving suburbs. (See here and here for lists of districts and high schools with the highest college-going value-added.)
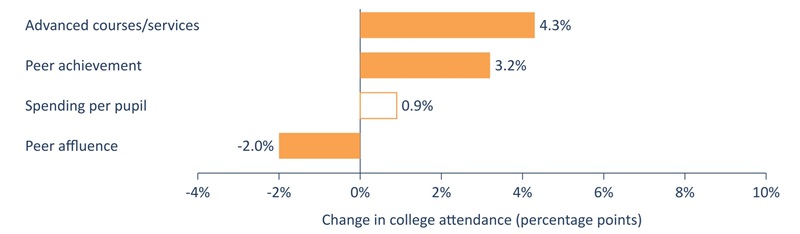
Rates of student participation in advanced coursework are the strongest predictors of whether districts and high schools get their HALO students into top colleges and universities—more predictive than peer achievement and far more predictive than common measures of district or school poverty and spending per pupil. High schools that feature greater participation in advanced coursework and gifted services (one standard deviation greater than average) are associated with an increase of 4.3 percentage points in the probability that a HALO student (identified in eighth grade) will attend a top college or university (one where the average student scored in the top 20 percent on college admissions exams). Participation in AP coursework drives this result, as opposed to rates of participation in College Credit Plus or gifted services in English language arts or math while in high school. Notably, 40 percent of the gap in AP course–taking between HALO students and wealthier high-achieving students is attributable to these students residing in different districts, as opposed to HALO students and wealthier high-achieving peers in the same district taking different coursework.
Finally, comparing HALO students who took advanced coursework or received gifted services with similar HALO students who did not, the analysis reveals major differences in college-going:
Taking AP courses in high school is most predictive of college-going, but other dual-credit options also appear to benefit HALO students. HALO students (identified in eighth grade) who took at least one AP course in high school have a college-going rate twenty-nine percentage points greater than similar HALO students who did not take at least one AP course. Their matriculation rate for top colleges and universities is sixteen percentage points higher. The corresponding estimates for College Credit Plus (CCP) are, respectively, twenty-four and eight percentage points. Thus, HALO students who participate in CCP are substantially more likely to attend a four-year college but only half as likely as those who take AP coursework when it comes to getting into top colleges and universities.
Taking advanced math courses in middle school is more predictive of college-going than receiving gifted services, but the results suggest that both benefit HALO students. HALO students (identified in third grade) who took at least one high school–level math course in grades six through eight (mostly algebra) have rates of college-going eighteen percentage points higher (six percentage points for top colleges) than similar students who did not take advanced math. Those who received gifted services in English language arts or math in those grades have college-going rates six percentage points higher (four percentage points for top colleges).
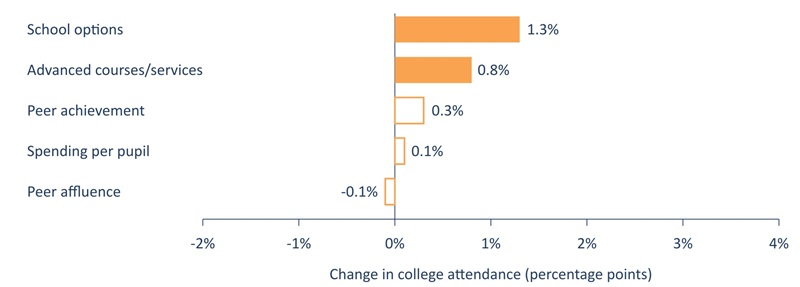
The results suggest that Ohio could better support its high-achieving low-income students by expanding their access to advanced coursework and high-achieving peers throughout the K–12 pipeline. Early interventions, so that students are ready to enroll in algebra by eighth grade and to enroll in AP coursework during high school, appear to be effective pathways to get HALO students into top colleges and universities. Expanding students’ schooling options, such as establishing selective-enrollment magnet schools and increasing districts’ participation in Ohio’s open enrollment program, could help families and schools overcome resource constraints that prevent them from providing HALO students with advanced coursework and access to high-achieving peers. Indeed, selective high schools located in city districts are some of Ohio’s most effective at getting HALO students into college. Offering families more help in navigating these and other school options, such as Ohio’s Educational Choice Scholarship Program (EdChoice), would likely further enhance their benefits.
HALO Students and College-Going: What Research Tells Us
Research indicates that the rapid growth in U.S. postsecondary education during the twentieth century increased incomes while reducing socioeconomic inequality. The college-going wage premium—the difference in income between those who attend at least one year of college and those who do not—remains substantial, but it no longer benefits low- and high-income students equally.[6] By the end of the twentieth century, the premium had increased for high-income students while shrinking for low-income students—what Zachary Bleemer and Sarah Quincy (2025) call “collegiate regressivity.”[7] Their analysis indicates that 80 percent of collegiate regressivity is due to low-income students disproportionately selecting into community and for-profit colleges, the divergence in quality between research-based universities and the teaching-focused colleges where low-income students tend to enroll, and higher-income students shifting their studies toward computer science and engineering.
That high-achieving students—whether rich or poor—might fail to attend and graduate from a high-quality postsecondary institution harms us all. The best available research indicates that human capital—individuals’ productive capacity—explains at least half of income differences across countries, that schooling is effective at developing human capital, and that today’s labor market increasingly favors higher-order thinking skills, such as problem-solving.[8] Research suggests that the college wage premium doubles throughout graduates’ careers because college is a gateway for individuals with strong cognitive skills to access nonroutine occupations associated with high wage growth.[9] Evidence also indicates that universities play an important role in delivering general economic benefits by developing students’ productive capacities and generating innovations that benefit their communities.[10] Failing to capitalize on the talents and potential of high-achieving students has an especially negative impact, as their forgone lifetime income is greater and society misses out on more economic growth.
Some barriers to HALO students’ college-going are easier to address than others. As James Coleman concluded decades ago, families’ socioeconomic circumstances have a large impact on their children’s performance in school, as does the performance of their peers.[11] For example, disruptive peers have been shown to have substantial negative impacts on students’ college-going and future earnings.[12] In a recent study using exceptionally rich data, economist Raj Chetty and his colleagues determined that kids’ economic connectedness—the extent to which low-income kids interact with higher-income kids—is a strong predictor of whether low-income kids improve their economic standing down the road.[13] They also find that schooling is a determinant of economic mobility for low-income students in part because schools facilitate connectedness between low- and high-income students.[14] Thus, a serious analysis of the postsecondary pipeline for HALO students must consider the potential impact of their residential and school peers.
By third grade—the starting point of our analysis below—socioeconomic inequalities are largely baked into student achievement.[15] And rigorous research indicates that increased spending on schools has, on average, a modest impact on student achievement and attainment.[16] Yet schooling, including how money is spent on it, matters a great deal after third grade. For example, there is strong evidence that providing AP coursework causes increased college attendance and success.[17] This is consistent with a larger body of research documenting that AP coursework and, to a lesser extent, dual-enrollment options are highly predictive of college-going.[18] Research also indicates that the entire pipeline of coursework, back to elementary school, can affect college-going.[19] For example, taking algebra in eighth grade can substantially increase the probability that students take and succeed in advanced math coursework in high school, provided that they are sufficiently high-achieving students at the end of seventh grade.[20]
Preparing HALO students to participate in this advanced coursework is a significant challenge, as one must contend with some of the broader social forces noted above. But research also demonstrates that much can be gained by simply providing options and advising students and parents. For example, recent randomized controlled trials—the “gold standard” for estimating causal effects—have demonstrated that advising low-income high-school students to enroll in higher-quality colleges and universities can significantly increase their bachelor’s degree attainment.[21] Such advising decisions work further down the pipeline, as well, such as when schools directly enroll high-achieving seventh graders into eighth-grade algebra.[22]
When schools lack the capacity to provide the requisite coursework, instructors, and advising, HALO students could benefit from options such as selective magnet schools, private schools, or schools in another district. For example, research has demonstrated that charter schools and private-school vouchers can yield substantial educational benefits for low-income students, in terms of both achievement and attainment.[23] Importantly, these studies indicate that such benefits can accrue to both the students using those options and, via competitive effects, the students who remain in district schools. Rigorous studies of selective exam schools have often found null impacts on student test scores, but recent research suggests that may be because such schools are delivering educational benefits on dimensions not captured by tests.[24] That also appears to be the case with other school options, as evidenced by a recent study documenting higher rates of college-going among students who participated in Ohio’s EdChoice private-school scholarship program than among similar students who did not participate in the program.[25]
This literature review shows several paths through which communities and schools might affect the college-going of HALO students after third grade. The analysis below considers most of the above factors to some extent when examining the district- and school-level predictors of HALO students’ pursuit of higher education at four-year colleges and universities. It explicitly accounts for broader social forces that affect both school and home life (the affluence and achievement of students’ residential district and school peers), public investments in schools (spending per pupil), access to alternative schooling options that might better match students’ needs and generate competitive effects (student enrollment in charter schools and eligibility for private-school vouchers), and school inputs such as advanced coursework and services for students identified as gifted. Importantly, the focus is on factors that lead students to attend four-year colleges and universities—especially top colleges that serve similarly talented students—as research indicates that these institutions are most likely to help HALO students reach their academic potential.
A Descriptive Look at Ohio’s HALO Students
The analysis begins with a look at the attributes and education trajectories of low-income students in Ohio who were high-achieving third graders between the 2008–09 and 2013–14 school years. It compares their attributes and education trajectories with those of the average Ohio student, as well as those of similarly high-achieving but wealthier students. Consistent with past Ohio research—and to ensure the sample of students is large enough to conduct the analysis that follows—“high-achieving student” is defined as one whose average score on Ohio’s third-grade tests in English language arts (ELA) and mathematics was in the top 20 percent statewide.[26] Whether students were eligible for free or reduced-price lunches during that third-grade year serves as a proxy for income to identify whether students are high-achieving low-income (HALO) or high-achieving high-income (HAHI).[27] The analysis uses third grade as the baseline because that is the earliest point of the public-school pipeline for which student achievement data are available.
Baseline Characteristics of Ohio’s HALO Students
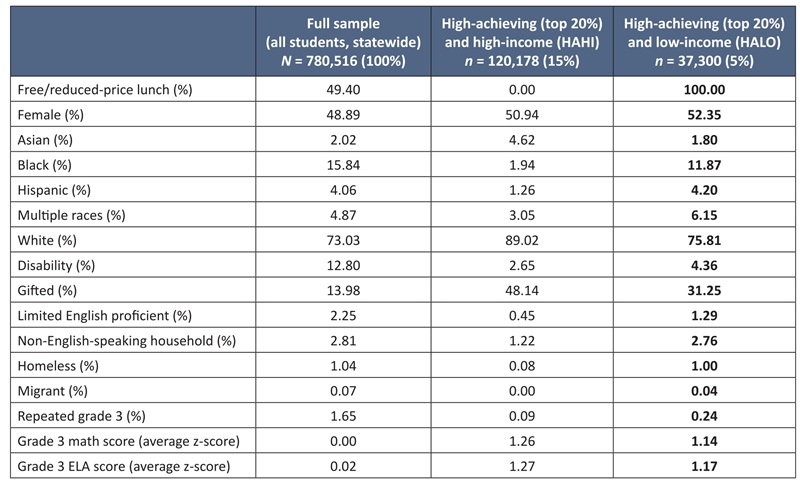
Table 1 reveals that only 25 percent of Ohio’s high-achieving third graders are low-income (5 of the top 20 percent) and that HALO students are approximately five times more likely to be Black or Hispanic than their wealthier high-achieving peers. Put differently, by third grade, academic achievement already diverges significantly by students’ household income and race. These results are not surprising, as research has long demonstrated that education gaps by income and race have largely set in by third grade. Thus, the analysis in this report is about what benefits a HALO student’s residential district or high school might provide after family, community, and schooling environments have significantly shaped their early childhood development. It does not address how earlier interventions might boost the proportion of low-income kids who are high-achieving third graders.
Table 1. Characteristics of HALO and Other Students in Third Grade between 2008–09 and 2013–14
Note: The table presents descriptive statistics for students in grade 3 between 2008–09 and 2013–14 who had at least one grade-3 test score. All variables are observed in grade 3 unless otherwise noted, and all are reported as a percentage of total students in the respective column/sample (unless “z-score” is noted). Missing values are coded zero.
Table 1 also indicates that HALO students’ test scores in grade 3 are 10–20 percent of a standard deviation lower than that of their higher-income peers (1.1 and 1.2 standard deviations above the average math and ELA score, respectively, as opposed to 1.3 standard deviations above the average score). This difference in achievement might appear to explain their being identified as “gifted” (in any area) at significantly lower rates (31 percent compared with 48 percent).[28] However, as the analysis below demonstrates, the differences in baseline test scores between HALO and HAHI students are not sufficiently great to account for significant differences in these students’ current and future schooling experiences.
A Leaky Pipeline: College-Going Among Ohio’s HALO Students
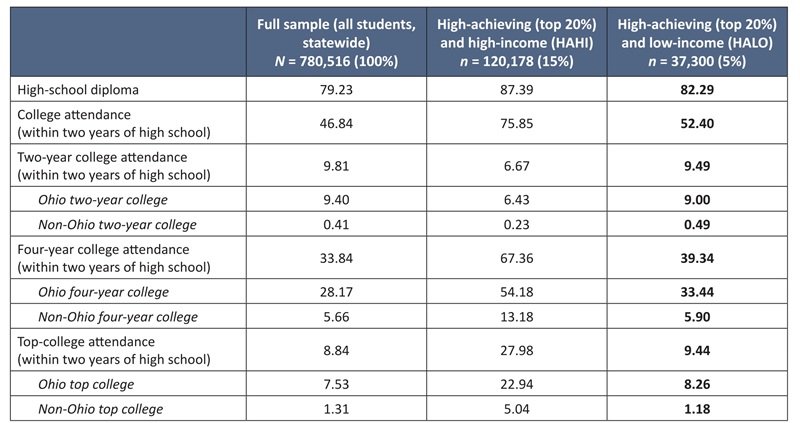
Table 2 provides comparisons like those in Table 1 but focuses on measures of students’ future educational attainment. It indicates that the HALO students identified above are only somewhat less likely than their wealthier peers to receive a high-school diploma (82 percent compared with 87 percent) but are far less likely to attend college (two- or four-year) within two years of graduating high school (52 percent compared with 76 percent). HALO students’ rates of college attendance are only marginally greater than those of the average Ohio student. Note that these percentages understate college-going rates because of data limitations (for example, students exiting public schools after third grade would be identified as not having graduated or attended college), but they nonetheless illustrate the disparities between HALO students and their wealthier peers.[29]
Table 2. Educational Attainment of HALO Students and Other Students (Grade 3 Cohorts from 2008–09 to 2013–14)
Note: The table presents educational attainment rates for students who were in grade 3 between 2008–09 and 2013–14 (and who had at least one grade-3 test score). All statistics are reported as a percentage of total students in the respective column/sample. Missing values are coded zero. A “top college” is defined as one whose average student tested in the top 20 percent of the sample on the ACT or SAT between 2016 and 2019. That captures approximately the top 25 percent of the national distribution (scores of approximately 25 or above on the ACT and 1200 or above on the SAT). Note that the data miss students who dropped out or left Ohio prior to grade 9, as NSC data are matched based on grade-9 cohorts. That’s why Ohio’s overall high-school graduation rate is listed as only 79%.
Comparing overall rates of college-going understates the severity of the situation, however. HALO students have the academic potential to excel at top four-year colleges, which this study defines as those where incoming classes have average ACT and SAT scores in the top 20 percent of the Ohio score distribution.[30] Although HALO students are twenty-four percentage points less likely to attend any college than their wealthier high-achieving peers (a rate of college-going that is 31 percent lower than HAHI students’ rate), they are twenty-eight percentage points less likely to attend a four-year college (a rate that is 42 percent lower) and nineteen percentage points less likely to attend a top college (a rate that is 66 percent lower) than their wealthier peers.
In other words, HALO students’ college-going rates fall increasingly short as a percentage of the rate of their wealthier peers as the degree level (two-year versus four-year) and selectivity increase. The statistics in Table 2 imply that if HALO students’ college-going rates matched those of their peers from wealthier households, 1,742 more HALO students would enroll in a four-year college every year—and 1,153 of those students would enroll in a top college or university.
Another way to characterize this “leak” in the public-school pipeline to college is to consider differences in student counts, as one can then consider how overrepresented one group is over another at each attainment level. The third column of Table 3 (below) reveals that wealthier high-achieving students outnumber HALO students 3-to-1 in third grade, but HALO students are later outnumbered nearly 6-to-1 at four-year colleges and nearly 10-to-1 at top colleges. In other words, the greater the postsecondary attainment level—two-year, four-year, or top college, in that order—the greater the extent to which HALO students’ wealthier peers outnumber them.
Table 3. Educational Attainment of HALO Students and Other Students (Grade 3 Cohorts from 2008–09 to 2013–14)
Note: The table presents counts of students who were in grade 3 between 2008–09 and 2013–14 (and who had at least one grade-3 test score) who data indicate attained each education level. A “top college” is defined as one whose average student tested in the top 20 percent of the sample on the ACT or SAT between 2016 and 2019. That captures approximately the top 25 percent of the national distribution (scores of approximately 25 or above on the ACT and 1200 or above on the SAT). Note that the data miss students who dropped out or left Ohio prior to grade 9, as NSC data are matched based on grade-9 cohorts.
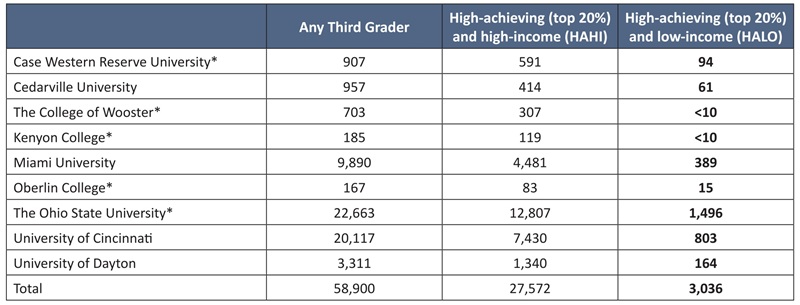
The tables above also indicate that HALO students are more likely to attend college within Ohio than their wealthier high-achieving peers—which is to be expected, given the costs associated with higher education. Table 4 (below) provides more information on the top Ohio colleges and universities that HALO students attend. It indicates that 58,900 of the 780,516 public-school students in third grade between 2008–09 and 2013–14 ultimately attended top Ohio colleges and universities. The table illustrates that HALO students are heavily outnumbered at all of Ohio’s top colleges and universities and that 75 percent of HALO students (2,299 of 3,036) attend the main campuses of just two schools: The Ohio State University and the University of Cincinnati.
Table 4. Attendance at Top Ohio Colleges (Grade 3 Cohorts from 2008–09 to 2013–14)
Note: The table presents counts of third graders between 2008–09 and 2013–14 (who had at least one grade-3 test score) observed in top Ohio colleges and universities. A “top college” is defined as one whose average student tested in the top 20 percent of the sample on the ACT or SAT between 2016 and 2019. That captures approximately the top 25 percent of the national distribution (scores of approximately 25 or above on the ACT and 1200 or above on the SAT). Asterisks indicate schools that have admission rates below 60 percent.
Potential Source of the Leak: Advanced Coursework and Gifted Services
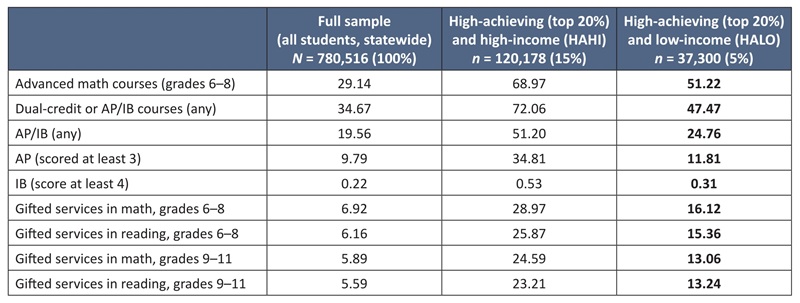
HALO students’ rates of participation in advanced coursework and gifted services provide some suggestive evidence of how schools may be contributing to the leaky public-school pipeline described above. Table 5 indicates that HALO students’ enrollment in high school–level math courses (primarily algebra) while in middle school is eighteen percentage points lower than the enrollment rate of their wealthier peers. The divergence in advanced coursework is even greater in later grades. The rate at which HALO students enroll in AP, IB, or other dual-credit college courses (as part of Ohio’s CCP program) while in high school is twenty-five percentage points (34 percent) lower than the rate of their wealthier high-achieving peers. And HALO students are approximately twelve percentage points (44 percent) less likely to receive gifted services in English language arts or math in middle school or high school.[31] These statistics imply that if HALO students took advanced coursework at the same rate as their wealthier high-achieving peers, then 1,103 more HALO students in a given third-grade cohort would ultimately take high school–level math courses during middle school and 1,644 more HALO students would take at least one AP course in high school.
Table 5. Courses Taken by HALO Students and Other Students as Percentages of the Respective Samples (Grade 3 Cohorts from 2008–09 to 2013–14)
Note: The table presents curriculum data for students who were in grade 3 between 2008–09 and 2013–14 (and who had at least one grade-3 test score). Specifically, the table reports the percentage of students in each sample (full, HAHI, and HALO) who took at least one course, obtained the relevant score at least once, or ever received the corresponding service for gifted students. All statistics are reported as a percentage of total students in the respective column/sample. Missing values are coded zero.
HALO Students’ Districts of Residence and College-Going
This portion of the analysis examines how much the districts where HALO students live affect their probability of attending college. Focusing on where students live, as opposed to which schools they attend, has several benefits. First, one can consider the broader ecosystem that influences third graders’ future college-going, beyond school-specific inputs. Factors include the affluence and academic performance of their residential peers and the availability of publicly funded school options beyond district schools. For example, charter schools affect the educational outcomes of students who attend them, of course, but they also affect students attending traditional district schools that must compete with these alternatives.
A second benefit of focusing on HALO third graders’ district of residence is that doing so makes it straightforward to analyze the factors that predict college-going. The elementary schools students attend vary significantly in terms of grades served and governance structures, making it difficult to identify a broad set of comparable metrics and to attribute college-going to particular schools. For example, some students attend K–4 schools that could influence their future trajectories for just one more year, whereas others attend K–12 schools that could shape their futures straight through to graduation. But all third-grade HALO students reside in districts that serve students through twelfth grade.
The analysis below uses statistical estimates of “college-going value-added” to characterize districts’ impacts on the probability that HALO students attend college. These estimates capture the extent to which students in a district exceed (or fall short of) average rates of college attendance for students with similar characteristics. Generating these estimates first requires calculating for each student their expected probability of attending college based on their third-grade achievement levels and attributes such as parents’ income level, sex, race, and whether they were identified as gifted, homeless, a migrant, residing in a non-English-speaking household, having repeated third grade, having an individualized education plan (IEP), or having limited English proficiency. Then, for each district, one calculates the difference between the actual rate of college-going for those students and the expected (average) rate of college-going for students with similar characteristics.[32] The analysis focuses on attendance at any four-year college and, in particular, more selective top colleges, as these are institutions that HALO students have the academic potential to attend and that would likely best enable them to realize their potential.[33]
Note that the analysis below is primarily concerned with identifying district-level factors—including those related to peer characteristics, school spending, and the availability of advanced coursework and gifted services—that predict the extent to which a district’s HALO students attend college (relative to expectations based on averages for students with similar characteristics). This portion of the analysis is thus about assessing how the broader ecosystem in a HALO student’s district of residence predicts their college-going, as opposed to estimating the causal impact of the specific schools they attend or the coursework they take. Analyses in subsequent sections of this report consider the impact of schools and coursework more directly.
Districts’ College-Going Value-Added for HALO students
Before examining patterns in the college-going value-added of residential school districts across Ohio, there are some important facts to consider about the value-added estimates. First, the value-added of districts in which students reside explains to a significant degree the gap in college-going between HALO students and their wealthier high-achieving peers. Most notably, 37 percent of the gap in attendance at top colleges between HALO students and their wealthier high-achieving peers is attributable to these students residing in different districts, as opposed to HALO students and their wealthier high-achieving peers in the same district attending college at different rates.[34] In short, the district in which students reside appears to matter considerably—particularly when it comes to attending top colleges and universities.
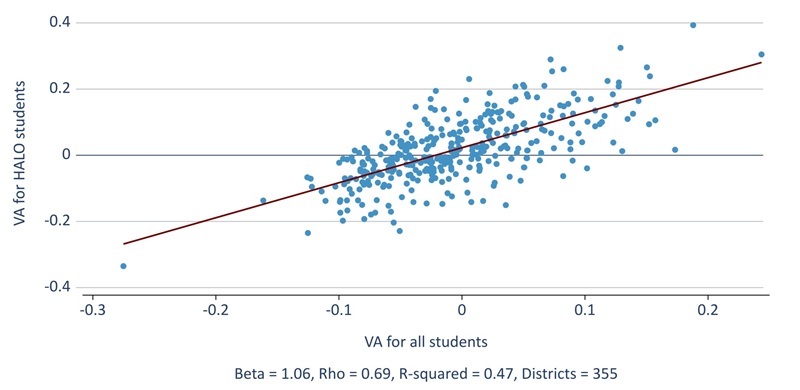
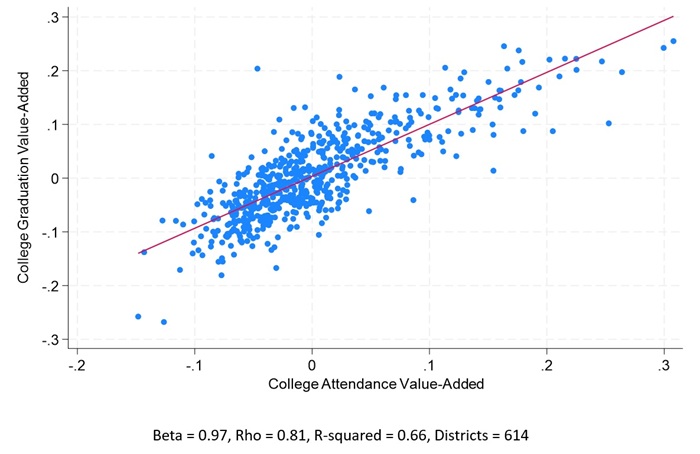
Second, college-going value-added estimates reveal that districts that serve as effective pipelines for Ohio’s average student also serve as effective pipelines for HALO students. Figure 1 plots districts’ college-going value-added for HALO students against their value-added for all students, focusing on the 355 (of 615) Ohio districts in which at least ten HALO students resided while in grade 3 from 2008–09 through 2013–14.
Figure 1. HALO College-Going Value-Added (VA) and Overall College-Going VA (Grade 3 Cohorts from 2008–09 to 2013–14)
Note: The figure presents the relationship between districts’ four-year college–going value-added for HALO students (the y-axis) and college-going value-added for all district students (the x-axis). The figure plots this relationship for the 355 districts that had at least ten HALO students in grade 3 between 2008–09 and 2013–14.
The figure reveals that districts where the average student’s probability of attending a four-year college is ten percentage points above expectations (0.10) are those where, on average, HALO students’ probability of attending college will also be approximately ten percentage points above expectations based on their grade-3 characteristics (the slope, beta, is just about 1.0). The correlation coefficient is 0.69, just below the cutoff of 0.7 often used to characterize a statistical relationship as “strong.” Put differently, the R-squared coefficient indicates that a district’s college-going value-added for the average student “explains” 47 percent of the variation in its college-going value-added for HALO students. That districts that are effective postsecondary pipelines for the average student also tend to be effective for HALO students is important, as the value-added measures based on all students are more precise and available across all Ohio districts (in other words, even if they educate fewer than ten HALO students). On the other hand, as the analysis below indicates, the districts and schools that provide the biggest boost to HALO students have distinguishing characteristics—particularly when it comes to getting them into top colleges and universities.
SIDEBAR 1: Link Between Test-Score Value-Added and College-Going Value-Added
Most education research focuses on schools’ impacts on student test scores. One potential concern is that districts’ and schools’ test-score value-added does not correspond to their college-going value-added. After all, although schools may be able to impart cognitive skills captured by test scores, they may not impart “non-cognitive” behavioral skills necessary for college attendance and graduation. For example, a recent analysis using a rigorous design found that participation in gifted programming increased rates of college-going among disadvantaged boys with high cognitive ability. It appears to have done so by improving their non-cognitive skills (as evidenced by their course-taking and grades) while having no impact on their test scores.[35] On the other hand, studies have shown that schools’ impact on student test scores (as measured by test-score value-added) is a relatively strong predictor of college enrollment.[36]
Estimating districts’ and high schools’ test-score value-added involves the same procedure as estimating their college-going value-added, except that the outcome of interest is a test score from (near) the end of a student’s K–12 schooling experience, as opposed to their college-going. For districts, one first estimates students’ expected end-of-schooling test scores based on the average for students with similar third-grade test scores and other attributes. The estimated district test-score value-added is the difference between their actual score average and the expected score average. The procedure is the same for high schools, except that student characteristics in eighth grade are used to generate expectations based on averages for similar students. To capture as much K–12 schooling as possible, the analysis here focuses on districts’ test-score value-added on the ACT or SAT. Students primarily take these tests in eleventh grade, and there is solid coverage across Ohio students.[37]
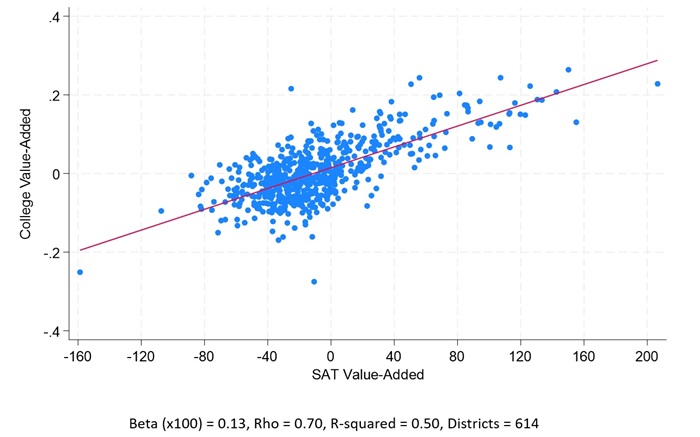
Figure S1 (below) illustrates the correlation between districts’ test-score value-added on the ACT or SAT—reported on an SAT scale, such that the highest possible score on the exam is 1600. The figure indicates a strong relationship between a district’s estimated value-added for college-going and its estimated value-added with respect to college admissions exams. Specifically, it indicates that a 100-point increase in a district’s SAT value-added corresponds to an increase of thirteen percentage points in its college-going value-added for four-year colleges.[38]
Figure S1. College-Going Value-Added Versus SAT/ACT Value-Added (SAT Scale)
Note: The figure presents the relationship between districts’ value-added with respect to their students’ college attendance (any four-year institution) and their value-added with respect to students’ SAT or ACT scores (on an SAT scale). The estimates are based on grade-3 cohorts between 2008–09 and 2013–14. The red line is the line of best fit. Beta is the slope of this line times 100. Rho is the correlation coefficient. And R-squared is the percentage of variation in graduation value-added explained by attendance value-added.
The correlation is similar but not quite so strong if one estimates value-added using Ohio’s eighth-grade math or ELA tests or end-of-course exams in algebra (primarily ninth grade) or ELA 2 (primarily tenth grade). The results are similar when the focus is on the value-added of high schools.
District Attributes That Predict College-Going Value-Added for HALO Students
The research reviewed earlier in this report summarized the range of factors that might bear on HALO students’ education and life outcomes, including the socioeconomic factors affecting them in and out of school and the quality of their school options. The analysis in this section examines the predictive value of such factors—including peer affluence, peer achievement, district spending, the availability of advanced coursework and services, and the availability of alternative schooling options, including charters and private-school vouchers—using reasonable (though imperfect) proxies captured at the district level at the time students were in third grade (2008–09 to 2013–14). In other words, these variables should capture the district conditions at the third-grade baseline and do not measure students’ actual experiences as they progressed through school. That is why these factors are characterized as district-level “predictors” of students’ future college-going (net of expectations based on students’ characteristics).
The district-level predictors include the standardized fraction of students residing in a district who are not eligible for free or reduced-price lunches (“peer affluence”)[39]; the standardized average of third-grade test scores among students residing in the district (“peer achievement”); the standardized spending per pupil in district schools; the average of the standardized fraction of students enrolled in charter schools and the standardized fraction of students eligible for private-school vouchers (“school options”); and the average of the standardized fraction of students taking high-school math courses in grades 6–8 and the standardized fraction of students receiving gifted services in ELA or math in any grade (“advanced courses and services”). These variables are standardized so that the magnitudes of their relationships to district value-added are directly comparable in each figure below (but not between figures). The relationships between these district-level attributes and residential districts’ value-added is estimated using basic regression models that include all attributes at once, such that the estimate for any given attribute is based on holding the others constant.[40]
Figure 2 (below) presents the estimates with respect to value-added at four-year colleges and universities. It reveals that peer achievement is by far the strongest predictor of college-going value-added for HALO students. Going from an average district to one with test scores one standard deviation above average (equivalent to a district’s average student going from approximately the fiftieth percentile to approximately the sixtieth percentile on the third-grade test-score distribution) corresponds to a 3.5-percentage-point increase in the probability that district students attended a four-year college within two years of graduating high school.[41] Notably, spending per pupil, peer affluence, the proportion of district students taking advanced math courses or receiving gifted services in ELA or math, and the availability of school options have no statistically significant predictive value.[42] In other words, having high-achieving peers—and the family, community, and school factors that contributed to their high achievement leading up to third grade—appear to have outsize effects on students’ future college-going.
Figure 2. Predictors of Districts’ Value-Added for Four-Year Colleges
Note: The figure presents the relationship between baseline characteristics of students’ districts of residence (observed while students were in third grade, between 2008–09 and 2013–14) and districts’ value-added in the probability that their residents attend a four-year college. The estimates are from a single ordinary least squares (OLS) regression model that includes standardized versions of all five predictors (i.e., they each have a mean of 0 and a standard deviation of 1). The horizontal bars in each figure capture the changes in district value-added as a rate. For example, a value of 2 percent means that a one-standard-deviation increase in the predictor corresponds to a two-percentage-point increase in the probability that district students attended a four-year college or university. Solid bars indicate that the estimates are statistically significant at the 5 percent level for a two-tailed test.
The predictive value of achievement is similar whether or not one controls for the other factors. It’s important to note, however, that the results in Figure 2 are partly attributable to the analysis’s putting more weight on districts that enroll more HALO students. Consistent with research reviewed earlier in this report, the primary predictor of college-going value-added for the average Ohio student is the affluence of residential peers—that is, the percentage of students who do not qualify for free or reduced-price lunches—with peer achievement as the second-strongest predictor (see Table D2 in Appendix D). The divergence in results could be because peer affluence does not alter HALO students’ probability of college attendance after third grade (which is what Figure 2 implies, although it may still play a significant role in driving peers’ third-grade achievement). But it could also be because the measure of peer affluence does not vary sufficiently among the districts that HALO students attend, meaning there is relatively little opportunity to observe its effects. Relatedly, peer affluence is not measured as precisely as peer achievement. There is significant variation in household income even among students who qualify for free meals, and this unmeasured variation could in fact matter for HALO students.
What one can say is that based on available data and an analysis focused on altering HALO students’ college trajectory after third grade, peer achievement is the strongest predictor of college-going value-added across the districts where HALO students are concentrated. One can reasonably conclude, therefore, that whether district peers are high-achieving is the best predictor of whether a HALO student’s district will serve as an effective pipeline to a four-year college. But there is also good reason to suspect—based on past research and the analysis of college-going for the average Ohio student—that HALO students would also benefit from residing in districts with wealthier peers for reasons other than their achievement level.
Figure 3 (below) presents the results of a similar analysis but focuses on attendance at top colleges—the outcome for which a student’s district of residence (or attendance) most greatly influences the gap in college-going between HALO students and their wealthier high-achieving counterparts (see prior subsection of this report).[43] Notably, peer achievement is no longer a significant predictor of college-going value-added. Figure 3 reveals that when one focuses on HALO students attending top colleges, the significant predictors are the availability of and participation in alternative schooling options and coursework or services for advanced students.
Figure 3. Predictors of Districts’ Value-Added for Top Colleges
Note: The figure presents the relationship between baseline characteristics of students’ districts of residence (observed while students were in third grade, between 2008–09 and 2013–14) and districts’ value-added in the probability that their residents attend a top four-year college. A “top college” is defined as one whose average student tested in the top 20 percent of our sample on the ACT or SAT between 2016 and 2019. That captures approximately the top 25 percent of the national distribution (scores of approximately 25 on the ACT and 1200 on the SAT). The estimates are from a single OLS regression model that includes standardized versions of all five predictors (i.e., they each have a mean of 0 and a standard deviation of 1). The horizontal bars in each figure capture the changes in district value-added as a rate. For example, a value of 2 percent means that a one-standard-deviation increase in the predictor corresponds to a two-percentage-point increase in the probability that district students attended a top four-year college or university. Solid bars indicate that the estimates are statistically significant at the 5 percent level for a two-tailed test.
Specifically, the results in Figure 3 indicate that a one-standard-deviation increase in the proportion of district students attending charter schools or eligible for private-school vouchers corresponds to a 1.3-percentage-point increase in the probability that a district’s students attend a top college within two years of graduating high school. The results also indicate that students in districts with higher rates of enrollment in gifted services in ELA and math or in advanced math coursework in grades 6–8 have a 0.8-percentage-point higher probability of attending a top college. Note that disaggregating the impacts of advanced math coursework and gifted services (which often consists of advanced coursework), as well as charter school enrollments and rates of voucher eligibility, reveals that these results are driven primarily by rates of charter school attendance and gifted service provision (see Table D3 in Appendix D). The average attendance rate at a top college is 9 percent for HALO students, so the combined “impact” of a one-standard-deviation increase in school options, advanced math coursework, and gifted services (1.3 plus 0.8, a 2.1-percentage-point increase) is a 24 percent increase in the probability that HALO students residing in a district attend a top college.
One cannot directly compare the estimates in Figure 2 and Figure 3, as they are based on different effective samples of students.[44] For example, the analysis of value-added for top colleges puts more emphasis on data for HALO students who reside among higher-achieving peers, as those are the students for whom we can most reliability estimate top-college attendance. What one can take away from Figure 3 is that, among districts for which we have relatively reliable measures of top-college-going value-added, those that have more school options and provide more advanced coursework and gifted services are more successful at getting their HALO students to attend top colleges.
Once again, it is worth noting that for the average Ohio student, the affluence of district students is the strongest predictor of whether they attend a top college, just as it is the strongest predictor of whether a student attends a four-year college. In other words, the results suggest that even after third grade, the affluence of a student’s residential peers can significantly alter that student’s schooling trajectory. That is also the case for HALO students if one does not put greater weight on value-added estimates that are more reliable (see Table D5 in Appendix D). What the analyses in figures 2 and 3 tell us, though, is that when one focuses on the best available data on HALO students’ college-going—based on where HALO students tend to reside—the average achievement of their peers is the primary predictor of whether they attend a four-year college, and the availability of alternative schooling options, advanced coursework, and gifted services are the best predictors of whether they get into top colleges. The analysis of high schools (below) provides an informative test of the robustness of these results.
A Closer Look at Districts’ College-Going Value-Added for HALO Students
The predictors identified above provide a general portrait of the characteristics of districts where HALO students are most likely to realize their potential. The analysis here adds to this portrait by illustrating how districts with varying levels of college-going value-added are distributed across the state, and it identifies (and lists the value-added estimates for) the twenty-five Ohio districts that provide the most opportunity for HALO students. Doing so requires adjusting the value-added estimates for statistical uncertainty. Appendix C describes the procedure for generating these empirical Bayes estimates. Note that, like the previous analysis above, this analysis includes only those districts that educated at least ten HALO students between the 2008–09 and 2013–14 school years.
Figure 4 (below) presents a pair of heat maps that illustrate the geographic distribution of district value-added for HALO students—providing a visual look at the estimated quality of public-school pipelines for recent HALO students across Ohio. The maps yield a couple of patterns. First, district value-added for HALO students’ attendance at four-year colleges and universities (panel a) seems relatively stronger in suburbs surrounding (but not including) large urban districts—particularly near Cleveland and Akron and, to a lesser extent, Columbus, Cincinnati, Toledo, and Youngstown. But the pattern is fuzzy, and there are significant clusters of high-value-added districts in some remote areas.
Figure 4. Districts’ College-Going Value-Added for HALO Students
Note: The figures present the geographic distribution of college-going value-added for HALO students. Darker shades of blue indicate that HALO students residing in those districts have a higher probability of attending a four-year college (panel a) and a top college (panel b). Districts with fewer than ten HALO students in grade 3 between 2008–09 and 2013–14 are labeled “no data,” as these districts are least responsible for getting HALO students into college.
Second, district value-added for HALO students’ attendance at top colleges is highest in the Cincinnati and Dayton areas, followed by the Columbus and Cleveland areas, respectively. The clustering may be because of Cincinnati and Dayton’s proximity to top public universities in Ohio, including the University of Cincinnati, the University of Dayton, and Miami University. Research indicates that geographic proximity and lower tuition rates are big factors driving the enrollment of low-income students, and the public universities near Cincinnati and Dayton likely offer both to students in nearby districts.[45]
Table 6 (below) confirms the patterns in Figure 4. It presents the twenty-five districts with the highest average rank across the four-year and top-college-going value-added estimates (weighted equally). Twenty of the top twenty-five districts are suburban. Most have high-achieving and relatively affluent students, and none is in a city. There are a few exceptions, such as Winton Woods City School District, Waverly City School District, Bath Local Schools, and Union-Scioto Local School District, which provide a relatively strong pipeline for HALO students despite relatively high poverty rates. But these districts do not educate many of Ohio’s HALO students. Indeed, across six third-grade cohorts (from 2008–09 to 2013–14), only Dublin City School District, Fairfield City School District, and Pickerington Local School District educated over 100 HALO students—just twenty-six to twenty-eight HALO third graders per year in each of these three districts.
Table 7 (further below) presents the districts with the highest numbers of HALO third graders. It demonstrates that Ohio’s HALO students are most concentrated in large city and, to a lesser extent, suburban districts and that their rates of college-going are typically well below what one would expect based on their third-grade test scores and demographics. For example, the 1,346 HALO third graders in Columbus City Schools (approximately 225 per year from 2008–09 to 2013–14) attend four-year colleges at rates that are eighteen percentage points below the statewide average for other similar students. Residing in Cleveland, Cincinnati, or Toledo similarly impedes four-year college–going among HALO students—though, consistent with the map above, residing in Cincinnati or Dayton seems to have benefits when it comes to attending top colleges and universities.
Table 6. Districts with the Highest College-Going Value-Added for HALO Students
*/
/*-->*/
/*-->*/
/*-->*/
/*-->*/
Districts & HALO Context
Rank
District of Residence
HALO Third Graders (2009–2014)
College (4-year) VA
Top-College VA
NCES Locale
Test Scores (Grade 3)
Poverty (Grade 3)
Spending Per Pupil (TPS)
Adv. Math (G 6–8)
Gifted Services
Charters / EdChoice
1
Solon
33
0.23
0.08
Suburb
High
Low
High
High
High
No
2
Mason
47
0.12
0.11
Suburb
High
Low
High/Mod.
High
Low
No
3
Dublin
155
0.10
0.16
Suburb
High
Low
High
High
High
No
4
New Albany-Plain
16
0.10
0.09
Suburb
High
Low
High
High
High
Yes
5
Avon Lake
38
0.13
0.06
Suburb
High
Low
High/Mod.
High
High
No
6
North Canton
64
0.17
0.06
Suburb
High
Low
Mod./Low
Moderate
Moderate
No
7
Bay Village
19
0.26
0.05
Suburb
High
Low
High
Low
Mod./Low
No
8
Jackson
94
0.10
0.08
Suburb
High
Low
Low
High
High
No
9
Rocky River
17
0.15
0.06
Suburb
High
Low
High
High/Mod.
High
No
10
Fairfield
167
0.08
0.11
Suburb
Moderate
Mod./Low
Low
Mod./Low
High/Mod.
No
11
Winton Woods
84
0.09
0.10
Suburb
Low
High
High
Moderate
Mod./Low
No
12
Beachwood
14
0.10
0.07
Suburb
High
Low
High
High
Moderate
No
13
Pickerington
156
0.07
0.10
Suburb
High/Mod.
Low
Moderate
High
Moderate
Yes
14
Waverly
71
0.19
0.04
Town
Low
High
Mod./Low
High
High/Mod.
No
15
Bath
50
0.09
0.06
Suburb
Moderate
High/Mod.
Mod./Low
Mod./Low
Low
No
16
Springboro
34
0.08
0.06
Suburb
High
Low
Low
High
High
No
17
Revere
15
0.12
0.04
Rural
High
Low
High
High
High
No
18
Poland
12
0.19
0.03
Suburb
High/Mod.
Low
Mod./Low
Mod./Low
Mod./Low
No
19
Danbury
10
0.14
0.03
Town
Mod./Low
Moderate
High
High/Mod.
High
No
20
Union-Scioto
31
0.07
0.06
Town
Mod./Low
High/Mod.
Low
Mod./Low
Moderate
No
21
Perkins
39
0.18
0.03
Town
High/Mod.
Mod./Low
Moderate
High
Moderate
No
22
Aurora
12
0.09
0.04
Suburb
High
Low
High/Mod.
High/Mod.
High/Mod.
No
23
Westlake
55
0.05
0.09
Suburb
High
Low
High
High
High
Yes
24
Madeira
16
0.08
0.04
Suburb
High
Low
High
Mod./Low
High
No
25
Mayfield
44
0.09
0.04
Suburb
Moderate
Low
High
High
High
No
Note: The table lists the districts that most exceeded expectations in terms of the probability that their grade-3 residents would attend a four-year college or a top college (where students have an average score of approximately 25 or above on the ACT and 1200 or above on the SAT). Specifically, focusing on districts that had at least ten HALO residents attending public schools (including charters) in grade 3 between 2008–09 and 2013–14, it identifies districts with HALO college-going value-added estimates that rank among the top twenty-five statewide (i.e., those whose average ranking across both estimates puts them in the top twenty-five). The value-added estimates listed in the two columns next to district names indicate the increased probability of college attendance among HALO students. (For example, Bay Village City School District’s value-added of 0.26 indicates that the fraction of HALO students going to college was twenty-six percentage points greater than expected based on those HALO students’ grade-3 characteristics.) The remaining columns summarize district characteristics in those baseline years (2008–09 to 2013–14) when HALO residents were in third grade, summarizing how those districts stack up compared with other Ohio districts regarding the baseline achievement level of students in grade 3 (average test scores in ELA and math), the proportion of grade-3 students who qualify for free or reduced-price lunches (“poverty”), spending per pupil, the fraction of students in grades 6–8 who are enrolled in advanced math courses, and the fraction of students receiving gifted services in ELA or math. The possible categories are “high” (top 20 percent), “high/moderate” (sixtieth to eightieth percentiles), “moderate” (fortieth to sixtieth percentiles), “moderate/low” (twentieth to fortieth percentiles), and “low” (bottom 20 percent). “NCES” is an abbreviation for the National Center for Education Statistics. “TPS” is an abbreviation for traditional public schools, indicating that public school spending captures only that spent on district schools (not charter or state STEM schools).
Table 7. Districts with the Greatest Number of HALO Third Graders from 2008–09 to 2013–14
*/
/*-->*/
/*-->*/
/*-->*/
/*-->*/
Districts & HALO Context
Rank
District of Residence
HALO Third Graders (2009–2014)
College (4-year) VA
Top-College VA
NCES Locale
Test Scores (Grade 3)
Poverty (Grade 3)
Spending Per Pupil (TPS)
Adv. Math (G 6–8)
Gifted Services
Charters / EdChoice
1
Columbus
1,346
-0.18
-0.01
City
Low
High
High
Moderate
High/Mod.
Yes
2
Cleveland
1,322
-0.13
-0.02
City
Low
High
High
Low
Moderate
Yes
3
Akron
1,113
0.06
-0.04
City
Low
High
High
High/Mod.
Mod./Low
Yes
4
Cincinnati
866
-0.11
0.05
City
Low
High
High
High/Mod.
Mod./Low
Yes
5
Toledo
713
-0.15
-0.04
City
Low
High
High
Low
Low
Yes
6
South Western
565
-0.09
0.04
Suburb
Low
High
Moderate
Moderate
High/Mod.
Yes
7
Dayton
521
-0.09
0.03
City
Low
High
High
Low
Mod./Low
Yes
8
Westerville
289
-0.07
0.01
Suburb
High/Mod.
Mod./Low
High/Mod.
High/Mod.
High
Yes
9
Newark
282
-0.12
-0.04
Suburb
Mod./Low
High
Moderate
High/Mod.
Moderate
Yes
10
Parma
277
-0.01
0.01
Suburb
Mod./Low
Moderate
High
High/Mod.
Low
Yes
11
Hamilton
274
-0.04
0.04
Suburb
Low
High
Mod./Low
Low
High
Yes
12
Canton
264
-0.07
-0.03
City
Low
High
High
Moderate
Mod./Low
Yes
13
Youngstown
242
-0.09
0.00
City
Low
High
High
Mod./Low
Mod./Low
Yes
14
Kettering
236
-0.08
0.07
Suburb
High/Mod.
Moderate
High
High
Mod./Low
No
15
Elyria
230
-0.16
-0.04
City
Low
High
High/Mod.
Moderate
Moderate
Yes
16
Troy
222
-0.09
0.03
Suburb
High
High/Mod.
Moderate
Moderate
Moderate
No
17
Lorain
218
-0.11
0.04
Suburb
Low
High
High
Low
Moderate
Yes
18
Springfield
211
-0.06
0.03
City
Low
High
High
High
Mod./Low
Yes
19
Middletown
211
-0.04
0.01
Suburb
Low
High
High
Mod./Low
Mod./Low
Yes
20
Washington
202
-0.07
-0.07
City
Mod./Low
High
High
Low
High/Mod.
Yes
21
Lancaster
197
-0.06
-0.03
Town
Mod./Low
High/Mod.
Mod./Low
Mod./Low
High
No
22
West Clermont
195
-0.02
0.06
Suburb
Moderate
Moderate
Low
High
Mod./Low
No
23
Lakota
193
0.00
0.09
Suburb
High
Low
Mod./Low
Moderate
High
No
24
Huber Heights
193
-0.11
0.01
Suburb
Mod./Low
High/Mod.
High/Mod.
Mod./Low
Low
No
25
Northwest
190
0.00
0.06
Suburb
Low
High/Mod.
Mod./Low
High
High/Mod.
Yes
Note: The table lists the districts with the greatest number of grade-3 HALO students (from 2008–09 to 2013–14) included in the analysis. Once again, the list is restricted to districts that had at least ten HALO residents attending public schools (including charters) in grade 3 between 2008–09 and 2013–14, and the value-added estimates listed in the two columns next to district names indicate the increased probability of college attendance among HALO students. The remaining columns summarize district characteristics in those baseline years (2008–09 to 2013–14) when HALO residents were in third grade, summarizing how those districts stack up compared with other Ohio districts regarding the baseline achievement level of students in grade 3 (average test scores in ELA and math), the proportion of grade-3 students who qualify for free or reduced-price lunches (“poverty”), spending per pupil, the fraction of students in grades 6–8 who are enrolled in advanced math courses, and the fraction of students receiving gifted services in ELA or math. The possible categories are “high” (top 20 percent), “high/moderate” (sixtieth to eightieth percentiles), “moderate” (fortieth to sixtieth percentiles), “moderate/low” (twentieth to fortieth percentiles), and “low” (bottom 20 percent). “NCES” is an abbreviation for the National Center for Education Statistics. “TPS” is an abbreviation for traditional public schools, indicating that public school spending captures only that spent on district schools (not charter or state STEM schools).
SIDEBAR 2: The Strong Link Between College Attendance and Graduation
This report focuses on college attendance, not college completion. Ultimately, however, the goal is to get HALO students to graduate at higher rates. This report focuses on college attendance for two reasons. First, estimating value-added for college completion would severely limit the sample size. There are only two grade-3 cohorts for which there are college data five years after high-school graduation, and there is only one cohort with data six years after high-school graduation (a common cutoff used to calculate graduation rates). That leaves too few HALO students for the majority of Ohio districts.
Fortunately, districts whose students exceed expectations in their rates of college attendance are also the districts whose students exceed expectations in their college graduation rates. Figure S2 illustrates this relationship. It indicates that there is nearly a one-to-one relationship between attendance and graduation value-added. The correlation coefficient indicates a strong relationship (0.81), and the R-squared indicates that 66 percent of the variation in graduation value-added is explained by attendance value-added. The results using high schools are comparable, with a correlation coefficient of 0.76 and an R-squared of 0.58.
Figure S2. College-Going Value-Added Versus Graduation Value-Added
Note: The figure presents the relationship between districts’ value-added with respect to their students’ college attendance (“college-going value-added” in the main analysis) and their value-added with respect to students’ college graduation. The estimates are based on grade-3 cohorts in 2008–09 and 2009–10. The red line is the line of best fit. Beta is the slope of this line. Rho is the correlation coefficient. And R-squared is the percentage of variation in graduation value-added explained by attendance value-added.
HALO Students’ High Schools and College-Going
Focusing on high schools provides important advantages. First, the attrition issues with the district-level analysis of HALO students (because of students exiting public schools after third grade and not being matched to postsecondary data) are minimal because the analysis is limited to students linked to specific high schools in ninth grade. Ninth-grade cohorts are those that the Ohio Department of Education and Workforce matches to National Student Clearinghouse data, so there is less chance that a student is missed and incorrectly coded as not having attended college. A second advantage is that one can observe students’ entry into high schools, as a large majority of high schools have the same entry grade. Thus, unlike the district analysis—which awards districts no value-added credit for educational gains to which they contribute prior to grade 4 (grade 3 is the baseline for the value-added calculations)—one can generally examine students’ education trajectories before and after entering high school.
A third advantage of focusing on high schools is that one can estimate the impact of more immediate preparation for college, particularly via college-level coursework. Approximately 40 percent of the gap between HALO students’ AP course–taking and credit for Ohio’s public colleges (score of 3 or above) and those of HAHI students is attributable to these students residing in different districts.[46] However, data on AP and other high school coursework are unavailable for the 2008–09 to 2013–14 baseline years used in the district-level analysis. By setting a new grade-9 baseline for school years 2014–15 to 2018–19, one can examine the link between the availability of AP courses in high school and the probability of college attendance.
A significant share of the ninth-grade students used in this analysis are the third graders used in the district analysis, even though this analysis identifies HALO students using seventh- and eighth-grade data instead of third-grade data.[47] As with districts of residence, the high schools students attend in grade 9 explain a significant share of the gap in course-taking and college-going. Indeed, nearly 50 percent of the gap between HALO students’ AP course–taking and credit for public colleges (score of 3 or above) and those of HAHI students is attributable to students attending different high schools in grade 9. Similarly, although where students go to high school accounts for 13 percent of the four-year college–going gap between HALO students and their wealthier peers, it accounts for 41 percent of the gap in attendance at top colleges.[48]
The analysis of high schools proceeds like the analysis of districts. It first involves estimating how much the schools students attended in ninth grade affected their probability of attending college—isolating, to the extent possible, high schools’ influence from students’ cognitive, demographic, and socioeconomic attributes as of eighth grade (see Appendix C for details). The analysis then examines the extent to which school-level attributes observed at the time students were in eighth grade are predictive of college attendance (relative to expectations based on averages for students with similar characteristics). Given the methodological advantages enumerated above, this analysis provides a valuable check and extension of the district-level analysis.
High School Attributes That Predict College-Going Value-Added
The predictors are like those used in the district-level analysis but are measured at the school level. They include the fraction of students who are not eligible for free or reduced-price lunches (“peer affluence”),[49] peers’ average grade-8 test scores (“peer achievement”), spending per pupil, and the average share of students receiving gifted services in ELA or math, taking AP/IB courses, and getting dual credit through CCP (“advanced courses and services”). Unlike the district-level analysis, however, there is not a measure of school options, as there is no analogous measure when shifting the focus from the district of residence to the school of attendance.[50] Descriptive statistics, results in tabular form, and sensitivity analyses are available in Appendix E.
Figure 5 (below) presents the estimates with respect to value-added for four-year colleges and universities. It reveals that when comparing high schools’ attributes at baseline, peer achievement is by far the strongest predictor of college-going. An increase of one standard deviation in the average test score of one’s high-school peers (equivalent to a school’s students going from approximately the fiftieth percentile to the sixtieth percentile on the grade-8 test-score distribution) corresponds to an 8.6-percentage-point increase in the probability of attending a four-year college.[51] School spending comes in second, with an increase of one standard deviation—$2,350 per student—corresponding to an increase of 1.9 percentage points in the probability of attending college. Notably, as in the district analysis, there is no positive relationship between the proxy for peer affluence or advanced course–taking and a school’s value-added with respect to attending a four-year college. Indeed, HALO students’ college-going is higher when they attend school with other students who are eligible for free or reduced-price lunches. The negative result for peer affluence may be because of the limitations of using free or reduced-price meal eligibility as a proxy for student poverty.[52]
Figure 5. Predictors of High Schools’ Value-Added for Four-Year Colleges
Note: The figure presents the relationship between baseline characteristics of students’ high schools (observed for students in grade 9 between 2014–15 and 2018–19) and those high schools’ value-added in the probability that their students attended a four-year college. The estimates are from a single OLS regression model that includes standardized versions of all four predictors (i.e., they each have a mean of 0 and a standard deviation of 1). The horizontal bars in each figure capture the change in school value-added as a rate. For example, a value of 2 percent means that a one-standard-deviation increase in the predictor corresponds to a two-percentage-point increase in the probability that district students attended a four-year college or university. Solid bars indicate that the estimates are statistically significant at the 5 percent level for a two-tailed test.
Figure 6 (below) presents the estimates for attendance at top colleges and universities. Once again, like the district-level analysis, it reveals that advanced coursework and gifted services overtake peer achievement as the strongest predictor of college-going. Specifically, a one–standard deviation increase in participation in advanced coursework and gifted services corresponds to a 4.3-percentage-point increase in the probability of attending a top college. This result is driven entirely by AP coursework, as opposed to other dual-credit options or gifted services.[53] Peer achievement comes in a close second (an estimated effect of 3.2 percentage points), and HALO students’ college-going is again somewhat higher when they attend school with other students who are eligible for free or reduced-price lunches.[54]
Figure 6. Predictors of High Schools’ Value-Added for Top Colleges
Note: The figure presents the relationship between baseline characteristics of students’ high schools (observed for students in grade 9 between 2014–15 and 2018–19) and those high schools’ value-added in the probability that their students attended a top four-year college. A “top college” is defined as one whose average student tested in the top 20 percent of our sample on the ACT or SAT between 2016 and 2019. That captures approximately the top 25 percent of the national distribution (scores of approximately 25 on the ACT and 1200 on the SAT). The estimates are from a single OLS regression model that includes standardized versions of all four predictors (i.e., they each have a mean of 0 and a standard deviation of 1). The horizontal bars in each figure capture the change in school value-added as a rate. For example, a value of 2 percent means that a one-standard-deviation increase in the predictor corresponds to a two-percentage-point increase in the probability that district students attended a top four-year college or university. Solid bars indicate that the estimates are statistically significant at the 5 percent level for a two-tailed test.
Note that null or negative estimates (e.g., for advanced coursework in Figure 5 and peer affluence in both figures) do not imply that those factors do not affect college-going. This analysis is merely identifying school-level predictors of changes in students’ schooling trajectories after grade 8.[55] Additionally, as discussed in the district analysis, whether the analysis can identify such predictors depends on the effective sample used. The schools that educate a sufficient number of HALO students and that are reliably effective or ineffective at changing these students’ trajectories when it comes to four-year colleges may not vary all that much in the coursework they offer (e.g., few may offer AP courses), but those that are particularly effective or ineffective at changing HALO students’ trajectories when it comes to top colleges may indeed vary significantly in the availability of AP coursework. That does not mean that schools effective at getting their students into four-year colleges without the aid of AP coursework would not benefit from it. Indeed, an analysis that includes all Ohio schools and students (not just HALO students) reveals that the availability of AP coursework (but, once again, not CCP or gifted services) is predictive of getting the average Ohio student into a four-year college or top college.[56]
The above results largely corroborate those of the district-level analysis and, reassuringly, are less sensitive to the sample used and statistical weighting.[57] Once again, the analysis points to the predictive power of peer achievement and advanced coursework in getting HALO students into four-year and top colleges, respectively. This is an important addition to the set of results from the district-level analysis, as a student’s district of residence explains much of the variation in AP course–taking.
A Closer Look at High Schools’ College-Going Value-Added for HALO Students
The preceding analysis identifies peer achievement and AP course enrollment rates as top predictors of HALO students’ probability of attending four-year and top colleges, respectively. This section looks for similarities in high schools that are particularly effective at increasing HALO students’ probability of attending a four-year or top college. First, Table 8 (below) lists the top twenty-five high schools in terms of the average statewide rank of their college-going value-added estimates for four-year and top colleges and universities. (The appendix provides a high-school value-added ranking focused exclusively on top colleges and universities.[58])
Table 8 reveals that the high schools most effective at changing students’ attainment trajectories after grade 8 are primarily in the suburbs, but there are some notable exceptions. Portsmouth High School, for example, is in a district that federal data label as a town, and it has relatively low average test scores, high rates of school meal eligibility, and moderate-to-low rates of participation in AP coursework. This school is unusual, however, in that it also includes a junior high school (it serves grades 7–12). Zanesville High School is another high-poverty and low-achievement school in a town, but notably, it boasts a moderate-to-high rate of enrollment in AP courses. Perhaps the biggest standout is the Cleveland School of Science and Medicine—one of the Cleveland Metropolitan School District’s selective “criteria schools.” It is a high-poverty school in a city district, but its students are high-achieving and have access to advanced coursework.
Table 9 (further below) restricts the rankings to schools in the top 40 percent in terms of the proportion of their students who qualify for free or reduced-price lunches (those indicated as having “high” or “high/moderate” poverty rates in Table 8). It includes several schools in city districts that enroll large numbers of HALO students, with a solid mix of schools from towns, suburbs, and rural areas. Consistent with the analysis of value-added for top colleges and universities, several schools on the list have moderate-to-high rates of student participation in AP coursework and moderate-to-high average test scores. Among these schools are four of Cleveland Metro’s five selective “criteria schools.[59] It is beyond the scope of this study to thoroughly examine similarities across these schools, but the presence of selective and early-college high schools stands out.
Table 8. High Schools with the Highest College-Going Value-Added (VA) for HALO Students
*/
/*-->*/
/*-->*/
/*-->*/
/*-->*/
High Schools & Contextual Indicators
School of Attendance
4-Year College VA
Top-College VA
Location District
NCES Locale
Test Scores (Gr. 8)
Poverty (Gr. 8)
Spending Per Pupil
Gifted Services
AP/IB
College Credit Plus
1
Turpin
0.25
0.19
Forest Hills
Suburb
High
Low
Moderate
Moderate
High
Low
2
Granville
0.26
0.15
Granville
Suburb
High
Low
High/Mod.
High
High
Mod./Low
3
Portsmouth
0.22
0.16
Portsmouth
Town
Mod./Low
High
High
Mod./Low
Mod./Low
Mod./Low
4
Mathews
0.28
0.13
Mathews
Rural
Mod./Low
Mod./Low
High/Mod.
High/Mod.
Low
High/Mod.
5
Williamsburg
0.19
0.21
Williamsburg
Suburb
High/Mod.
Moderate
Low
High/Mod.
High/Mod.
High/Mod.
6
Anderson
0.19
0.20
Forest Hills
Suburb
High
Low
Moderate
Moderate
High
Low
7
Sycamore
0.22
0.15
Sycamore
Suburb
High
Low
High
Moderate
High
Mod./Low
8
Dublin Coffman
0.17
0.22
Dublin
Suburb
High
Low
High/Mod.
Low
High
Mod./Low
9
William Mason
0.18
0.20
Mason
Suburb
High
Low
Mod./Low
High/Mod.
High
High
10
Lakota West
0.18
0.16
Lakota
Suburb
High
Low
Mod./Low
Moderate
High
Mod./Low
11
Bay
0.27
0.10
Bay Village
Suburb
High
Low
High/Mod.
High/Mod.
High
Mod./Low
12
Cleveland School of Science and Medicine
0.17
0.18
Cleveland
City
High
High
High
High/Mod.
High
High
13
Orange
0.22
0.12
Orange
Suburb
High
Low
High
High
High
Low
14
Zanesville
0.21
0.12
Zanesville
Town
Low
High
High/Mod.
Moderate
High/Mod.
Moderate
15
Springboro
0.21
0.12
Springboro
Suburb
High
Low
Low
High
High/Mod.
High
16
Oakwood
0.16
0.20
Oakwood
Suburb
High
Low
High/Mod.
High
High
High
17
Madeira
0.17
0.16
Madeira
Suburb
High
Low
High
High
High
High
18
Perrysburg
0.23
0.09
Perrysburg
Suburb
High
Low
Moderate
Mod./Low
High
High/Mod.
19
Finneytown Secondary Campus
0.16
0.13
Finneytown
Suburb
Mod./Low
High/Mod.
Moderate
Mod./Low
High
Mod./Low
20
West Clermont
0.14
0.17
West Clermont
Suburb
Moderate
Mod./Low
Low
Low
High
Moderate
21
Solon
0.22
0.08
Solon
Suburb
High
Low
High
High
High
Moderate
22
Medina
0.17
0.10
Medina
Suburb
High/Mod.
Low
Moderate
Mod./Low
High
Moderate
23
Waynesfield Goshen
0.24
0.07
Waynesfield Goshen
Rural
High/Mod.
Mod./Low
High/Mod.
High/Mod.
Low
High
24
West Geauga
0.16
0.09
West Geauga
Rural
High
Low
High/Mod.
High/Mod.
High
Mod./Low
25
Johnstown
0.24
0.06
Johnstown-Monroe
Rural
High
Low
Low
High/Mod.
Mod./Low
High/Mod.
Note: The table lists the high schools that most exceeded expectations in terms of the probability that their grade-9 students would attend a four-year college or a top college (where students have an average score of approximately 25 or above on the ACT and 1200 or above on the SAT). Specifically, focusing on districts that had at least ten HALO residents attending public schools (including charters) in grade 9 between 2014–15 and 2018–19, it identifies schools with HALO college-going value-added estimates that rank among the top twenty-five statewide (i.e., those whose average ranking across both estimates puts them in the top twenty-five). The value-added estimates listed in the two columns next to school names indicate the increased probability of college attendance among HALO students. (For example, Turpin High School’s value-added of 0.25 indicates that the fraction of HALO students going to college was twenty-five percentage points greater than expected based on those HALO students’ characteristics in grade 8 and earlier.) The remaining columns summarize school characteristics in those baseline years (2014–15 to 2018–19) when HALO residents were in ninth grade, summarizing how those schools stack up compared with other Ohio high schools regarding the baseline achievement level of students in grade 8 (average test scores in ELA and math), the proportion of grade-8 students who qualify for free or reduced-price lunches (“poverty”), spending per pupil, the fraction of students in grades 9–12 who are receiving gifted services in ELA or math, and the fraction of students taking AP and IB coursework. The possible categories are “high” (top 20 percent), “high/moderate” (sixtieth to eightieth percentiles), “moderate” (fortieth to sixtieth percentiles), “moderate/low” (twentieth to fortieth percentiles), and “low” (bottom 20 percent).
Table 9. High-Poverty High Schools with the Highest College-Going Value-Added for HALO Students
*/
/*-->*/
/*-->*/
/*-->*/
/*-->*/
High Schools & Contextual Indicators
Rank
School of Attendance
4-Year College VA
Top-College VA
Location District
NCES Locale
School Type
Test Scores (Grade 8)
Spending Per Pupil
Gifted Services
AP/IB
College Credit Plus
1
Portsmouth
0.22
0.16
Portsmouth
Town
District
Mod./Low
High
Mod./Low
Mod./Low
Mod./Low
2
Cleveland School of Science and Medicine
0.17
0.18
Cleveland
City
District
High
High
High/Mod.
High
High
3
Zanesville
0.21
0.12
Zanesville
Town
District
Low
High/Mod.
Moderate
High/Mod.
Moderate
4
Finneytown Secondary Campus
0.16
0.13
Finneytown
Suburb
District
Mod./Low
Moderate
Mod./Low
High
Mod./Low
5
Chillicothe
0.17
0.07
Chillicothe
Town
District
Mod./Low
Moderate
High/Mod.
High
Mod./Low
6
Claymont
0.18
0.06
Claymont
Town
District
Mod./Low
High/Mod.
Moderate
Moderate
Moderate
7
Toledo Technology Academy of Engineering
0.15
0.07
Toledo
City
District
High
High
Mod./Low
Mod./Low
High
8
Vinton County
0.12
0.08
Vinton County
Rural
District
Mod./Low
Mod./Low
High
Moderate
Low
9
Hamilton
0.11
0.10
Hamilton
Suburb
District
Moderate
Low
High/Mod.
High/Mod.
Mod./Low
10
Warren G. Harding
0.18
0.05
Warren
City
District
Low
High
Low
Moderate
Mod./Low
11
Youngstown Rayen Early College
0.09
0.14
Youngstown
City
District
Moderate
High
Moderate
Mod./Low
High
12
Valley
0.31
0.03
Valley
Town
District
High/Mod.
Moderate
Low
Moderate
High/Mod.
13
Paint Valley
0.23
0.03
Paint Valley
Rural
District
Mod./Low
Moderate
Low
Mod./Low
Mod./Low
14
Dayton Early College Academy
0.09
0.13
Dayton
City
Charter
Moderate
High/Mod.
Low
Moderate
High
15
Whitney M. Young
0.14
0.05
Cleveland
City
District
Moderate
High
High
High
High/Mod.
16
Cleveland Early College
0.15
0.04
Cleveland
City
District
High
High
High/Mod.
High
High
17
Marion-Franklin
0.10
0.08
Columbus
City
District
Low
High
Mod./Low
High/Mod.
Low
18
National Inventors Hall of Fame STEM
0.23
0.02
Akron
City
STEM
High/Mod.
High/Mod.
High
Moderate
High
19
Bard Early College
0.10
0.07
Cleveland
City
District
High/Mod.
High/Mod.
High/Mod.
Mod./Low
High
20
Harding
0.08
0.10
Marion
Town
District
Low
High/Mod.
Moderate
Moderate
Moderate
21
Princeton
0.05
0.14
Princeton
Suburb
District
Mod./Low
High/Mod.
High/Mod.
High
Mod./Low
22
Coshocton
0.10
0.06
Coshocton
Town
District
Mod./Low
Moderate
High
High/Mod.
High/Mod.
23
Alliance
0.15
0.03
Alliance
Town
District
Mod./Low
Moderate
High/Mod.
Moderate
High/Mod.
24
Middletown
0.06
0.10
Middletown
Suburb
District
Low
Mod./Low
Mod./Low
Moderate
Low
25
Waverly
0.27
0.00
Waverly
Town
District
Mod./Low
Mod./Low
Moderate
Moderate
Mod./Low
Note: The table lists the high schools that most exceeded expectations in terms of the probability that their grade-9 students would attend a four-year college or a top college (where students have an average score of approximately 25 or above on the ACT and 1200 or above on the SAT). Specifically, focusing on districts that had at least ten HALO residents attending public schools (including charters) in grade 9 between 2014–15 and 2018–19, it identifies schools with HALO college-going value-added estimates that rank among the top twenty-five among high- and high/moderate-poverty schools statewide (i.e., those whose average ranking across both estimates puts them in the top twenty-five among schools with poverty rates in the top 40 percent). The value-added estimates listed in the two columns next to school names indicate the increased probability of college attendance among HALO students. (For example, a value-added of 0.20 indicates that the fraction of HALO students going to college was twenty percentage points greater than expected based on those HALO students’ characteristics in grade 8 and earlier.) The remaining columns summarize school characteristics in those baseline years (2014–15 to 2018–19) when HALO residents were in ninth grade, summarizing how those schools stack up compared with other Ohio high schools regarding the baseline achievement level of students in grade 8 (average test scores in ELA and math), the proportion of grade-8 students who qualify for free or reduced-price lunches (“poverty”), spending per pupil, the fraction of students in grades 9–12 who are receiving gifted services in ELA or math, and the fraction of students taking AP and IB coursework. The possible categories are “high” (top 20 percent), “high/moderate” (sixtieth to eightieth percentiles), “moderate” (fortieth to sixtieth percentiles), “moderate/low” (twentieth to fortieth percentiles), and “low” (bottom 20 percent).
HALO Students Taking Advanced Coursework
The preceding analysis identifies commonalities among the districts and schools where HALO students are most likely to exceed expectations in their college-going. One clear takeaway is that, holding other inputs constant, districts and schools where students take advanced coursework at higher rates are also those where HALO students attend top colleges at higher rates. The analysis cannot tell us, however, how the postsecondary prospects of HALO students compare between those who participate in advanced coursework and those who do not participate in advanced coursework. The analysis in this section does so by focusing on observationally similar HALO students who attended the same baseline school. Specifically, it focuses on similar students who attended the same elementary school in grade 3, comparing the college-going of those who received gifted services in ELA or math with the college-going of those who did not receive gifted services in ELA or math (often advanced coursework) and comparing the college-going of those who took advanced math coursework in grades 6–8 with the college-going of those who did not, and it also focuses on similar students who attended the same middle school in grade 8, comparing the college-going of those who participated in AP/IB coursework or dual-credit options via CCP with the college-going of those who did not.[60]
Note that although this research design is relatively strong, it is unlikely to isolate the causal impact of taking advanced coursework or receiving gifted services on students’ college attendance. There are school-related factors and non-school-related factors that might lead talented HALO students to enroll in advanced coursework (or not), and these other factors may affect the probability of college-going beyond their impact on course-taking. For example, school guidance counselors and students’ friends may affect their aspirations, which may affect both course selection and college attendance. These environmental forces may be more important levers to pull to increase college-going among HALO students (hence the preceding school- and district-level analyses). That said, because the comparisons below are between similar students—who attended the same baseline school and who have similar prior test scores, demographic characteristics, gifted identification, and the like—this analysis should capture, to a reasonable extent, the impact of advanced course–taking and gifted services on college-going among HALO students.
Figure 7 (below) indicates that HALO students who took advanced coursework—from algebra in middle school to AP classes in high school—have substantially higher rates of college attendance than similar HALO students who did not. HALO students who took high-school math courses in grades 6–8 (mostly algebra) have college-going rates that are eighteen percentage points higher than similar students who did not take advanced math coursework. And Figure 8 (further below) indicates that HALO middle-school students’ probability of attending a top college is six percentage points higher if they take advanced math courses. One cannot directly compare the magnitude of the estimated impacts between middle schools and high schools, as they are based on different samples of students. The middle-school sample also less reliably links students to higher-education data, which most likely leads to underestimating true effects. One should instead focus on the fact that the estimates are large and positive across all types of coursework and services in both middle school and high school.
Figure 7. Comparing Attendance Rates at Four-Year Colleges Between Similar HALO Students Who Did/Didn’t Take Advanced Coursework or Receive Gifted Services
Note: The figure presents the difference in attendance rates (in percentage points) at four-year colleges between HALO students who participated in advanced coursework or gifted programming and observationally similar HALO students who did not. Specifically, the analysis of gifted services (in ELA or math) and advanced math coursework in grades 6–8 compares the college-going of HALO students with similar test scores and demographic characteristics who attended the same school in third grade; the analysis of AP/IB and CCP coursework in grades 9–12 compares HALO students with similar test scores and demographic characteristics who attended the same school in eighth grade. The bars are solid because all estimates reach conventional levels of statistical significance (p < 0.05).
Figure 8. Comparing Attendance Rates at Top Colleges Between Similar HALO Students Who Did/Didn’t Take Advanced Coursework or Receive Gifted Services
Note: The figure presents the difference in attendance rates (in percentage points) at top colleges between HALO students who participated in advanced coursework or gifted programming and observationally similar HALO students who did not. Specifically, the analysis of gifted services (in ELA or math) and advanced math coursework in grades 6–8 compares the college-going of HALO students with similar test scores and demographic characteristics who attended the same school in third grade; the analysis of AP/IB and CCP coursework in grades 9–12 compares HALO students with similar test scores and demographic characteristics who attended the same school in eighth grade. The bars are solid because all estimates reach conventional levels of statistical significance (p < 0.05).
Figure 7 also indicates that taking AP coursework likely provides the strongest path to college for HALO high-school students—whether they are eyeing a four-year college or a top college. Students who took at least one AP (or IB) course increased their college-going by twenty-nine percentage points relative to HALO students who did not take at least one AP (or IB) course.[61] Figure 8 indicates that the margin for top-college attendance is sixteen percentage points. The estimates for CCP are also positive and substantial, but they are half the size of the AP estimates when it comes to HALO students getting into top colleges.
Finally, the figures indicate that students who receive gifted services in ELA or math are indeed more likely to attend four-year colleges (by six percentage points) and top colleges (by four percentage points) relative to HALO students who do not receive such services—which are a variable mix of advanced coursework or other programming linked to students’ areas of gifted identification.
The above analysis does not allow one to completely isolate the causal impact of course-taking from other factors that might lead students to take advanced courses in the first place. And again, one should not compare the magnitudes of the estimates between the middle-school and high-school estimates, as they are based on different samples. What is clear, however, is that HALO students who took more advanced courses and received gifted services fared far better than those who did not. The results also suggest that the impacts of advanced math coursework in middle school and AP coursework in high school are larger than the impacts of gifted services and CCP coursework, respectively.
Summary and Policy Implications
The analysis confirms that HALO students in Ohio are significantly less likely to attend a college or university, especially a top college or university, than their wealthier peers who had similar academic performance and demographic characteristics back in third grade. The results suggest that students’ district of residence and the high school they attend play a significant role in this college-going disparity—particularly when it comes to top colleges and universities. A major reason appears to be that the academic achievement of HALO students’ peers and their access to advanced coursework (particularly AP classes) are strong predictors of college-going that vary significantly across districts and schools.
The districts and schools that provide the greatest boost to HALO students’ college-going tend to be in high-achieving, wealthy suburbs that enroll few HALO students. But the analysis also indicates that schools serving primarily low-income kids—often located in cities and towns—are sometimes effective at getting HALO students into college at high rates. This is particularly true if they surround HALO students with high-achieving peers and provide them with advanced coursework and gifted services. For example, four of Cleveland’s five selective “criteria schools”—which have high poverty rates but offer a variety of dual-credit options and have relatively high-achieving student bodies—are among the top twenty-five high-poverty high schools in Ohio in terms of boosting HALO students’ college-going. More generally, across all Ohio districts and schools, HALO students who took advanced coursework or received gifted services in middle and high school were far more likely to attend four-year colleges and universities than other HALO students who attended the same schools but did not pursue advanced coursework.
Thus, this study suggests Ohio could improve its K–12 pipeline to higher education by providing HALO students with more opportunities to take advanced coursework, receive gifted education services, and surround themselves with similarly high-achieving peers. Schools should encourage HALO students to take advantage of those opportunities when they are available. Rigorous research demonstrates how effective high-school guidance counselors can be in getting HALO students into top colleges and universities simply by making them aware of those opportunities.[62] The results of this analysis suggest that HALO students should receive encouragement to take advanced coursework and to get on a path to college well before it is time to choose a college, however. Policy proposals to automatically enroll high-achieving kids in algebra in eighth grade are a good start. Doing so could, in turn, increase AP coursework in high school—the strongest predictor of college-going among HALO students.[63] The National Working Group on Advanced Education’s (2023) report enumerates several opportunities for schools and policymakers to implement such an approach throughout the K–12 pipeline.[64]
Grouping high-ability students together and offering advanced coursework requires enough high-achieving students to make it financially viable, and it requires access to a supply of teachers with the requisite expertise. Many HALO students reside in districts that don’t meet these conditions.[65] But as this analysis shows, there are many districts with substantial concentrations of HALO students that do not provide much of a boost in HALO students’ college-going. For example, Columbus City Schools has the highest number of HALO students residing within its boundaries, and these students’ rate of college-going is eighteen percentage points lower than the state average for students with similar test scores and other attributes in third grade. That’s forty HALO third graders in Columbus alone, every year, who won’t go to college but would have if they resided in an Ohio district of average quality (where HALO students’ college-going is still significantly lower than that of their wealthier high-achieving peers). Indeed, among the twelve districts with the largest number of HALO students—including Ohio’s eight large urban districts—only in Akron does the rate of four-year college–going among HALO students not fall below what one would have expected based on these students’ third-grade test scores and attributes.
One way to address this problem is for Ohio policymakers to expand access to high-quality school options and to provide families with the information and decision-making assistance they need to make the best use of those options. For example, policymakers might establish selective schools that draw high-achieving students from several districts to get the critical mass of students needed to make the model viable. Each district in the region could have a right to some share of seats. Note, however, that to reach HALO students, there may need to be seats set aside for low-income students. For example, Metro Early College High School—a state STEM school that draws students from several districts in central Ohio—is effective at boosting HALO students’ chances of getting into top colleges and universities. But it does not make the top-twenty-five among “high-poverty” high schools for getting HALO students into college, because it educates relatively few low-income students.[66] Moreover, Ohio’s state STEM schools do not have test score requirements, which likely undermines their effectiveness when it comes to improving HALO students’ rates of college-going.
Another option is to expand Ohio’s interdistrict open enrollment program to all districts so that HALO students could attend a neighboring high-achieving district, free of charge, if that district has open seats.[67] Suburban districts filled with high-achieving students might be open to admitting HALO students from surrounding districts if there were financial incentives to doing so—for example, if they were to receive the substantially higher per-pupil aid allocated to low-income students attending high-poverty districts. The recent expansion of EdChoice, which provides considerable financial assistance to low-income households, is also a promising route, given its success in getting Ohio’s low-income students into college.[68]
The state of Ohio excels at providing information that is predictive of schools’ college-going value-added. For example, the report card grades capturing high-school achievement levels, test score growth, and college preparation during the baseline years (2014–2019) were all highly predictive of students’ future college-going.[69] Thus, as new school options become available, the information is largely available to assess the quality of those options. The missing link seems to be helping families incorporate this information into their decision-making. Research demonstrates that with such support, parents make decisions that better align with educational goals.[70] Such support becomes increasingly important as school options expand.
It is worth remembering that the decision to attend college often hinges on factors beyond the K–12 public schooling system. For example, one reason the concentration of high-achieving students and high rates of AP coursework in schools might lead to more college-going is that colleges are more likely to target these high schools in the recruitment process.[71] Similarly, as the analysis suggests, HALO students’ attendance at top colleges increases if their district of residence is geographically near top public colleges and universities, which is consistent with research demonstrating the impact of cost and proximity on low-income students’ college-going decisions.[72] Nevertheless, this report also clearly documents the educational benefits of HALO students attending public schools that provide access to advanced coursework and high-achieving peers, in spite of factors such as college cost and proximity.
The analysis in this report focuses on how districts and schools might alter students’ academic trajectories beyond third grade—after family-, community-, and school-related factors have already played a significant role in putting kids on or off track for college—and it relies primarily on descriptive statistical methods to do so. Yet the results are strikingly consistent throughout, line up with the results of other rigorous studies, and point to clear opportunities for substantially improving college-going among Ohio’s HALO students. Unlocking this talent not only would transform these students’ futures but would likely also deliver broad economic and social benefits for Ohio.
Acknowledgments
I am grateful for the extensive and helpful feedback I received from Fordham’s Chad Aldis, Aaron Churchill, Chester Finn, and Michael Petrilli (listed in alphabetical order by last name), as well as from external readers Richard Kahlenberg, Vladimir Kogan, and Jonathan Plucker. The report improved greatly because of their feedback. The weaknesses that remain are entirely my fault.
- Stéphane Lavertu
I offer my deepest gratitude to Stéphane Lavertu for his fine work carrying out this project. Special thanks also to the Ohio Department of Education and Workforce for providing the data that made possible this report. I wish to thank David Yontz, who copy edited the report, and Dave Williams, who designed the layout. Finally, I thank my Fordham Institute colleagues Jeff Murray, Victoria McDougald, Meredith Coffey, and Stephanie Distler for their support in report publication and dissemination.
- Aaron Churchill
Ohio Research Director
Endnotes
[1] A “top college” in this report is one in which the average student scores in the top 20 percent on college admissions exams. Among Ohio institutions of higher education, this includes Case Western University, Cedarville University, College of Wooster, Kenyon College, Miami University, Oberlin College, Ohio State University, University of Cincinnati, and University of Dayton.
[2] HALO students are identified based on their characteristics in third or eighth grade, depending on the analysis. Specifically, they are students who scored in the top 20 percent statewide on math and ELA exams and who were identified as “economically disadvantaged,” which is largely based on their eligibility for free or reduced-price lunch.
[3] These college-going gaps reflect not only uneven in-school opportunities, but also factors not directly observed in this study such as college affordability and parents’ educational backgrounds, which a recent study from North Carolina indicates contributes to excellence gaps.
[4] These are not precise “causal” estimates, as unobserved factors, like an effective counselor, might have led students to take advanced courses in the first place.
[5] This value-added metric was created as part of this analysis and is unrelated to the “value-added” and “growth” metrics on Ohio district and school report cards.
[11] Coleman, James, Ernest Q. Campbell, Carol J. Hobson, James McPartland, Alexander M. Mood, Frederic D. Weinfeld, and Robert L. York. 1966. Equality of Educational Opportunity. Washington, DC: Department of Health, Education and Welfare.
[13] Chetty, Raj, Matthew O. Jackson, Theresa Kuchler, Johannes Stroebel, Nathaniel Hendren, Robert B. Fluegge, Sara Gong, Federico Gonzalez, Armelle Grondin, Matthew Jacob, Drew Johnston, Martin Koenen, Eduardo Laguna-Muggenburg, Florian Mudekereza, Tom Rutter, Nicolaj Thor, Wilbur Townsend, Ruby Zhang, Mike Bailey, Pablo Barberá, Monica Bhole, and Nils Wernerfelt. 2022. “Social Capital I: Measurement and Associations with Economic Mobility.” Nature 608: 108–121.
[14] Chetty, Raj, Matthew O. Jackson, Theresa Kuchler, Johannes Stroebel, Nathaniel Hendren, Robert B. Fluegge, Sara Gong, Federico Gonzalez, Armelle Grondin, Matthew Jacob, Drew Johnston, Martin Koenen, Eduardo Laguna-Muggenburg, Florian Mudekereza, Tom Rutter, Nicolaj Thor, Wilbur Townsend, Ruby Zhang, Mike Bailey, Pablo Barberá, Monica Bhole, and Nils Wernerfelt. 2022. “Social Capital II: Determinants of Economic Connectedness.” Nature 608: 122–134.
[27] More precisely, the data identify whether a student is “economically disadvantaged,” which is determined primarily based on their eligibility for free or reduced-price lunches. The report refers to “free or reduced-price lunch” eligibility because it is a commonly used and understood metric, and to draw attention to the fact that it is a fuzzy measure of economic disadvantage. Students may or may not receive this label for a variety of reasons that have little to do with household income. For example, students from low-income households may not be labeled as economically disadvantaged because they did not submit an application for the meals program and their families are not participating in means-tested public assistance programs. Notably, beginning in 2012-13, several Ohio districts and schools began to use the “community eligibility” option of the National School Lunch Program. Students attending a school participating in the program are labeled “economically disadvantaged” regardless of their household income. The coarseness of this proxy for poverty means that the analysis in this report likely understates the educational disparities between HALO and HAHI students. The analysis below further examines the implications of using this measure.
[28] Ohio law provides criteria for identifying gifted students based on superior cognitive, academic (e.g., in mathematics, science, English language arts, or social studies), creative, or artistic ability. The Ohio Department of Education and Workforce provides a list of approved assessments, and districts develop a screening plan that draws from this list. In the absence of whole-grade screening in a school or district, assessments of these abilities typically depend on a referral from a parent, teacher, or guardian.
[29] All students we do not observe attaining a milestone—such as receiving a high-school diploma or attending a four-year college—are coded as not having achieved that milestone. This includes students whose families moved out of state or who transferred to a private school after third grade, as the data track public-school students only. Thus, the results presented in Table 2 understate rates of high-school graduation and, in particular, college attendance because of some additional imprecision in linking grade-9 public-school cohorts to National Student Clearinghouse data. Because higher-achieving and higher-income students are more likely to exit the dataset, however, comparing HALO students with their wealthier peers should lead us to understate attainment gaps between HALO and HAHI students.
[30] A top college is one with ACT and SAT scores in the top 20 percent of the Ohio distribution, because that corresponds to HALO students’ place in the test-score distribution in grade 3. The coding is based on Integrated Postsecondary Education Data System data from 2016 to 2019, which is around the time these students applied to college and preceded the post-COVID wave of test-optional policies.
[31] A student is identified as having received any gifted service if they were enrolled in accelerated coursework or other programs in ELA or math that were directly relevant to their category of gifted identification. Recall from Table 1 that HALO students’ average grade-3 test scores are approximately 10 percent of a standard deviation lower than those of their wealthier high-achieving peers. One might wonder whether those differences account for the differences in college-going and K–12 coursework presented in Table 3 and Table 4, respectively. The analysis in Appendix B reveals they do not. For example, test scores account for less than two percentage points in the difference in college-going between HALO students and their wealthier high-achieving peers, and they account for two to three percentage points in the differences in the rates of advanced coursework and gifted services.
[32] This is a stylized description of the procedure, as these quantities are calculated simultaneously. Appendix C provides details of the statistical procedure.
[33] Research demonstrates that community colleges and less selective four-year schools yield inferior life outcomes for low-income kids. For example, see Bleemer, Zachary, and Sarah Quincy. 2025. “Changes in the College Mobility Pipeline Since 1900.” NBER Working Paper No. 33797.
[36] Angrist, Joshua, Peter Hull, Russell Legate-Yang, Parag A. Pathak, and Christopher R. Walters. 2025. “Putting School Surveys to the Test.” NBER Working Paper No. 33622.
[37] State law requires high schools to administer the ACT or SAT free of charge to all juniors, but students can opt out. There are ACT/SAT scores for 75 percent of the district sample based on third-grade data (87 percent of HAHI students and 80 percent of HALO students). For the grade-9 sample used in the high-school analysis, there are SAT-equivalent scores for 83 percent of the sample (97 percent of HAHI students and 93 percent of HALO students). The analysis of high-school value-added is limited to students who could be linked to a high school, which helps explain the better sample coverage.
[38] The correlation coefficient indicates a strong relationship (0.70), and the R-squared indicates that 50 percent of the variation in college-going value-added is explained by test-score value-added. The results using high schools are comparable, with a correlation coefficient of 0.55 and an R-squared of 0.30 (though the relationship becomes stronger if one restricts the analysis to high schools with at least ten students who took the SAT).
[39] This is a common but coarse measure of student poverty that has become less valid over time as districts began to use the “community eligibility provision” of the National School Lunch Program. Most of the observations in this district-level analysis are based on years prior to Ohio schools adopting the “community eligibility” option. The results of the district analysis are similar if the analysis is limited to years prior to the rollout of the program in 2012-13. Because the measure is nonetheless coarse, however, it may be that other variables (e.g., student test scores used to capture “peer achievement”) capture student poverty to a significant extent. For more information, see Koedel, Cory, and Eric Parsons. 2021. “The Effect of the Community Eligibility Provision on the Ability of Free and Reduced-Price Meal Data to Identify Disadvantaged Students.” Educational Evaluation and Policy Analysis 43(1): 3–31.
[40] The results are generally similar when estimating separate bivariate correlations. Appendix D provides details of the regression models, descriptive statistics for the variables, tabular results of the estimates presented in the figures, and the results of a variety of additional analyses that test for the robustness of the results depending on whether the models are weighted by the precision of the value-added estimates and whether the value-added estimates are based on all students or the HALO or HAHI subsets of students.
[41] Averages and standard deviations for the non-standardized district-level variables appear in Table D1 of Appendix D. Test scores are converted to student-level percentiles by converting the average student-level z-scores.
[42] Estimates are weighted by the inverse of the squared standard error of the value-added estimate, such that more weight is placed on observations in which we have more confidence. The relative ranking of predictors changes if one estimates regressions without weights, with district spending rising to the top and peer achievement remaining significant but sliding down to second place (see Table D4 in Appendix D). The inconsistent estimates suggest that the predictive value of variables depends on the sample of districts on which one focuses. Peer affluence is the strongest predictor if one uses value-added estimates based on all district students (HALO and not), regardless of weighting procedure.
[43] Also see Table B1 in Appendix B for the full set of results.
[44] The reasons for the differences between Figure 2 and Figure 3 appear to be that (1) there is a modest relationship between a district’s overall college-going value-added and its value-added for top colleges and (2) the average district achievement level for Figure 3’s effective sample is higher than for Figure 2’s effective sample. Only 86 percent of the 563 districts in the sample (those with at least ten HALO students during the 2009–2014 baseline) had a HALO student who attended a top college, whereas all but two districts in the sample had a HALO student who attended a four-year college. The correlation between the four-year and top-four-year college-going value-added estimates is 0.40. This correlation drops to 0.09 when precision weights are included.
[47] Approximately 85 percent of the students in the high-school analysis are also in the district analysis. Appendix B and Appendix C provide descriptive statistics of the samples. Although there is significant overlap between the HALO students identified using grade-3 and grade-9 data, the overlap is imperfect. The grade-3 cohort based on 2013–14 data would have required 2019–20 grade-9 cohort data, which were not included. There is also further evidence of a leaky pipeline for HALO students. The share of high-achieving students who qualify for free or reduced-price lunches declines from 5 percent based on grade-3 identification to 4.3 percent based on grade-8 identification. Also note that high-achieving students identified for the grade-9 analysis are more likely to graduate from high school and attend college than the grade-3 sample. This is partly because of the attrition issues noted earlier, which artificially decrease the rates of college-going reported for the district analysis based on grade-3 cohorts. But it is also because the sample is limited to students linked to a particular high school in grade 9.
[49] This measure of poverty is particularly problematic for the high-school analysis, as there is extensive use of the National School Lunch Program’s “community eligibility” provision during the baseline years of 2014–15 through 2018–19. That means that the entire student body in some schools might be labeled as being eligible for the meal program even if many students do not meet the income threshold. The analysis below assesses the sensitivity of the results when one uses high-school students’ eligibility in third grade for free or reduced-price meals to calculate peer affluence in a school. For more information on the use of the lunch eligibility measure to calculate school-level economic disadvantage, see Koedel, Cory, and Eric Parsons. 2021. “The Effect of the Community Eligibility Provision on the Ability of Free and Reduced-Price Meal Data to Identify Disadvantaged Students.” Educational Evaluation and Policy Analysis 43(1): 3–31.
[50] For example, some high schools are independent schools of choice—charter schools and science, technology, engineering, and mathematics (STEM) schools—and by 2014–15, eligibility for private-school vouchers in Ohio was closely related to students’ eligibility for free or reduced-price lunches because the EdChoice scholarship was tied to family income and school achievement levels. One could create a composite measure based on the proximity and size of nearby private schools that accept vouchers, but that measure would be qualitatively different and creating it would be beyond the scope of this project.
[51] Averages and standard deviations for the non-standardized district-level variables appear in Table E1 of Appendix E. Test scores were translated to student-level percentiles by converting the average student-level z-scores.
[52] Using third-grade meal eligibility among a high school’s current ninth-grade students—meal eligibility observed prior to the introduction of schoolwide meal eligibility—yields a null estimate and diminishes the estimate for peer achievement by approximately two percentage points. These results suggest that peer achievement may capture student disadvantage more precisely than meal eligibility for the years of this analysis. However, because the measure based on third-grade observations also introduces error by basing peer composition on only a fraction of a school’s students (the approximately 85 percent of students per school for whom there are grade-3 data), one cannot say for certain.
[54] Once again, as is the case for the analysis reported in Figure 5, using grade-3 meal eligibility yields null estimates and leads to a reduction in the predictive power of peer achievement.
[55] As Table E6 in Appendix E reveals, schools with higher rates of four-year college–going among HALO students do indeed have lower rates of eligibility for free or reduced-priced lunches and higher rates of AP course participation. This analysis indicates, however, that this fact does not predict the college-going value-added of high schools.
[60]Appendix F provides details of the methodology and the results in tabular form. As with the value-added analysis, the method used to compare observationally similar students was to use statistical controls for baseline characteristics. The analysis employs baseline-school fixed effects to estimate comparisons among students who attended the same prior school.
[61] The results are similar when one considers whether students scored a 3 or above on the exam.
[66] Metro does not make the overall high-school rankings because it does not boost HALO students’ chances of attending a four-year college. Its rates of four-year college-going are those we would have expected based on students’ test scores and other attributes in eighth grade. Table G1 in Appendix G provides rankings of schools most effective at getting HALO students into top colleges and universities.
Note: Today, the Ohio House Education Committee heard testimony on House Bill 455 which, among other things, aims to eliminate outdated and irrelevant sections of state education law. Fordham’s vice president for Ohio policy presented proponent testimony on several aspects of the wide-ranging bill. These are his written remarks.
Thank you for the opportunity to testify today in support of House Bill 455.
Supporting Smarter Regulation to Refocus on Teaching and Learning
First and foremost, I want to commend Representatives Manning and Bird for their leadership in introducing House Bill 455. This thoughtful legislation takes important steps toward streamlining state education requirements so that educators can devote more of their energy to what truly matters—teaching and learning. This has long been a Fordham priority. We published a report more than a decade ago called “Getting Out of the Way: Education Flexibility to Boost Innovation and Improvement in Ohio”.
Over time, Ohio’s education code has become cluttered with outdated, duplicative, and overly prescriptive mandates that consume valuable time and resources. By revising or eliminating dozens of unnecessary provisions—from obsolete reporting requirements to redundant mandates—House Bill 455 helps reduce regulatory clutter and allows schools to focus more squarely on student outcomes.
This approach strikes a healthy balance: maintaining accountability and transparency while giving educators the flexibility they need. In doing so, the sponsors are helping restore common sense to how Ohio’s schools are governed.
Responsiveness to Stakeholder Feedback
We also appreciate the sponsors’ responsiveness to stakeholder feedback during the development of this bill. Their willingness to listen and make thoughtful adjustments is a model of good policymaking.
In particular, we thank Representatives Manning and Bird for removing the proposed changes related to community schools and the end-of-course exams in American history and U.S. government. The original community school provisions, while well-intentioned, could have inadvertently lowered accountability standards—something that would have undermined Ohio’s commitment to ensuring quality options for all families. By promptly addressing those concerns, the sponsors demonstrated a clear commitment to maintaining strong accountability even while rightly pursuing regulatory relief.
Similarly, the decision to retain the American history and government end-of-course exams reflects a careful balance between simplification and maintaining essential measures of civic understanding. These subjects remain foundational to preparing informed and engaged citizens, and we appreciate that they will continue to be an area of focus in Ohio high schools.
Improving Measures of College, Career, Workforce, and Military Readiness (CCWMR)
We also support the bill’s thoughtful updates to the College, Career, Workforce, and Military Readiness (CCWMR) component of the state report card. These adjustments refine how Ohio measures postsecondary preparedness—an area of ongoing importance to both families and policymakers.
By adding another objective method to demonstrate academic preparedness, the bill takes an important step toward identifying true indicators of readiness. These refinements will help ensure that Ohio’s report card more accurately reflects whether students are genuinely prepared for success beyond high school—whether in higher education, the workforce, or military service.
At the end of the day, our shared goal should be to find and reward true measures of readiness and preparedness—those that capture whether our students are leaving high school equipped for the opportunities and challenges ahead. House Bill 455 moves Ohio closer to that goal.
Suggested Improvement: Protecting the Integrity of the Early Literacy Measure
While we strongly support the overall direction of House Bill 455, we do have one concern regarding a change found in the substitute version of the bill—specifically, the revised definition of the early literacy component of the state report card.
Under the substitute language, the measure of students promoted to fourth grade now includes all students who move on, regardless of whether they demonstrated reading proficiency on the third-grade English language arts assessment. The previous version appropriately linked the rating to reading on grade level—either by scoring proficient on the state test or demonstrating competency on an approved alternative assessment.
By removing that linkage and awarding full credit simply for promotion, the measure risks rewarding (and even incentivizing) social promotion rather than true reading achievement. This could undermine the purpose of Ohio’s early literacy initiatives and diminish the report card’s value and accuracy.
To preserve the integrity of Ohio’s early literacy measure, we encourage restoring language that ties this indicator to demonstrated reading proficiency. Doing so ensures schools are recognized for preparing students to read proficiently by fourth grade—not merely for advancing them through the system.
Ohio has made tremendous strides in improving early reading instruction and implementing the science of reading. Maintaining strong and meaningful measures of reading proficiency is essential to building on that progress.
Conclusion
In closing, House Bill 455 represents thoughtful reform that simplifies the education code, reduces unnecessary burdens, and preserves essential standards of quality and accountability. We deeply appreciate the sponsors’ leadership and responsiveness and offer this small recommendation to further strengthen an already strong bill. Going forward, we hope this legislation is merely a first step toward even deeper reductions in red tape and bureaucracy.