Schools are heavily segregated by income, primarily because higher-income families choose to live in more affluent districts. Economic segregation matters because social connections between higher and lower income kids—particularly connections forged in schools and churches—improve educational outcomes and economic mobility for poor kids. The research is clear: Policies that promote economic connectedness in schools help drive the American dream.
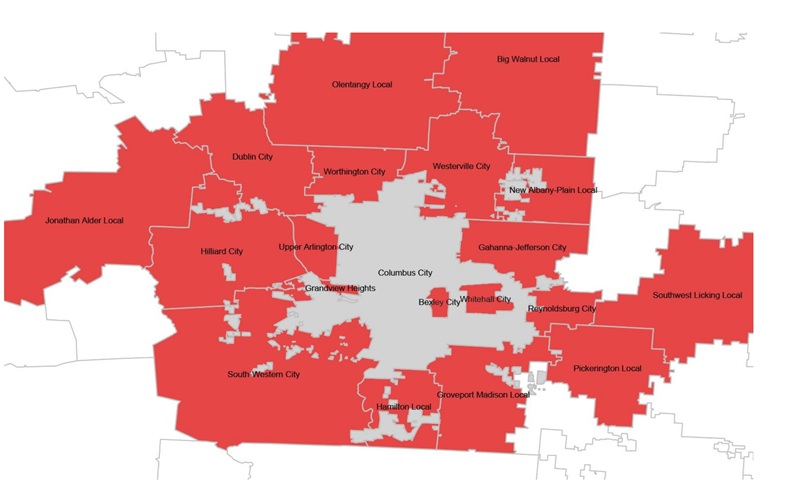
Yet many Ohio districts—particularly high-income suburban districts near major cities—are those most intent on keeping low-income kids out. They signal this intent loud and clear by refusing to participate in Ohio’s open enrollment program, which allows students from nearby districts to attend their schools when space is available. Figure 1 presents a map we’ve seen before: Ohio’s largest urban districts (labeled and shaded gray) surrounded by districts with policies that bar open enrollment (shaded red). Beyond those fortified suburban districts is a sea of districts that participate in (and families who make use of) Ohio’s open enrollment program, but those districts are generally too distant for city dwellers.
Figure 1. Ohio’s urban centers and districts that disallow open enrollment

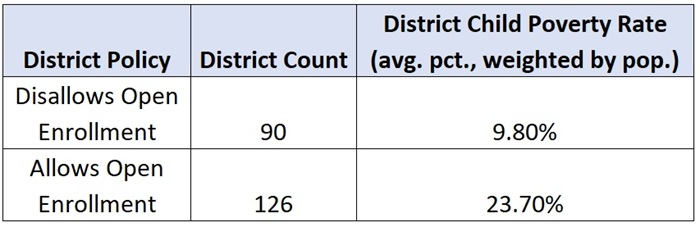
The kids kept out of the nearby suburban districts (in red) are disproportionately low income. Table 1 presents federal poverty estimates for school-age children in Ohio’s 216 city and suburban districts, comparing the 90 districts that disallow open enrollment (the red districts in Figure 1) and the 126 districts that allow it. Among the latter districts, which include Ohio’s eight large urban districts, 23.7 percent of children live in households below the poverty line (2024 household income of $32,255 for a family of four). The poverty rate is a much lower 9.8 percent in districts that forbid open enrollment.
Table 1. Poverty in city and suburban districts that do and do not allow open enrollment
Note that districts that don’t participate in Ohio’s open enrollment program may accept students from lower income districts, provided their families pay tuition or the district has an exemption, such as when a district employee resides in a different district (see ORC 3313.64(F)(8)). In other words, these fortified districts lower their drawbridges for relatively high-income, tuition-paying families who reside in surrounding low-income districts—or for the children of their own employees—but generally not for poor families. And the wealthier a district is, the more it charges. For example, Orange City Schools, a wealthy suburb outside Cleveland that forbids open enrollment, charged open enrollees a whopping $25,610 for the 2024-25 school year. Avon Local—a less wealthy Cleveland suburb that also does not participate in the open enrollment program—charged $10,032.
Unfortunately, there are no public data indicating how many parents pay these tuitions. But there are data on how many school-age district residents attend schools in other districts without the aid of open enrollment. One might characterize a district as “blocked” if its residents participate in interdistrict choice at higher rates without the aid of Ohio’s open enrollment program than they do with the aid of the program, as this roughly indicates family demand for schools in another district but a relative inability to access them for free. Table 2 lists the fifteen blocked districts in Ohio that have the highest share of school-age residents who attend schools in other districts without the aid of open enrollment (“Non-OE Interdistrict Enrollment”).
Table 2. “Blocked” districts where residents are most likely to enroll in another district
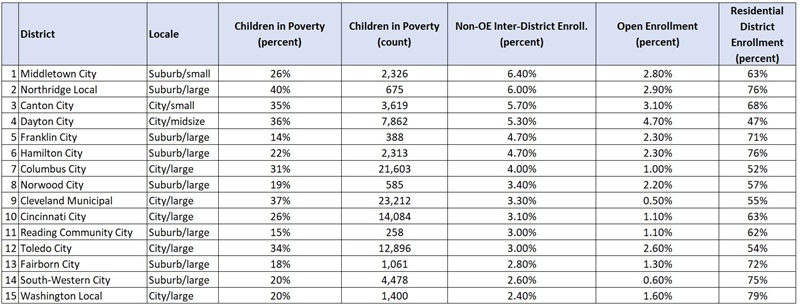
Six of Ohio’s eight large city districts are in the top fifteen, but so are several suburban districts. Notably, Middletown City (Vice President Vance’s childhood home, between Cincinnati and Dayton) and Northridge Local (adjacent to Dayton) come in first and second, respectively, with about 6 percent of their residents attending schools in another district without the aid of the open enrollment program. These districts adjoin some districts that participate in Ohio’s open enrollment program, but a greater share of their residents attend schools without the aid of the program. Not surprisingly, in all fifteen of the “blocked” districts, there are also high rates of participation in other school options (homeschooling, charters, and vouchers) as evidenced by the low share of school-age residents enrolling in district schools (see last column of Table 2).
Another noteworthy finding in Table 2 is the presence of South-Western City, as it also refuses to participate in Ohio’s open enrollment program. As Figure 2 reveals, with respect to open enrollment, its residents are kept out of adjacent districts Hilliard City and Hamilton Local. Hamilton Local has a child poverty rate nearly identical to South-Western City’s (and ranks twentieth on the “blocked” list), but Hilliard City is a more affluent district. South-Western City illustrates how even districts with high poverty rates may seek to fortify themselves against pupils from districts with even higher rates (e.g., Columbus City Schools).
Figure 2. Fortified districts in and around Columbus
***
District efforts to keep their schools exclusive and property values high mean they have strong incentives to keep out lower income kids. This is done by refusing to participate in Ohio’s open enrollment program and charging lofty tuitions to families from other districts. Policymakers could require districts with excess capacity to let in students from other districts, or they could create strong countervailing incentives to change these districts’ calculus. For example, if state funding per open enrollee were sufficiently high, then even wealthy districts might be willing to bring in low-income kids.
Unfortunately, as the Fordham Institute’s Aaron Churchill has explained, Ohio’s funding policy now provides minimal incentives for high-income districts to participate in the program. State payments per open enrollee are the same as state aid for the receiving district, which means wealthy districts get relatively little compensation. The incentives would be much stronger if, for example, per pupil aid from a student’s home district followed them when they open enrolled. Students from Ohio’s poorest districts could suddenly become coveted students to fill open seats. And my own research has demonstrated that this would likely improve their academic outcomes.