School boards have become ground zero for America’s education culture wars, with fiery debates over race, gender, curriculum, and pandemic policies making national headlines. But beyond the noise, how well do these elected bodies actually represent their communities?
To find out, political scientists David Houston and Michael Hartney conducted the largest national survey of school board members in decades, gathering responses from more than 5,000 board members across 3,000 districts. They compared members’ political and demographic identities, as well as their views on controversial education issues, to those of the communities they serve.
The findings complicate common narratives. While board members’ partisanship and ideology largely mirror the American public’s—and often align with local voters on hot-button cultural issues—they diverge more on questions of school quality, school choice, and teachers’ unions. The report sheds light on the surprising ways representation works, and doesn’t work, in one of the country’s most important democratic institutions.
Foreword
By Michael J. Petrilli and Adam Tyner
The United States has more school board members than any other group of elected leaders—more than state representatives and more than city councilors.[1] Even after many district consolidations over the past century, we still have over 13,000 school districts, virtually every one with its own board.
Despite its ubiquity and durability, however, the local school board is actually a pretty weird political institution. Since the Progressive Era, most board elections have been designed to “de-politicize” education, and consequently, they are often uncontested and held in odd corners of the calendar when few people vote, which means they’re often dominated by candidates with ties to the education establishment.
Yet school boards are also an enigma. Another vestige of the Progressive Era is that their elections are typically nonpartisan, meaning the ideological leanings of school board candidates are less obvious than for candidates in most other elections. And discussions about teaching, learning, school effectiveness, and pupil achievement, which would seem to be a school board’s chief reason for existing, are often notably absent from these elections—and then from board agendas. The typical school board meeting is more often focused on problems such as facilities management and labor issues than on academics, even as board decisions increasingly intersect with larger political battles, often more preoccupied with culture war issues than on the “three Rs.”
At a time when the country faces acute achievement challenges—just look at the latest NAEP results!—this must be termed misguided if not tragic.
To better understand the state of school boards today, we turned to two seasoned experts, Boston College’s Michael Hartney and George Mason University’s David Houston, who responded to this challenge by conducting perhaps the most ambitious survey of school board members ever attempted. Their new survey, which includes data from more than 5,000 school board members in 3,093 distinct school districts, sheds light on who America’s school board members are today, what they believe, and how their perspectives compare with the general public. Helpfully, the researchers could compare board members’ responses to the beliefs of the American public, using questions modeled after those found in recent nationally representative surveys. They could also draw on the results of a 2001 survey of school board members that asked many of the same questions about their racial, ethnic, and other demographic identities, enabling comparisons of school board characteristics over time.
What emerges is a complicated portrait, with school board members relatively well-aligned with their constituents in some ways and notably less so in others. Hartney and Houston find that board members are, on average, much more likely to be White and college-educated than the nation as a whole. That is, in part, because of the country’s many small, rural and small-town school districts, which themselves are disproportionately White, but it holds even after adjusting for district size. The views of school board members, meanwhile, diverge from typical Americans on some important issues. For example, the report finds that board members are unusually hostile to charter schools, especially when compared to the public at large (and even more so when compared with Black adults). At the same time, school board members view the performance of their own districts through rose-colored glasses, grading them far higher than their constituents do.
Taken together, these findings reveal fundamental tensions at the heart of school governance, and they suggest that the nation’s most local form of democracy may, in important ways, be drifting out of step with its citizens.
Who Governs?
In terms of race and ethnicity, school board members look different from the nation as a whole. This is partly, but not entirely, because of America’s many rural and small-town school districts, which are disproportionately White. But that doesn't explain why school board members are even more out of sync with the nation's demographics than in the past, as this study finds (Table ES-1). Most notably, as America has become significantly more Hispanic in recent decades, the proportion of school board members who are Hispanic hasn’t budged, even as the share of members who are Black has fallen. This means that, while the percentage of Americans who are White is down 10 percentage points since 2001, the share of school board members who are White has actually risen during the same period. (The one bright spot in terms of demographics: The gender gap, which previously skewed male, has closed (Table ES-1).)
Table ES-1: School board members are more White and more educated than the public.
| Characteristic | Board Members (2001) | Board Members (2023) | Board Members Change (2001–2023) |
U.S. Public (2001) | U.S. Public (2023) | U.S. Public Change (2001–2023) |
| White, Non-Hispanic | 86% | 87% | +1% | 69% | 59% | -10% |
| Black, Non-Hispanic | 8% | 4% | -4% | 12% | 12% | +0% |
| Hispanic | 4% | 4% | +0% | 13% | 19% | +6% |
| Non-Listed Race/Ethnicity | 2% | 5% | +3% | 6% | 10% | +4% |
| Female | 40% | 52% | +12% | 51% | 50% | -1% |
| 4-Year College Degree | 29% | 35% | +6% | 16% | 21% | +5% |
| Postgraduate Degree | 38% | 46% | +8% | 9% | 14% | +5% |
| Current/Former Teacher | 13% | 25% | +12% | 3% | 3% | +0% |
Note: Board member proportions are based on nationally representative weighting. See Surveying School Board Members for more information on weighting. The 2001 estimates come from Hess and Leal’s survey.
Nationwide, there are similar proportions of Democrats, Republicans, liberals, and conservatives on school boards compared to all U.S. adults. However, once you account for district size, school board members lean further to the left than the U.S. public. Enrollment-weighted estimates of school board member ideology and party affiliation show that 35 percent of board members call themselves liberals and 55 percent–a majority–are Democrats. Among the U.S. public, just one in four identifies as liberal and 43 percent are Democrats.
This is not the first time that observers have noted a representational mismatch in American governance. Congress, for instance, has long been Whiter, more affluent, and better educated than the general public. But the fact that school boards exhibit similar gaps raises important questions about their legitimacy and responsiveness.
The Most Anti-Charter Group in the Country?
Perhaps even more troubling, board members’ beliefs and priorities are often out of step with that of their communities. The attitudes of board members toward charter schools are perhaps the starkest example. Simply put, with the exception of teachers' unions, school boards are likely the most charter-averse constituency in K–12 education.
The numbers are stark. Fifty-nine percent of board members oppose charter-school formation, while only 29 percent support it. Among the general public, the pattern is reversed: 45 percent support charters while just 36 percent oppose. The divide is even more pronounced when racial differences are taken into account. Black adults, for example, are 25 percentage points more supportive of charter schools than the average local board member.
Figure ES-1: Board members oppose charter schools far more than the public.
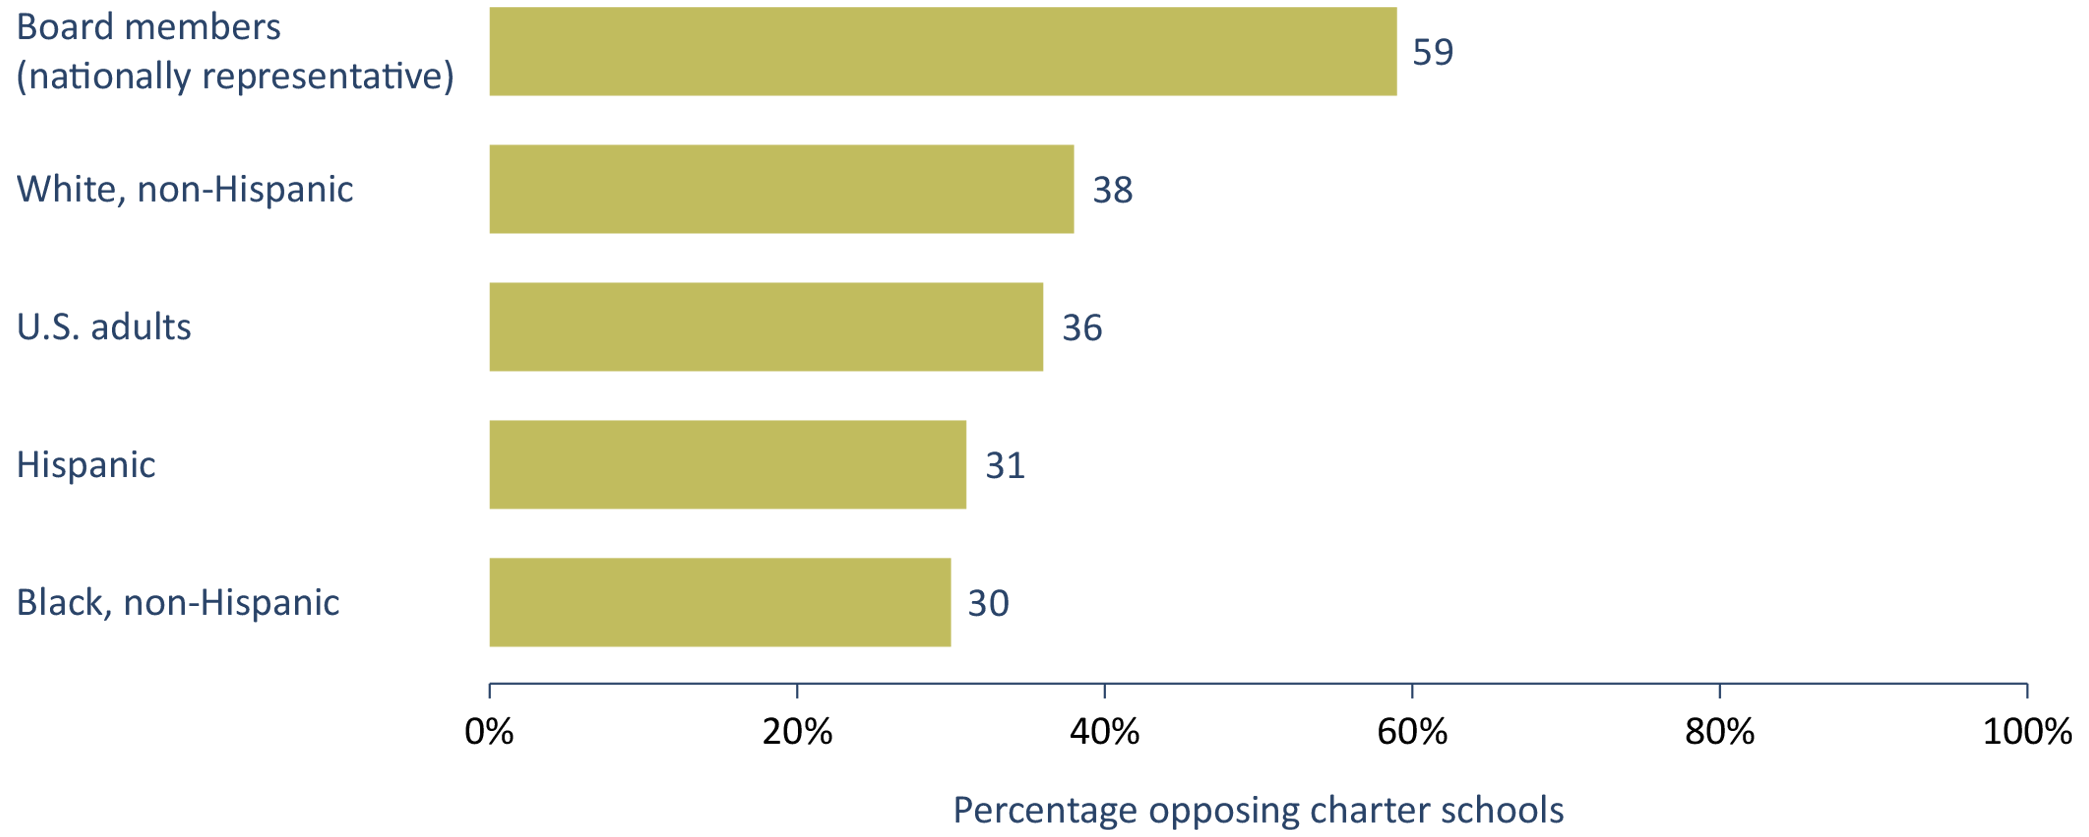
Note: Board member proportions are based on nationally representative weighting, see Surveying School Board Members for more information on weighting. Estimates for comparison groups are drawn from Education Next’s 2022 “Survey of Public Opinion.”
What explains this gap? Part of the answer may be institutional self-interest. Like unions, school boards likely view charters as the competition. Opposition to charters may thus reflect a defensive instinct to protect district enrollments, funding, and influence.
Other factors may be related to race and ideology. Given that board members are, on average, Whiter and more liberal than the communities they represent, skepticism toward charters aligns with broader partisan and demographic patterns in which White liberals are the most hostile demographic to charter expansion.[2] To the extent that boards position themselves as opponents of charter growth, they risk not only constraining parental choice but also alienating communities that see charters as a pathway to better opportunities.
Grade Inflation
Another critical finding is the stark gap between school board members and the public they serve when it comes to how they view their own schools.
When asked to grade their own districts, three-quarters of board members award an “A or B.” Among the general public, however, only about half grade their own schools so highly. That 25-point gap is not trivial. It suggests that those in charge see their schools in far rosier terms than do the parents and citizens on the ground.
Figure ES-2: Board members give their schools higher grades than the public does.
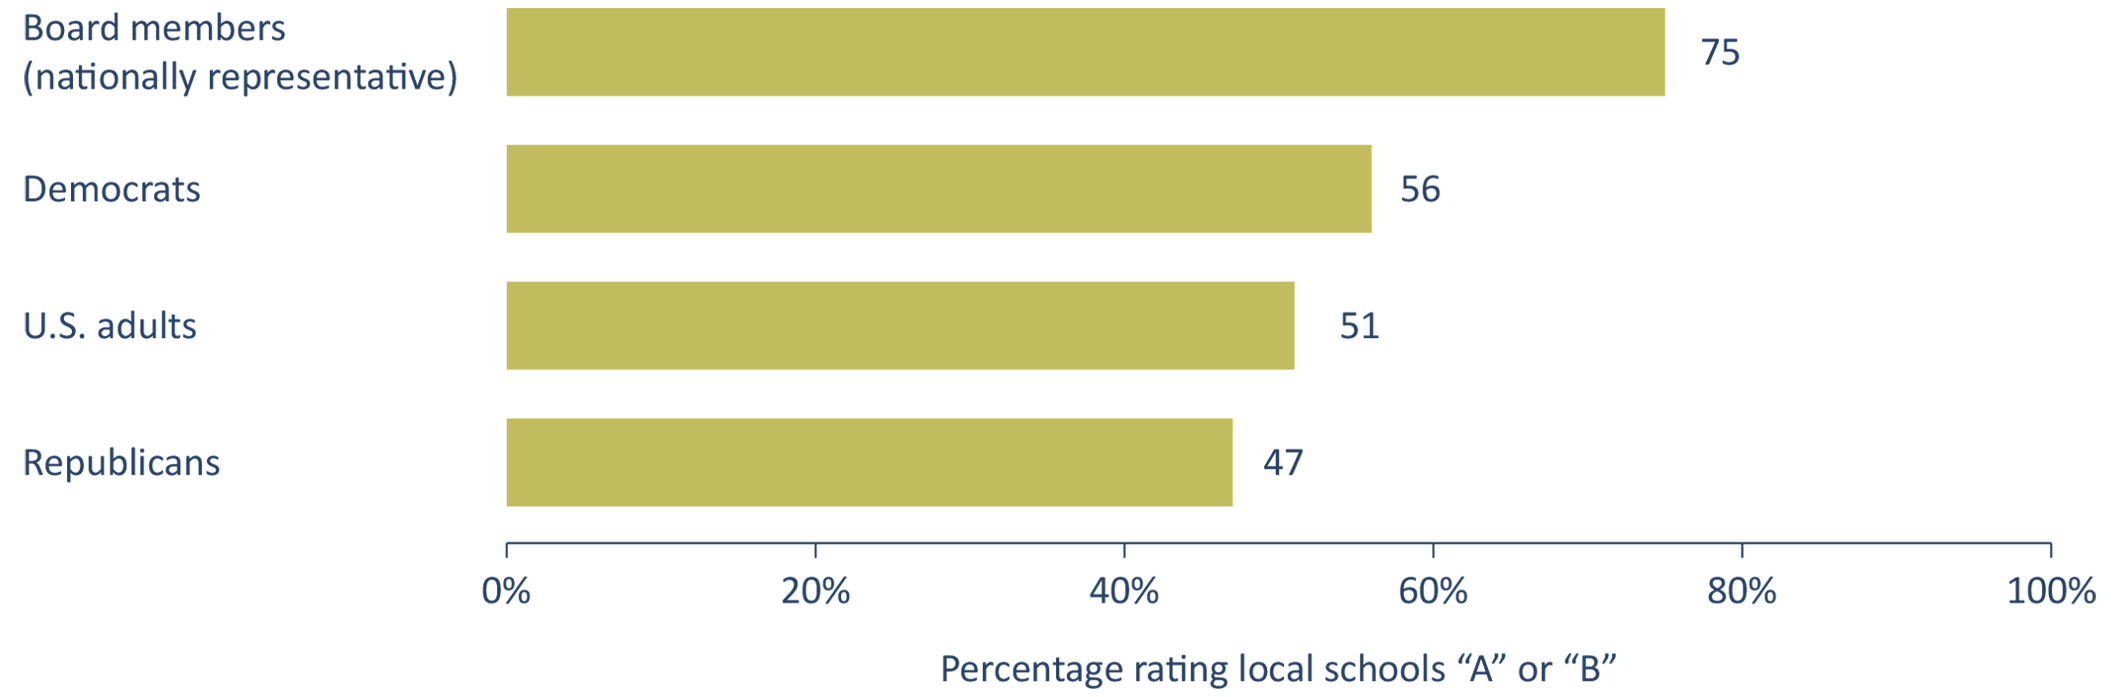
Note: Board member proportions are based on nationally representative weighting, see Surveying School Board Members for more information on weighting. Estimates for comparison groups are drawn from Education Next’s 2022 “Survey of Public Opinion.”
How could this be? It may be that board members are simply invested in the system and inclined toward institutional loyalty. Their close working relationships with superintendents, teachers, and administrators may predispose them to interpret data and outcomes in the most favorable light. And their higher levels of education may shape their standards for judgment in ways that differ from those of the broader public.
But whatever the reason, the consequences are significant. If board members consistently overestimate the quality of their districts, they may fail to recognize the urgency of reform in those same districts. They may dismiss parental complaints as outliers rather than indicators of systemic problems. And they may approve policies or budgets that assume satisfaction when dissatisfaction is widespread.
This grade inflation on the part of school board members is more than a psychological quirk. It is a governance challenge. It raises the possibility that school boards are insulated from the very feedback loops that democratic accountability is meant to provide. Thus, frustration at the grassroots is fueled by complacency at the top, a combustible combination in an era of heightened political polarization alongside faltering student achievement.
Reconnecting Governance to Communities
The findings of this bold and comprehensive study—including demographic distinctiveness, opposition to charters, and the mismatch in judging local schools—converge on a common theme: a widening disconnect between school boards and their constituents. As political scientist Vladimir Kogan notes in his recent book, partisan polarization in education has become “top-down, elite-driven,” which helps explain why boards may be increasingly untethered to community sentiment.[3]
For policymakers and reformers, the message is clear. Efforts to strengthen school performance and results-driven accountability must grapple with the fact that today’s boards are not always reliable proxies for community sentiment. Initiatives to expand educational choice must anticipate resistance from boards even when demand from families is strong.
If we want America’s local school boards to actually embody the democratic spirit and come closer to representing the views of the communities they serve, we may need to make them more democratic. That would mean rethinking reforms that may have made sense a century ago but that are no longer working very well. For example, perhaps school board elections should shift to November and to even-numbered years. Candidates should be a lot more transparent about their views of district performance and what needs to change. State and local ed-reform groups and advocates—and the media—should become far more attentive to who is running, what their agenda is, and where they’re coming from.
More politics and transparency might sound like a strange prescription for our polarized and noisy time, but it may just be the cure for a system that has become unrepresentative, unresponsive, and unwilling to embrace change.
Introduction
In 2020 and 2021, at the height of the COVID-19 pandemic, school board meetings in Loudoun County, Virginia, became increasingly hostile, disorderly, and even violent. Parents, community members, and nonresidents drawn to the fray argued bitterly about school closures, online instruction, how educators ought to teach about race and racism, a school mascot named after a Confederate battalion in the Civil War, transgender students’ use of school facilities, and—most incendiary of all—a sexual assault that some contended was enabled by the district’s transgender bathroom policy. (The assault, according to a later court hearing, predated the policy.) Media outlets descended on these meetings, casting Loudoun County as one of the epicenters of politically polarizing pandemic-era grievances about K–12 education. The conflict even played a key role in the 2021 Virginia gubernatorial election as the candidates debated the nature of parental involvement in local education-related decision-making.[4]
School boards, as elected political bodies, are supposed to represent the values and interests of their constituents as they lead their local public schools. But what would effective representation look like in a context like this, in which disagreement turned into discord and, in some instances, mere dislike curdled into antipathy?
This incident, and many others like it, sparked our curiosity about the current state of political representation and school-board governance during these turbulent and divisive times. The conflicts in Loudoun and elsewhere made us worried about the health of local school governance. However, as researchers—both of us were trained as political scientists—we felt the need to take a step back from the conventional media narrative and review the evidence more systematically. We wanted to know the extent to which school board members around the country reflect the political and demographic compositions of their idiosyncratic communities. We also wanted to examine the degree of correspondence between school board members’ attitudes on a range of recent controversial education issues and those of their constituents. Lastly, we wanted to learn how school board members characterize the political environment that shapes their elections and whether those environments have changed in recent years.
We combed through the existing scholarly literature and found only a handful of large-scale surveys of school board members over the past twenty-five years and very few conducted since the start of the pandemic. Moreover, when exploring the degree to which board members were similar to or different from the broader public, these studies focused primarily on nationwide comparisons. The insights from these earlier analyses were valuable—they offered a clear picture of U.S. school board members as a group, their views, and their priorities—but they did not help us answer our questions about local representation. Therefore, we set out to conduct an original empirical analysis of the nation’s school boards. We recruited over 5,000 board members to complete a brief survey about their political and demographic identities, as well as their views on a set of contemporary hot-button education issues. Crucially, we also linked these board members’ responses to publicly available information on their school districts’ demographic characteristics and political leanings, allowing us to explore the extent to which board members align with their constituents along these dimensions.
In short, we found some noteworthy divergences between America’s school boards and the communities they serve—although these differences are, perhaps, smaller than one might expect, given the long-standing institutional buffers in place to cushion local school governance from many broader political pressures. Contrary to the conventional wisdom, when it comes to some of the culture war issues related to race and gender that animated the fierce conflict in Loudoun County, we actually found relatively high levels of alignment between board members and their communities. What’s more, the overemphasis on these emotionally charged and politically polarizing issues may be obscuring larger divides that we uncovered on some of the other, less explicitly partisan issues that still matter immensely to students, families, educators, and the board members elected to represent them.
School Boards and Their Communities
School boards are unusual political institutions in the American context. School districts are local governments, but they are typically separate jurisdictions from the governments of the municipalities and counties in which they are located. The tradition of establishing two parallel local governments—one for education and one for essentially everything else—dates to Massachusetts in 1826 before spreading nationwide.[5] Many of the other distinctive features of school board governance, such as formally nonpartisan elections held at times other than November of even-numbered years and the delegation of most day-to-day operational oversight to a board-appointed superintendent, emerged during the Progressive Era at the turn of the 20th century. These reforms were ostensibly meant to buffer K–12 education from the partisan politics and the patronage system of the day.[6]
But the rallying cry of Progressive Era reformers to “keep schools out of politics” was always a bit misleading.[7] It was arguably more a matter of whose politics would dominate. The Progressive movement was mostly White, upper-middle-class, and Protestant. Nonpartisan, off-cycle elections and the appointment of professional superintendents tended to disempower the urban political machines that had successfully mobilized the votes of newly arrived immigrant communities in exchange for jobs in schools and other public services. Depending on one’s perspective, Progressive Era reforms to school board governance could be billed either as efforts to support professional competence over political corruption or as an attempt to concentrate power in the hands of a favored ethnic and cultural group.[8]
Political Representation
In other words, school boards have long been engineered to be at least a little unrepresentative of their communities. The manner in which they are elected—usually without party labels and at separate times from broader municipal, state, and federal elections—is arguably intended to prioritize educational expertise (or one such vision of it) at the expense of greater integration into local majoritarian politics. Indeed, the stated motivation for recent efforts to institute formally partisan elections or to move election dates to November in even-numbered years is to tighten the linkage between school boards and the general electorate.[9]
Whether it is good or bad for school boards to mirror the electorate is far from a straightforward question. One could imagine a whole host of reasons it might be desirable for school boards to operate at an arm’s length from the rest of American politics—particularly in our contemporary era of polarization and heightened animosity between the two major parties.[10] On the other hand, if boards become too unrepresentative of their communities, they run the risk of losing legitimacy in the eyes of voters.
Political representation is a multidimensional concept—arguably one of the most central and contested ideas in modern political philosophy. We focus on a few narrow but important elements of representation in a democracy: the alignment between elected officials’ and constituents’ social identities (which scholars often refer to as “descriptive representation”), the alignment between elected officials’ and constituents’ political and policy preferences (which is one aspect of what scholars call “substantive representation”), and the nature of electoral competition, all within the context of public schooling.
Admittedly, political representation can also include a lot more than these three things. An elected body that matches the partisan, ideological, racial, and gender composition of its constituents is not guaranteed to reflect citizens’ policy views. Even if there is a high degree of correspondence on the issues, elected officials might emphasize one set of concerns over another even if the public’s priorities are reversed. Moreover, most democratic contexts are predicated on the balance between majority rule and minority rights. An elected body that exhibits perfect alignment with the majority might still be unresponsive if it disregards established protections for other groups. The aspects of representation that we consider here do not, by any means, constitute a comprehensive and definitive account of school board representativeness. Our analysis, nevertheless, offers a valuable empirical window into a debate more often dominated by anecdote and conjecture than by data.
Others might question our emphasis on representation altogether, asking something along the lines of, “Why should we care whether school board members’ party affiliations or racial identities match those of their constituents? Shouldn’t we be more concerned about students’ academic performance?” We completely agree on the importance of evaluating school boards in terms of educational outcomes. That said, reaching consensus on the desired outcomes and the optimal method for achieving them is often elusive, necessarily involves multiple strategies and metrics, and inevitably requires navigating unavoidable tensions and trade-offs. Democratic representation is not the only way to adjudicate these questions, but it is the primary mechanism available to elected school boards. Moreover, stronger representation can also cultivate greater trust between communities and their school leaders in an era in which the public’s satisfaction with public education has declined.[11] We contend that representation is one element of a broader conceptualization of board performance—one that has the potential, although not the assurance, to facilitate and advance other elements.
Most of the existing research on school board representation has focused on board members’ and constituents’ demographic identities. That research has found that school board members tend to be Whiter, wealthier, and better educated than the public as a whole.[12] Studying school boards in California, researchers have found that greater representation of people of color on school boards is associated with increased spending and improved academic outcomes, especially for students of color.[13] Additionally, researchers have observed large racial and ethnic differences between the voters in school board elections and the students enrolled in public schools, with larger representational gaps associated with larger gaps in standardized test scores between racial/ethnic groups.[14] Using a type of survey experiment that can reveal socially sensitive opinions, researchers have demonstrated that many school board members feel little political pressure to raise academic outcomes for students of color.[15] More broadly, greater demographic correspondence between the public and its elected officials is associated with increased political participation and the perception that constituents’ opinions matter to their political leaders.[16]
A few studies have used data on school board members’ beliefs and policy preferences to dig deeper into questions of political representation. One study, for example, explored the correspondence between California school board members’ attitudes on a range of education issues and various measures of their constituents’ political leanings, finding higher rates of alignment in school districts with elections scheduled in November of even-numbered years.[17] Importantly, board members’ views on education policy have real consequences for boards’ decisions and student outcomes. For example, when school board candidates who prioritize educational equity win narrow elections, average test scores for economically disadvantaged students tend to rise in the following years.[18]
The results of national surveys of school board members—including surveys in 2001,[19] 2009,[20] 2013,[21] and 2018[22]—paint a fairly consistent portrait: School board members, as a group, are not dramatically different from the U.S. public as a whole, although they are somewhat wealthier, more likely to have gone to college and to have been an educator, and less likely to be Black or Hispanic. Board members, according to these reports, also tend to embrace a less ideological brand of politics, with a plurality defining themselves as moderates.
However, a lot has changed in the politics of education—and American politics more broadly—since 2018. Most major surveys predate the nationwide shuttering of K–12 schools at the start of the COVID-19 pandemic, the staggered reintroduction of in-person instruction as the pandemic continued, the rapid expansion of state-level private-school choice programs, and the eruption of culture-war conflict over matters related to race, gender, and sexuality in K–12 classrooms. With the exception of the initial pandemic-induced school closures, all of these developments exhibited stark partisan divides that were previously much more common in other domestic policy domains than in K–12 education.[23] With the changing political context in mind, we wanted to know: What does school board political representation look like today?
Surveying School Board Members
For our project, we reached out to nearly every school board member in the country. Although there is no national directory of school board members, their names and email addresses are publicly available information, scattered across the internet on school district websites. In 2022, the America First Policy Institute (AFPI)—with which we have no affiliation—completed the laborious task of combing school district websites for school board members’ names and email addresses, aggregating this information on its website. Of the approximately 80,000 entries collected by AFPI, we found 61,299 individuals with unique, viable email addresses and with school district affiliations that matched the National Center for Education Statistics’ records of school district names. We emailed these 61,299 people in December 2022 and again in January 2023, introducing ourselves, explaining our research project, and detailing the way in which we would keep their responses as anonymous as possible—namely, how we would destroy all files linking names or email addresses to responses and not report any district-level results that would allow readers to make inferences about specific board members’ identities or views. A total of 5,346 individuals from 3,093 school districts completed our survey, for a response rate of 8.7 percent.[24]
Weighting
The subset of school board members who responded, though relatively large in number and as a proportion of all U.S. school board members, presented us with two challenges. First, although respondents hail from a wide variety of districts drawn from nearly every U.S. state, these individuals are not a random sample of all school board members nationwide.[25] Second, it is important to remember that the majority of the more than 13,000 school districts in the U.S. are small, rural, and sparsely populated; meanwhile, the majority of students are concentrated in a subset of more densely populated urban and suburban districts.
Therefore, we chose to adjust our survey data in two different ways.[26] Our first approach tries to make our sample more representative of all school board members in the country. We calculated a specific weight for each respondent based on district-level characteristics such as total student enrollment, the percentage of enrolled students who are White, the percentage of school-age children living in poverty, and the population density of the district. Therefore, when analyzing the data using these weights, the proportion of school board members serving relatively small, low-income, White, and sparse districts in our sample is large, matching the proportion of such districts in the nation. The analyses using these weights provide the best available picture of America’s school board members as a group, and we describe our results as “nationally representative.” When reporting specific values from these analyses, we use language such as “__ percent of school board members identify as X” or “__ percent of school board members believe Y.”
Because relatively small, rural, low-income, White, and sparse districts are such a large share of districts overall, we are also interested in a weighting approach that better reflects the actual distribution of students around the country. Our second approach focuses, therefore, on the number of students served by each school board member. For these analyses, we simply weight each board member’s response by the total count of students enrolled in their district. This approach gives greater weight to board members representing larger districts and less weight to board members representing smaller districts. For example, a board member serving 10,000 students would receive twice as much emphasis as a board member serving 5,000 students. When using these weights, we describe our results as “enrollment-weighted.” When reporting specific values from these analyses, we use language such as “school board members representing __ percent of students identify as X” or “school board members representing __ percent of students believe Y.”
Additional Data
We then combine our survey data with other sources of information to compare school board members with their constituents. For example, we deliberately modeled some of our survey language after similar questions in nationally representative surveys, such as the Education Next Survey of Public Opinion and the Cooperative Election Study. We pair our survey data with publicly available data on the demographic characteristics of the U.S. public and U.S. school districts from the U.S. Census Bureau’s American Community Survey and Household Pulse Survey, the U.S. Department of Education’s Common Core of Data, and the U.S. Bureau of Labor Statistics. We also use data from the survey research firm Gallup for estimates of the party affiliations and political ideologies of U.S adults circa 2023 and data from the Redistricting Data Hub for precinct-level results from the 2020 presidential election.
School Board Members’ Political Identities
We collected an enormous amount of information about U.S. school board members and the communities they serve—generating more findings than we could ever hope to convey in a single report. We focus here on what we think are our most important findings, which challenge some of the received wisdom from earlier studies and contemporary media reports. The following sections break down and provide some additional context for each of these key findings. (More comprehensive results are included in the Appendix.)
Finding 1. Nationwide, school board members’ party affiliations and political ideologies align closely to the U.S. public’s.
Although the vast majority of school board seats are formally nonpartisan, 88 percent of school board members identify with or lean toward one of the two major political parties—identical to the percentage of the U.S. adult population that does so. In our survey, we asked each board member whether they identify as a Republican, a Democrat, or an independent. As is customary in survey research on political partisanship, we posed a follow-up question to individuals who initially declined to provide a party affiliation, asking whether they felt closer to one party or the other. If so, we included them with their party of choice.[27]
Figure 1 compares the party affiliations and political ideologies of school board members with those of U.S. adults as a whole (see also Table A1 in the Appendix). Roughly 41 percent and 24 percent of school board members identify as Democrats and liberals, respectively, compared with 43 percent and 25 percent of U.S. adults. Similarly, 47 percent and 37 percent of board members identify as Republicans and conservatives, compared with 45 percent and 36 percent of U.S. adults. About 12 percent of board members identify as independents (the same percentage as that of the U.S. adult population), and 39 percent of board members describe themselves as moderate (just a few percentage points higher than the percentage of the U.S. adult population).
In short, alignment on party affiliation and political ideology is remarkably close between school board members and the nation as a whole—within three percentage points in every category. When viewed as a group, the political identity of U.S. school board members almost perfectly mirrors that of the broader U.S. public.
Figure 1: Nationwide, school board members’ party affiliations and political ideologies align closely to those of the U.S. public.

Note: The full sample of school board members consists of 5,205 individuals; the sample size varies for each question. Board member (nationally representative) estimates are weighted so that the school districts represented by the individuals in our sample are representative of all districts nationwide with respect to student enrollment, the percentage of enrolled students who are White, the percentage of school-age students living in poverty, and population density. “Democrat” and “Republican” include individuals who indicated that they lean toward the respective party. Nationwide estimates of party affiliation and political ideology are collected from Gallup.
Finding 2. Students are disproportionately represented by school board members who are moderates, liberals, and/or Democrats.
However, it is important to remember that nearly every school district has its own board and that most districts in the U.S. are in relatively rural communities. Most students, on the other hand, are concentrated in a smaller subset of more densely populated urban and suburban districts. When we reconsider board members’ political identities in proportion to the number of students they serve, the comparison looks a little different. Enrollment-weighted estimates of board member demographics indicate that board members representing 55 percent of students identify as Democrats, board members representing 35 percent of students identify as Republicans, and board members representing 10 percent of students identify as independents. Meanwhile, board members representing 35 percent, 25 percent, and 40 percent of students describe themselves, in turn, as liberal, conservative, and moderate.
Figure 2 compares these values with those of the U.S adult population (see also Table A1 in the Appendix). The typical student attends school in a district led by a school board member who, compared with the average U.S. adult, is more likely to be a Democrat (+12 percentage points), liberal (+10 percentage points), or moderate (+4 percentage points) and is less likely to be a Republican (-10 percentage points), an independent (-2 percentage points), or conservative (-11 percentage points).
Figure 2: Students are disproportionately represented by school board members who are moderates, liberals, and/or Democrats.

Note: The full sample of school board members consists of 5,205 individuals; the sample size varies for each question. Board member (enrollment-weighted) estimates are generated by positively weighting board members by the number of students enrolled in their districts. “Democrat” and “Republican” include individuals who indicated that they lean toward the respective party. Nationwide estimates of party affiliation and political ideology are collected from Gallup.
Finding 3. Two-thirds of school board members match the partisan leanings of their districts.
Both of the prior two analyses compare school board members with the country as a whole. Illuminating as such comparisons can be, they do not tell us much about the extent to which board members’ political identities line up with those of their own communities. To answer this question, we used the precinct-level results from the 2020 presidential election to calculate the two-party vote share for each school district in the country (i.e., the percentage of votes for Joe Biden and the percentage of votes for Donald Trump, omitting third-party candidates). We considered a school board member a “match” if (A) they identified as a Republican and Trump won more than 50 percent of the vote in their district, (B) they identified as a Democrat and Trump won less than 50 percent of the vote in their district, or (C) they identified as an independent and neither candidate won more than 60 percent of the vote in their district. Although vote choice is not the same thing as party affiliation—a self-identified partisan may sometimes vote for a candidate from the other party—the vast majority of Democrats and Republicans (about 85 percent) vote for their parties’ respective presidential nominees.[28]
Figure 3 displays the results of this analysis (see also Table A2 in the Appendix). Approximately 65 percent of school board members share a party affiliation with the majority of the voters in their district. However, these board members represent a slightly higher percentage of students (71 percent). This pattern suggests that board–citizen mismatches are not the norm but they are also not uncommon. Moreover, these mismatches may be more common in less populated districts.
Figure 3: Two-thirds of school board members—representing seven in ten students—match the partisan leanings of their districts.

Note: The full sample of school board members consists of 5,205 individuals; the sample size varies for each question. Board member (nationally representative) estimates are weighted so that the school districts represented by the individuals in our sample are representative of all districts nationwide with respect to student enrollment, the percentage of enrolled students who are White, the percentage of school-age students living in poverty, and population density. Board member (enrollment-weighted) estimates are generated by positively weighting board members by the number of students enrolled in their districts. District-level partisan composition is derived from precinct-level results of the 2020 presidential election, available from the Redistricting Data Hub.
School Board Members’ Demographic Identities
Finding 4. Nationwide, school board members are much more likely to be White, to have a college degree, and to have been a teacher than the U.S. public in general. Weighting the results by district enrollment, however, lessens the racial/ethnic disparities between boards and the population.
Like previous surveys of school board members,[29] ours finds that school board members diverge demographically from the general U.S. population in some important ways. The top panel of Figure 4 compares school board members with the U.S. public on a wide range of demographic characteristics (see also Table A1 in the Appendix). Compared with the public as a whole, board members are more likely to be White, to have graduated from college (especially with a postgraduate degree), and to have been a teacher. Fully 87 percent of school board members identify as non-Hispanic White, compared with 59 percent of U.S. residents—a twenty-eight-point gap. About 81 percent of board members have at least a bachelor’s degree, and nearly half have a postgraduate degree, compared with 35 percent and 14 percent, respectively, of U.S. adults age 25 or older. Similarly, 25 percent of school board members indicate that they are a current or former public-school teacher, compared with 3 percent of U.S. adults in the workforce. In contrast, the gender composition of school board members roughly matches the gender composition of the U.S. public.
In order to understand how these patterns have shifted over time, we also compare our estimates with the analogous values from the 2001 survey by Frederick Hess and David Leal. In terms of race and ethnicity, school board members look remarkably similar over the years despite the fact that the U.S. and its public schools have grown much more diverse. According to the 2001 survey, boards were 86 percent White, 8 percent Black, 4 percent Hispanic, and 2 percent non-listed races and ethnicities. Meanwhile, in 2023, our estimates indicate that boards were 87 percent White, 4 percent Black, 4 percent Hispanic, and 5 percent non-listed races and ethnicities. Nationwide, the representation gaps for communities of color have grown fairly large. The U.S. population as a whole is 12 percent Black (meaning there is an eight-percentage-point gap between board members and the public), 19 percent Hispanic (a fifteen-point gap), and 11 percent non-listed races and ethnicities (a nine-point gap).
Figure 4: Nationwide, school board members are much more likely to be White, to have a college degree, and to have been a teacher than the U.S. public. These differences have grown larger over the past twenty years.
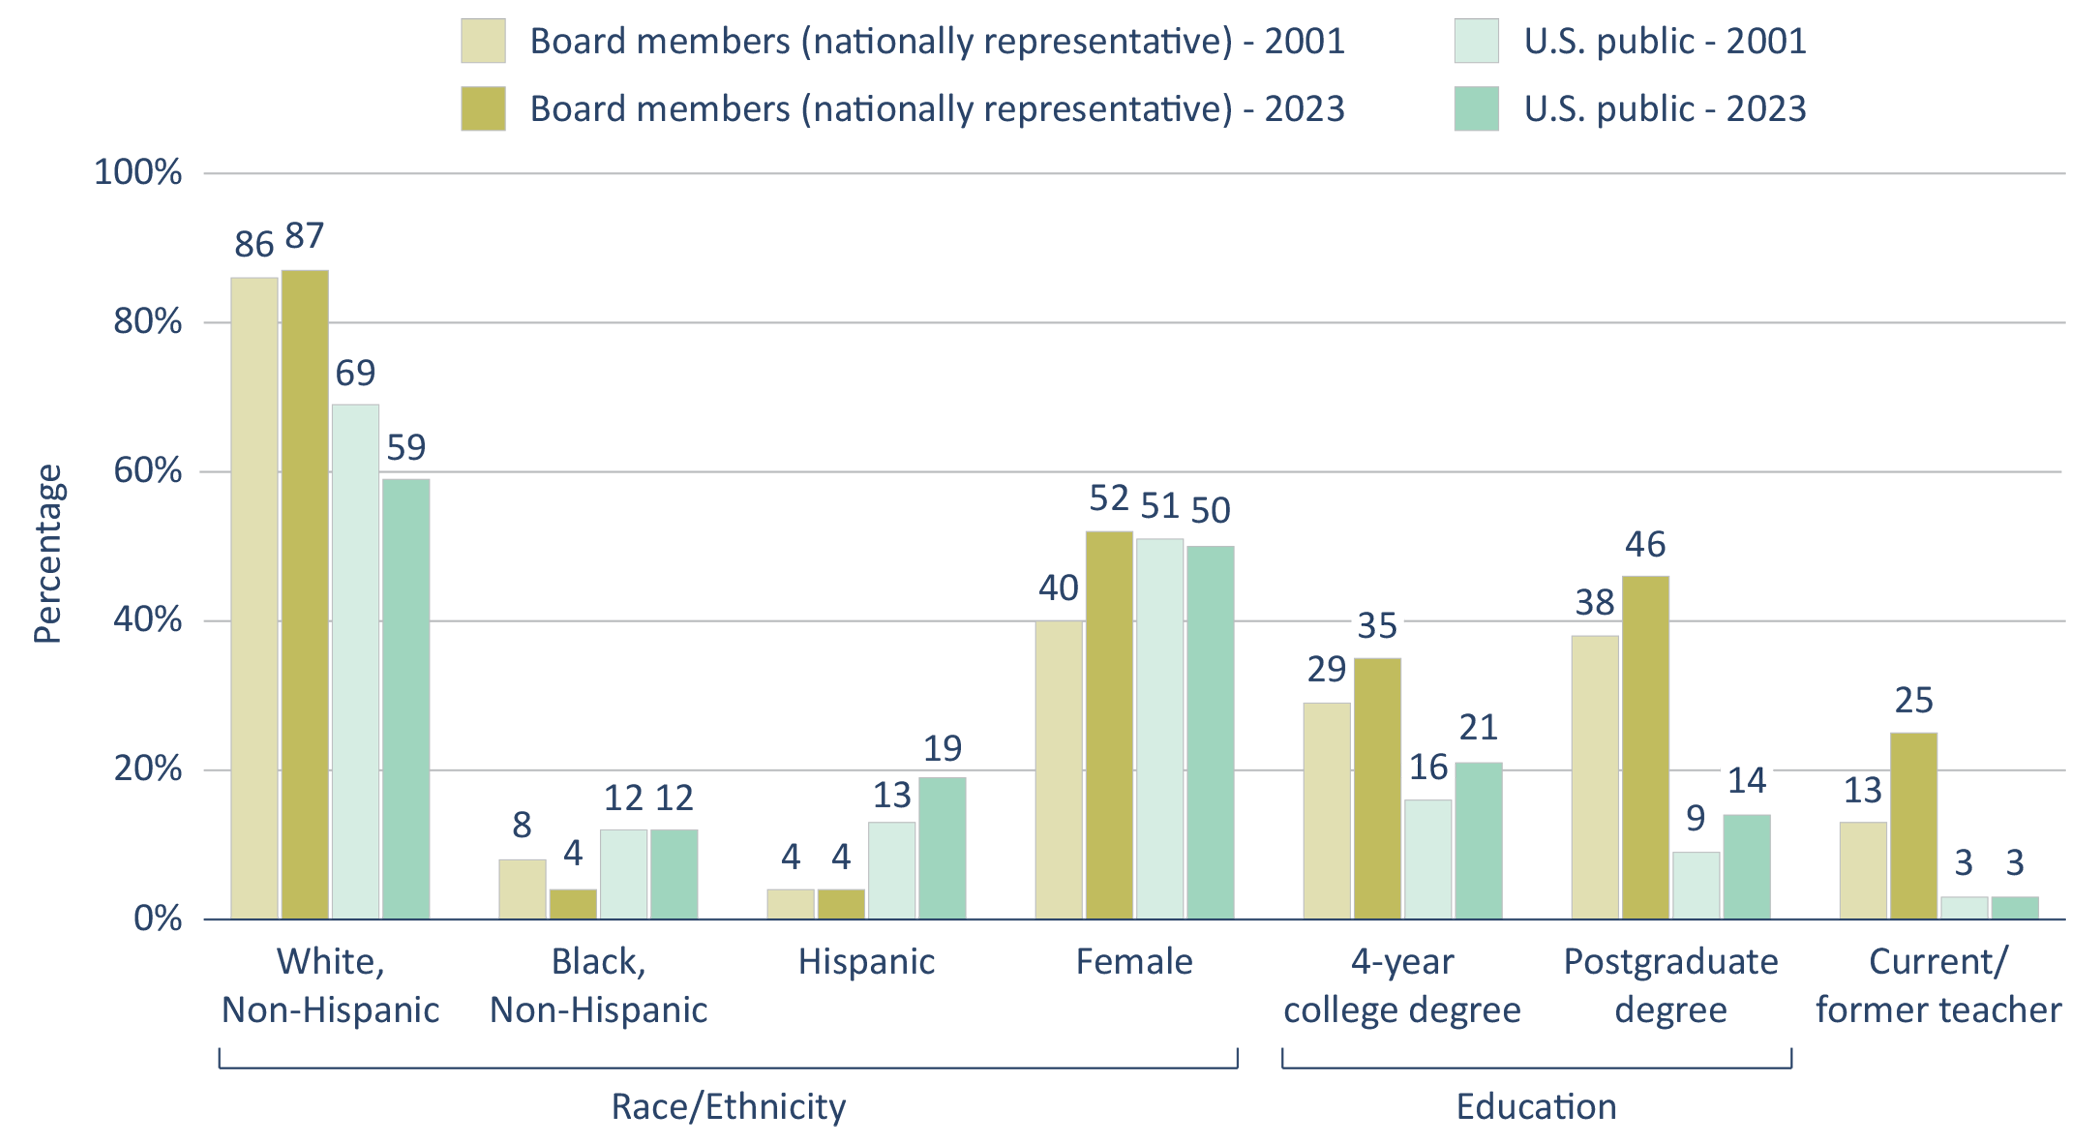
Note: The full sample of school board members consists of 5,205 individuals; the sample size varies for each question. Board member (nationally representative) estimates are weighted so that the school districts represented by the individuals in our sample are representative of all districts nationwide with respect to student enrollment, the percentage of enrolled students who are White, the percentage of school-age students living in poverty, and population density. Nationwide demographic estimates are collected from the 2000 U.S. Census, the U.S. Census Bureau’s 2018–2022 American Community Survey five-year estimates, the U.S. Census Bureau’s January–April 2024 Household Pulse Survey, and 2023 numbers from the U.S. Bureau of Labor Statistics (sum of preschool, elementary, middle, secondary, and special education teachers—not exclusive to public schools).
Alternatively, we observe notable shifts with respect to gender, educational attainment, and board members’ professional backgrounds. The 2001 survey found that six in ten board members were male. In contrast, in 2023, we found evidence of gender parity. On the other hand, school board members are more likely to have graduated from college than ever before. In 2001, the Hess and Leal survey reported that about two in three board members had a four-year college degree. In 2023, that proportion was four in five. Similarly, 13 percent of board members who responded to the 2001 survey said they had a professional background in education. We posed a slightly more specific question to our survey participants by asking whether they were a current or former teacher. Fully 25 percent of board members said they were—a twelve-percentage-point increase that potentially underestimates the rise in the proportion of school board members with a teaching background.
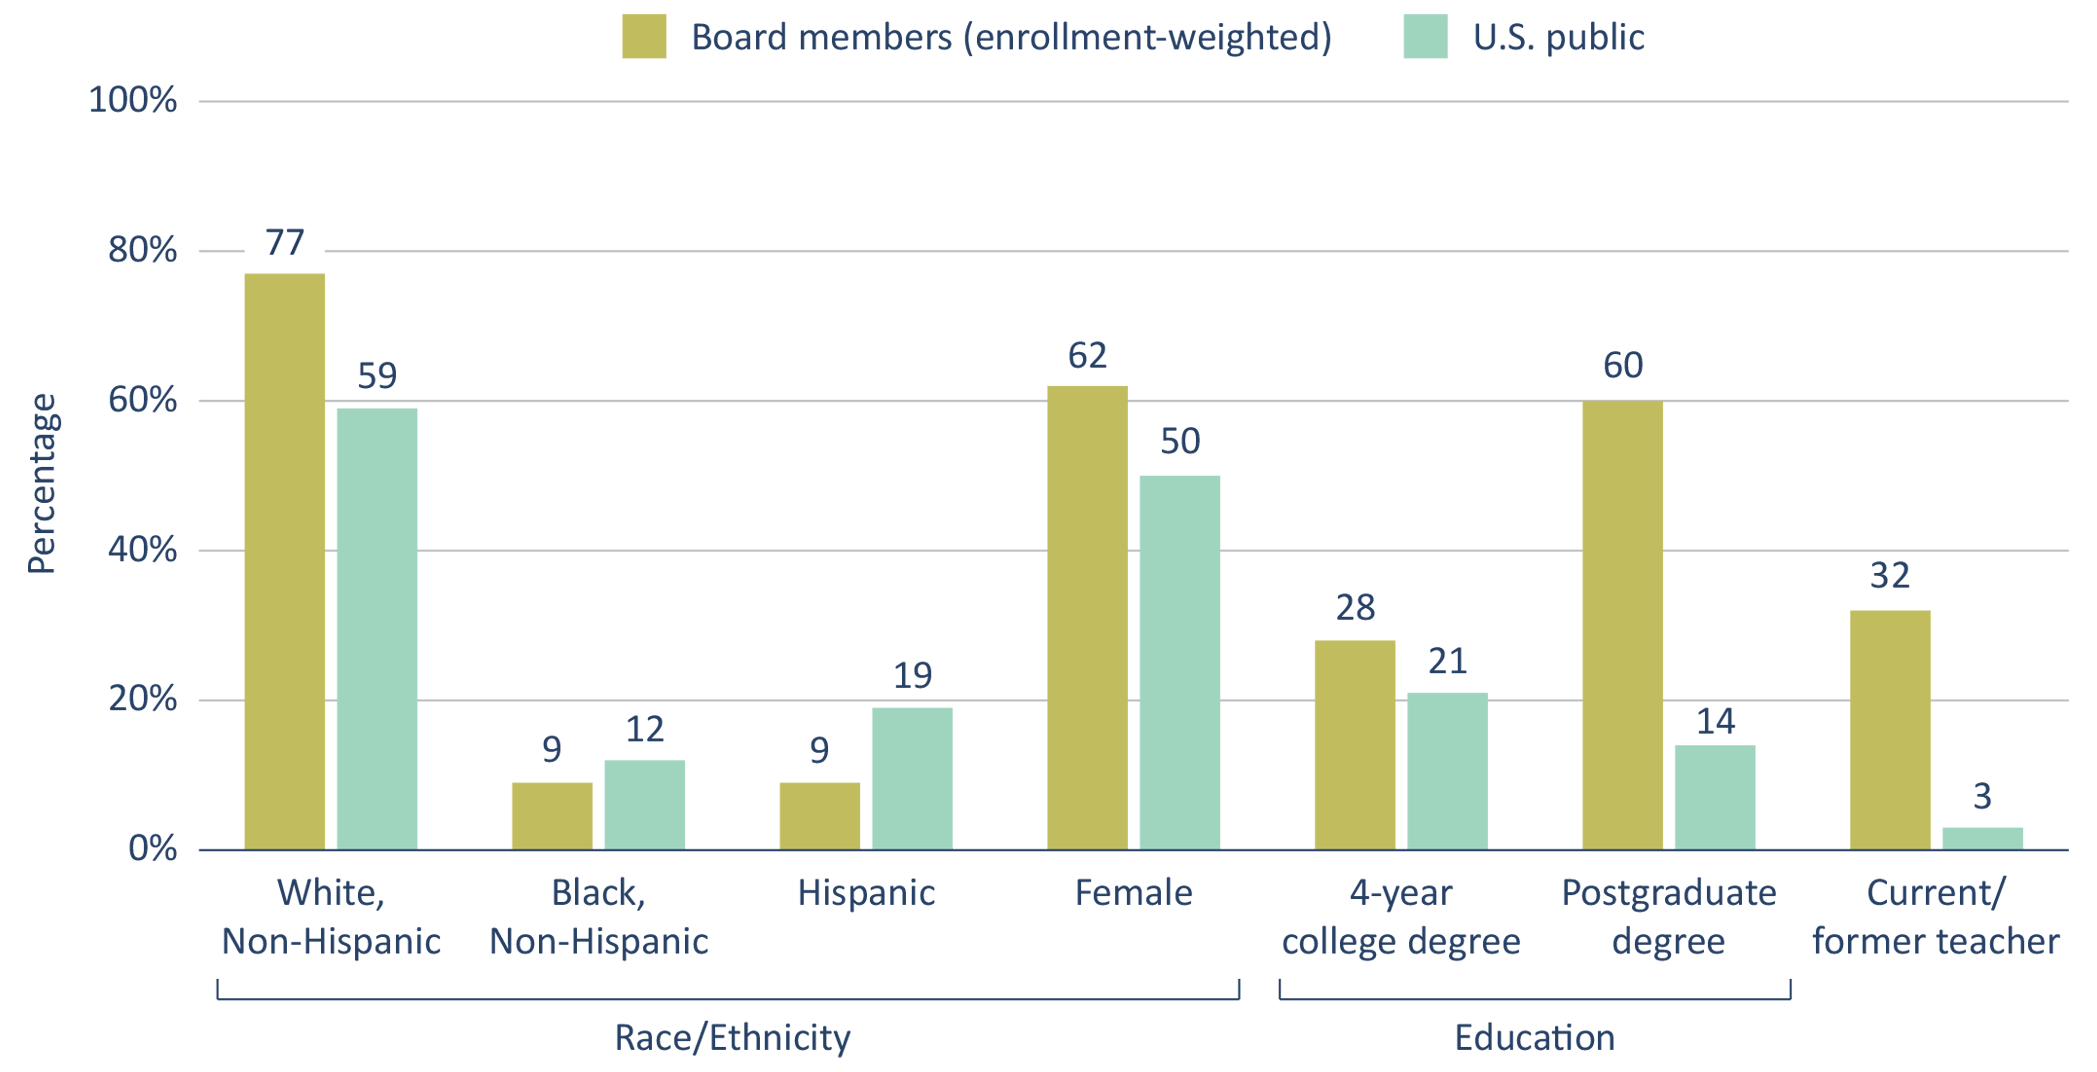
Because such a large proportion of school board members represent smaller, more rural, and often Whiter communities, a simple nationwide comparison tends to overstate the racial and ethnic differences between board members and the public. The analyses displayed in Figure 5 reexamine board members in terms of the proportion of students they serve (see also Table A1 in the Appendix). When we weight by enrollment, we find that board members representing 77 percent of students identify as non-Hispanic White, reducing the twenty-eight-point racial/ethnic gap between board members and the public to an eighteen-point gap—still substantial but not quite so severe as suggested by our initial analysis. Meanwhile, board members representing 9 percent of students identify as non-Hispanic Black, board members representing 9 percent of students identify as Hispanic, and board members representing 5 percent of students identify as another race or ethnicity. Even after weighting by student enrollment, however, the representation gap for the Hispanic community remains quite large. The proportion of students represented by Hispanic school board members is ten percentage points lower than the actual proportion of Hispanic residents in the U.S.
Figure 5: The racial/ethnic disparity is less severe when accounting for the number of students that school board members serve.
Note: The full sample of school board members consists of 5,205 individuals; the sample size varies for each question. Board member (enrollment-weighted) estimates are generated by positively weighting board members by the number of students enrolled in their districts. Nationwide demographic estimates are collected from the 2000 U.S. Census, the U.S. Census Bureau’s 2018–2022 American Community Survey five-year estimates, the U.S. Census Bureau’s January–April 2024 Household Pulse Survey, and 2023 numbers from the U.S. Bureau of Labor Statistics (sum of preschool, elementary, middle, secondary, and special education teachers—not exclusive to public schools).
The unequal distribution of students across districts also reshapes our understanding of gender and educational alignment. Board members representing about six in ten students are female, suggesting that the boards of more populous school districts have slightly higher proportions of women. Board members representing another six in ten students have a postgraduate degree, which implies that the boards of larger districts have dramatically higher concentrations of advanced degrees than the U.S. adult population. Board members representing about one in three students are current or former teachers.
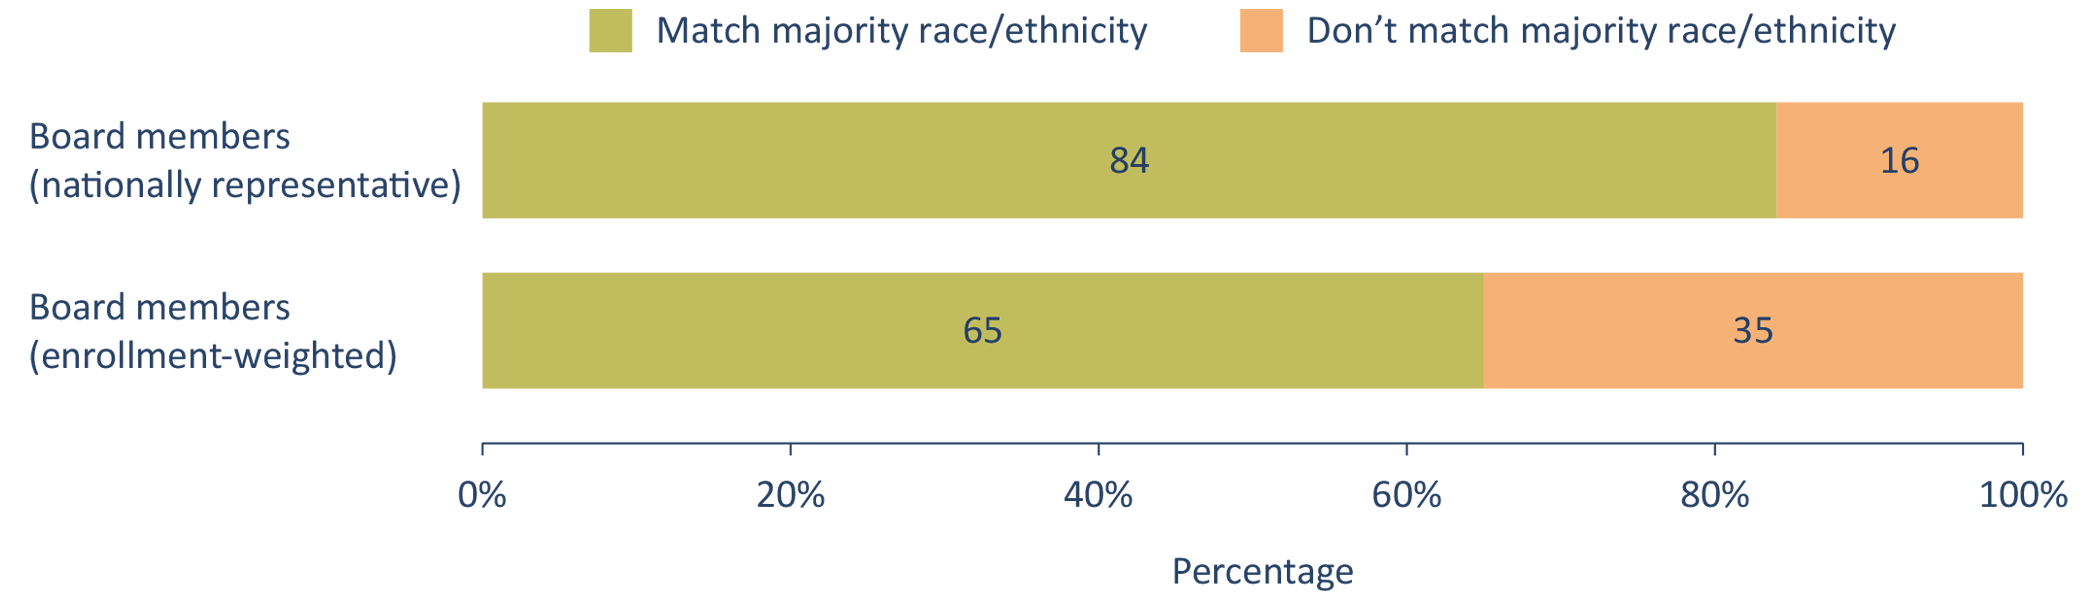
Of course, when it comes to representation, the comparisons that we care most about are between board members and their own constituents. Figure 6 shows the “matching” rates for school board members with respect to race and ethnicity (see also Table A3 in the Appendix). We find that over four-fifths of board members are of the race/ethnicity that is most common among their residents. However, a sizable portion of such matches appear to occur in less populated—and presumably Whiter—districts. That share drops to two-thirds when weighting by district enrollment. In other words, board members in larger school districts are less likely to share the same race/ethnicity as the majority of the residents in their communities.
Figure 6: Over four-fifths of board members are of the race/ethnicity that is most common among their residents, but such board members represent only two-thirds of all students.
Note: The full sample of school board members consists of 5,205 individuals; the sample size varies for each question. Board member (nationally representative) estimates are weighted so that the school districts represented by the individuals in our sample are representative of all districts nationwide with respect to student enrollment, the percentage of enrolled students who are White, the percentage of school-age students living in poverty, and population density. Board member (enrollment-weighted) estimates are generated by positively weighting board members by the number of students enrolled in their districts. District-level demographic estimates are collected from the U.S. Census Bureau’s 2018–2022 American Community Survey five-year estimates.
School Board Members’ Attitudes Toward Education Issues
Finding 5. School board members’ opinions on some high-profile education issues differ from those of the U.S. public.
One of the unique features of our survey is that we asked school board members a handful of questions about education policy using the exact same wording employed by other surveys of the broader U.S. public. This enables us to make direct comparisons on salient education issues between ordinary Americans and the elected officials who oversee the nation’s school districts. We focus here on seven issues that represent some of the key fault lines in contemporary political conflict over K–12 education (see the Appendix for full question wordings):
- Local school quality
- National school quality
- Charter schools
- Teaching about racism
- Transgender students’ access to bathroom facilities
- Transgender students’ eligibility for athletic activities
- Perceptions of teachers’ unions
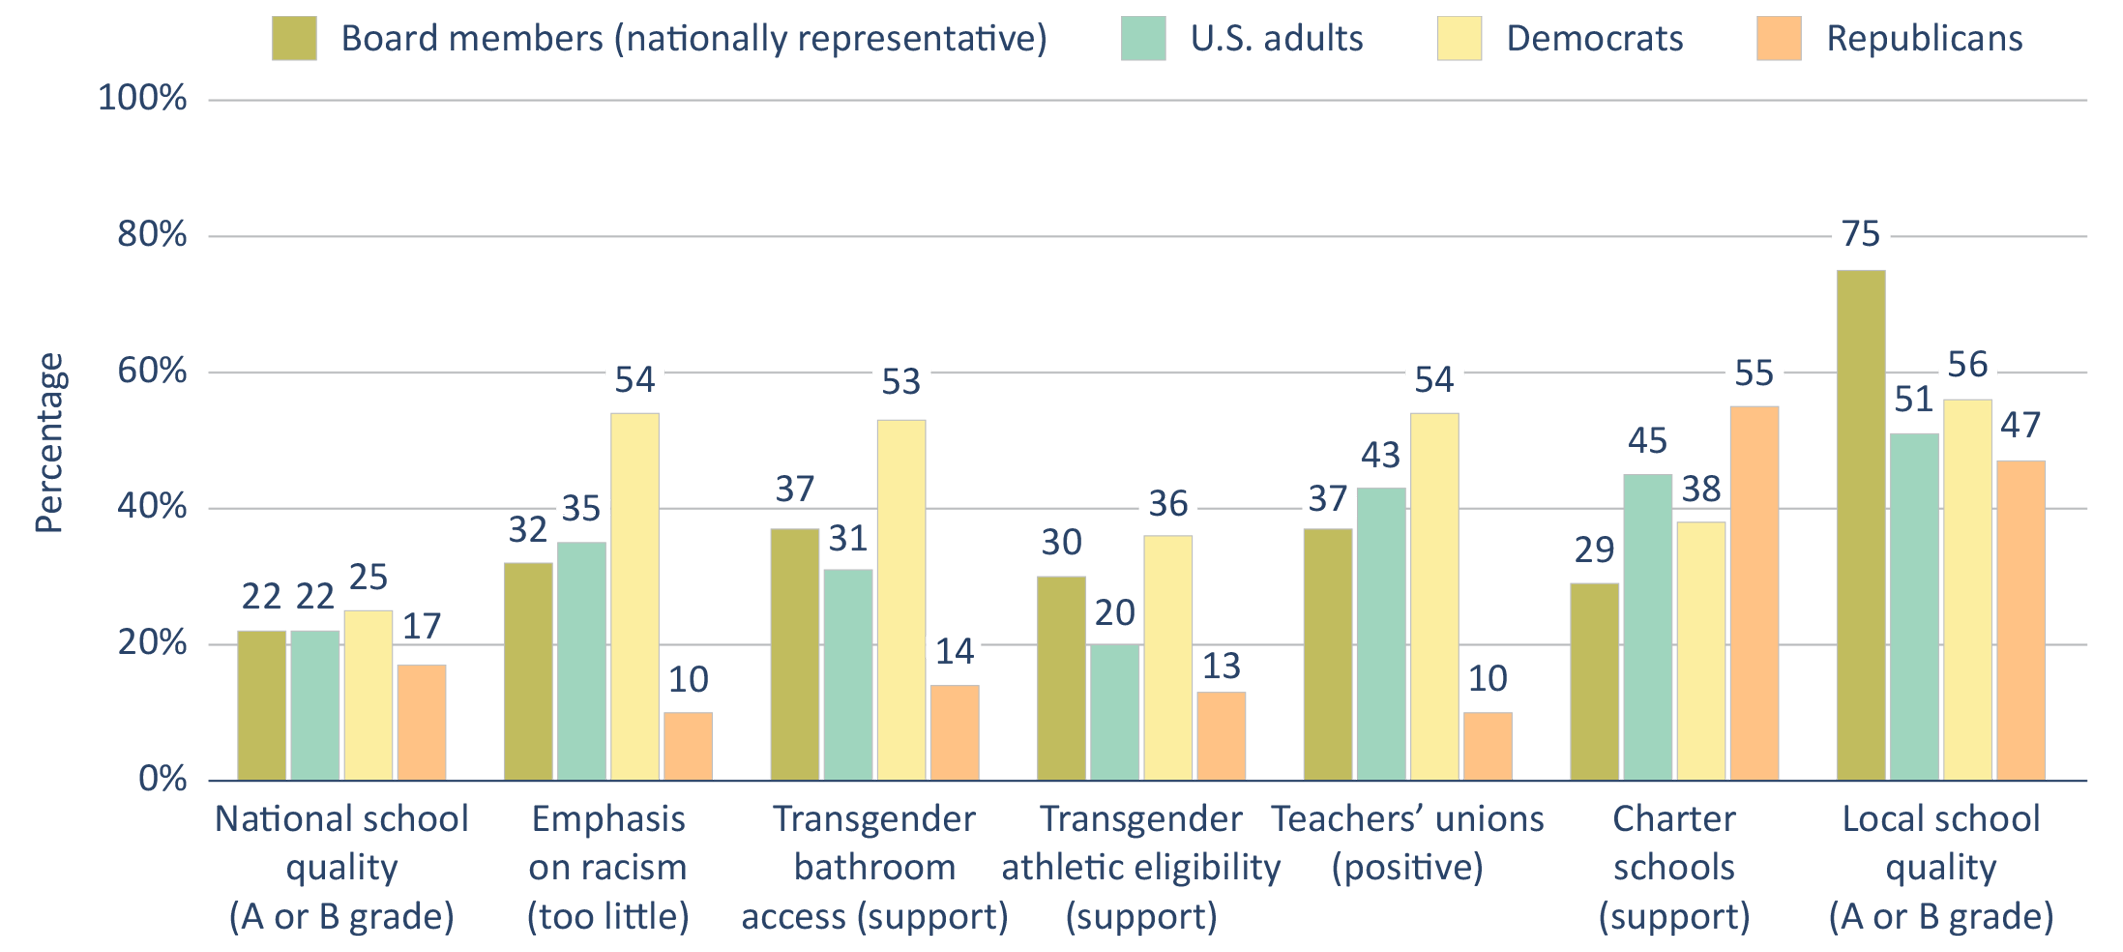
Figure 7 compares the views of school board members with the views of U.S. adults in general, the views of Democrats, and the views of Republicans (see also Table A4 and Table A5 in the Appendix). On a few issues, we observe a fair amount of overlap between board members’ and the U.S. public’s views. Board members and the public tend to rate the nation’s schools equally unfavorably, with just one in five giving them a grade of A or B. Both groups tend to hold similar views regarding their local schools’ emphasis on racism. (One in three board members say these topics receive too little attention, nearly identical to the share of the public as a whole.) Both groups tend to be skeptical about allowing transgender students to use bathroom facilities and participate in athletic activities that align with their gender identities, although board members are slightly more likely to support these positions than the public as a whole.
However, this pattern of shared opinions by school board members and the public dissipates when we turn to evaluations of local school quality, support for charter schools, and perceptions of teachers’ unions. The public is neither uniformly to the left nor uniformly to the right of board members on these issues. The picture is more complex. For example, the public is slightly more inclined to see teachers’ unions as a positive, rather than a negative, force in education. Meanwhile, almost half of U.S. adults support charter schools, compared with only three in ten board members. Board members are far more sanguine about the quality of the local public schools than the public at large. A whopping 75 percent of school board members give their local public schools a grade of B or higher. In contrast, only half of the public is so salutary.
We also disaggregated the public’s views by parent status, teacher status, and race/ethnicity, revealing several interesting patterns (see Table A4 in the Appendix). We highlight just one here related to race: The nation’s school board members are less likely to hold views commensurate with the average Black citizen than they are with any other group. For example, Black Americans are far more critical of the quality of their local schools, with only 43 percent giving their local schools a grade of B or better. Black Americans are also twenty-five percentage points more enthusiastic about charter schools than the average school board member. Likewise, Black citizens are much more likely to believe that the current level of instruction about racism is inadequate, and they are far more supportive of teachers’ unions.
Figure 7: School board members’ opinions on some high-profile education issues differ from those of the U.S. public.
Note: The full sample of school board members consists of 5,205 individuals; the sample size varies for each question. Board member (nationally representative) estimates are weighted so that the school districts represented by the individuals in our sample are representative of all districts nationwide with respect to student enrollment, the percentage of enrolled students who are White, the percentage of school-age students living in poverty, and population density. “Democrats” and “Republicans” include individuals who indicated that they lean toward the respective party. Nationwide estimates of public opinion are collected from the Education Next Survey of Public Opinion and the Cooperative Election Study.
Finding 6. Only about half of school board members hold positions on polarizing issues that match the positions of the dominant party in their districts, but enrollment-weighted estimates show that the majority of students are represented by board members with views that align with local politics.
Of course, the findings of a mismatch in board–citizen opinion shown in the previous section only speak to the U.S. public as a whole. It may well be the case that individual school board members are better aligned with their constituents. However, this possibility presents a significant methodological problem. Although there are multiple surveys about education issues that feature representative samples of the U.S. public, no one has taken the time and expense to systematically poll representative samples of the more than 13,000 school districts in the country.
To overcome this challenge, we again use the results of the 2020 presidential election for each school district. As can be seen by the breakdown of public opinion by party affiliation in Figure 7 (above), the seven issues that we examine here exhibit significant divisions along party lines. The magnitudes of these gaps are larger on some issues (e.g., teaching about racism, the rights of transgender students, and perceptions of teachers’ unions) and more modest on others (e.g., local school quality, national school quality, and charter schools), but all seven feature noteworthy differences on average between Democrats and Republicans. Therefore, we use partisan voting patterns as a proxy—albeit an imperfect one—for local public opinion.
We then categorize board members’ views on the issues as Republican-aligned or Democratic-aligned. This process is uncomplicated for issues on which the majority of one party holds one position and the majority of the other party holds the opposite position (e.g., teaching about racism, transgender students’ access to bathroom facilities, and perceptions of teachers’ unions). It is less clear-cut for issues on which opinion is not so neatly bifurcated. Consider charter schools. Whereas the majority of Republicans support charters, Democrats are more evenly split (although a plurality are in opposition). We opt to categorize “support” as Republican-aligned and “oppose” as Democratic-aligned, although we recognize that the debate on charter schools resists a simple partisan characterization. With respect to transgender students’ eligibility for athletic activities that align with their gender identities, a large majority of Republicans are opposed (80 percent), whereas only a plurality of Democrats are supportive (36 percent). In this case, we opt to categorize “support” as Democratic-aligned and “oppose” as Republican-aligned. Lastly, we exclude the local and national school quality items from this analysis, as these issues do not lend themselves to specific policies that a party could champion or reject.
In our survey, we also inquired about school board members’ views on efforts by parents and parent groups to restrict or remove books that they consider inappropriate from public schools, but we lack an identical question in a nationally representative survey of the U.S. public to serve as a reference point. Based on polling that asks similar questions, we categorize “support” as Republican-aligned and “oppose” as Democratic-aligned.[30]
Figure 8 displays the rates of alignment between estimates of board members’ views on these issues and the results of the 2020 presidential election in their districts (see also Table A2 in the Appendix). We consider a board member to “match” the views of the voters in their district if (A) they provided a Republican-aligned response and Trump won more than 50 percent of the vote in their district, (B) they provided a Democratic-aligned response and Biden won more than 50 percent of the vote in their district, or (C) they provided a neutral response (e.g., neither support nor oppose) and neither candidate won more than 60 percent of the vote in their district.
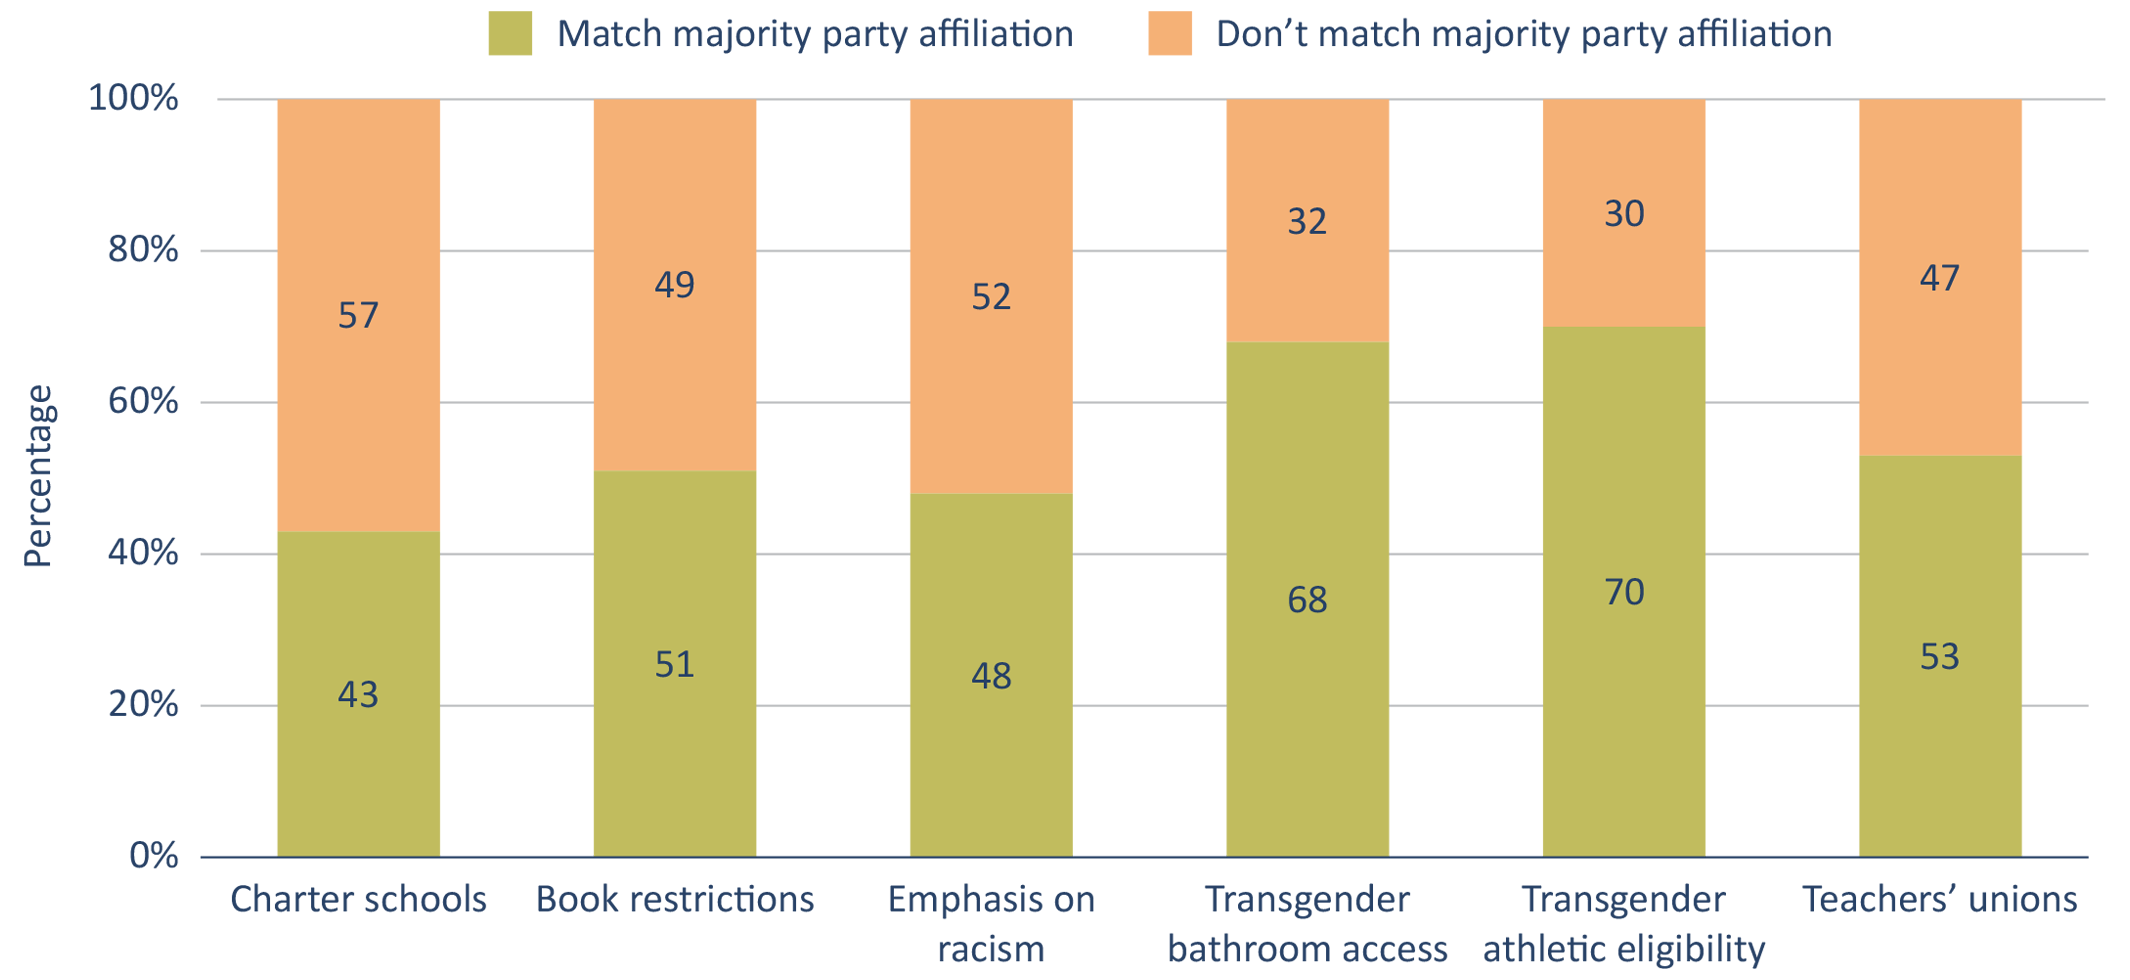
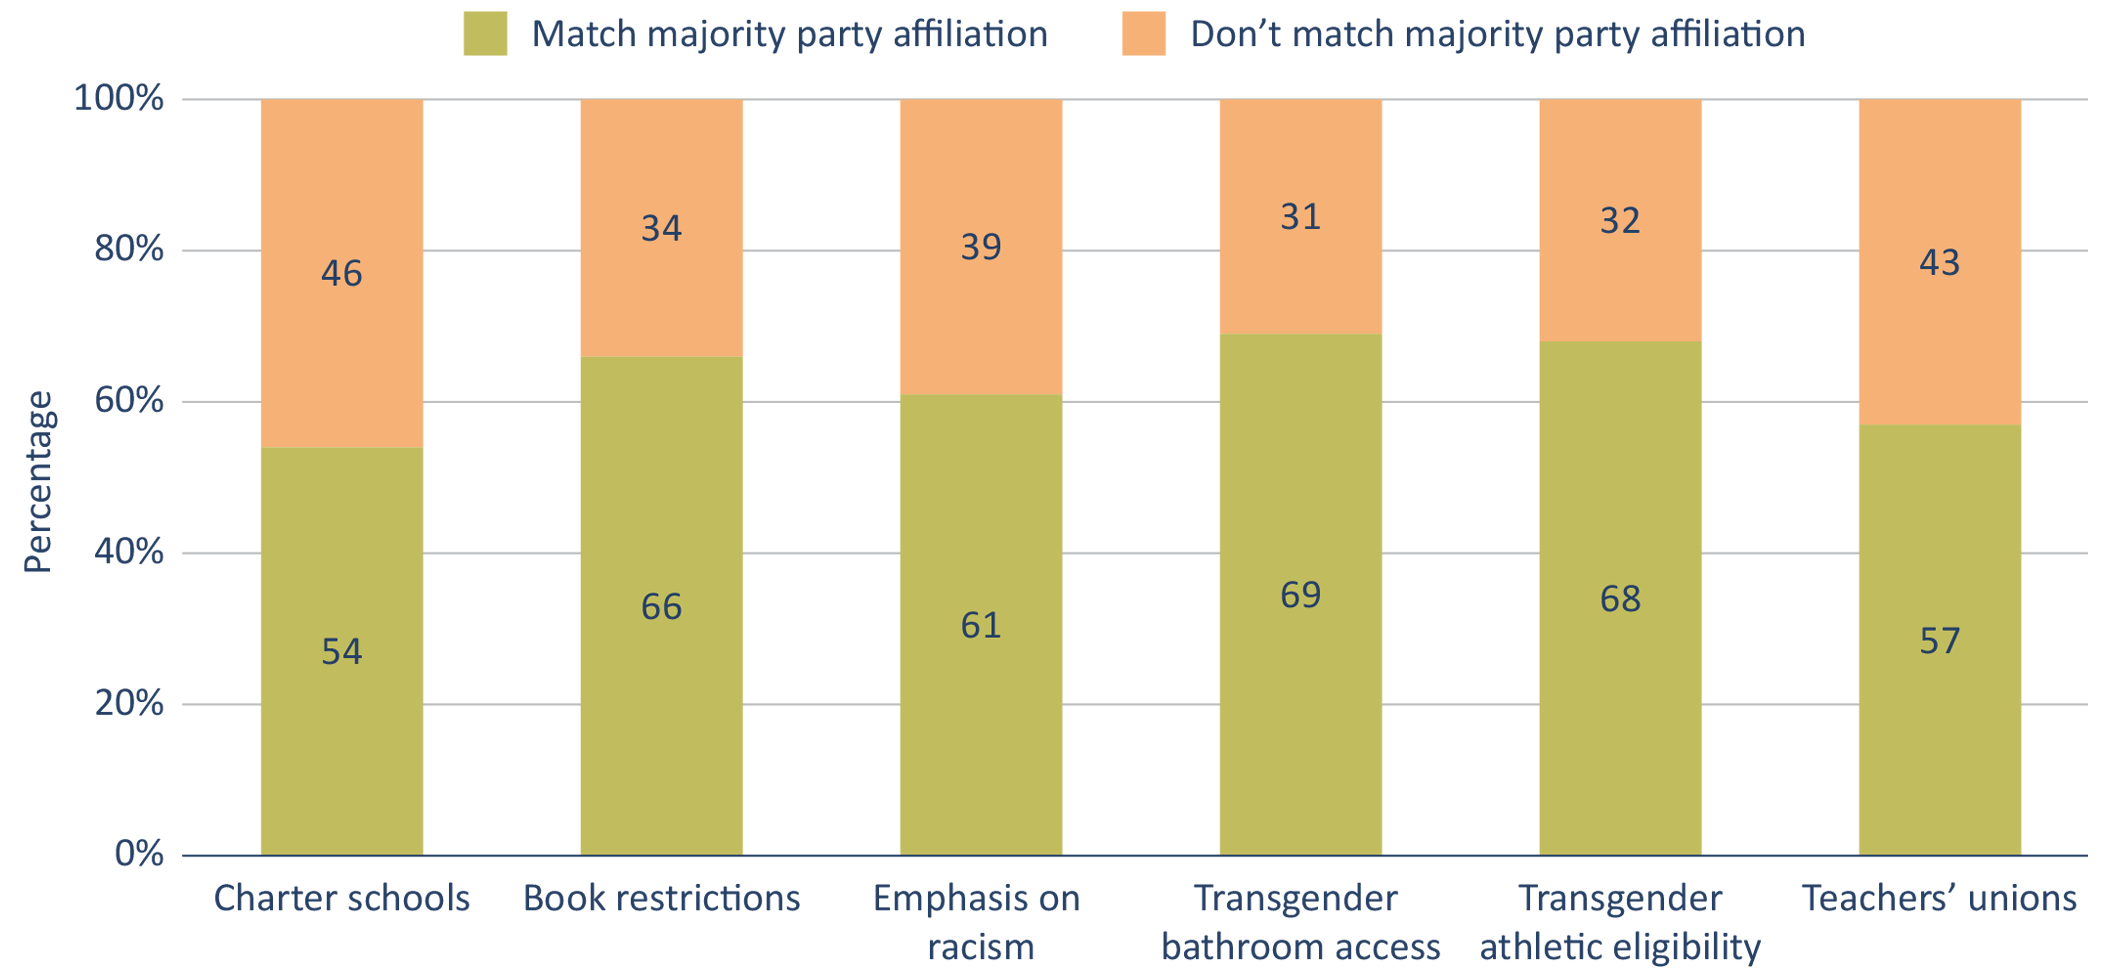
We find that only about one-half of school board members hold views on a variety of polarizing issues that match the views of the majority party in their district: charter schools (43 percent matching), book restrictions (51 percent), local schools’ emphasis on racism (48 percent), and teachers’ unions (53 percent). There were two issues that were exceptions in which clear majorities of board members matched their districts: transgender students’ access to bathroom facilities that match their gender identities (68 percent) and eligibility for athletic activities that match their gender identities (70 percent). However, as previously noted, only minorities of board members and the broader public supported these positions at the time of our survey.[31]
Figure 8: Only about half of school board members hold positions on recent polarizing issues that match the positions of the dominant party in their districts.
Note: The full sample of school board members consists of 5,205 individuals; the sample size varies for each question. Board member (nationally representative) estimates are weighted so that the school districts represented by the individuals in our sample are representative of all districts nationwide with respect to student enrollment, the percentage of enrolled students who are White, the percentage of school-age students living in poverty, and population density. District-level partisan composition is derived from precinct-level results of the 2020 presidential election, available from the Redistricting Data Hub.
Once again, the concentration of most students in a subset of larger urban and suburban districts introduces an important wrinkle. Figure 9 displays the results of analyses that weight board members in proportion to the number of students they serve (see Table A2 in the Appendix). For all six issues that we consider here, the majority of students are represented by board members who hold positions that line up with the partisan composition of their community. This pattern implies that the board–community mismatch, when it occurs, may be more prevalent in smaller and less populated school districts.
Figure 9: Weighting the results by district enrollment indicates that the majority of students are represented by board members who have views that align with local politics.
Note: The full sample of school board members consists of 5,205 individuals; the sample size varies for each question. Board member (enrollment-weighted) estimates were generated by positively weighting board members by the number of students enrolled in their districts. District-level partisan composition is derived from precinct-level results of the 2020 presidential election, available from the Redistricting Data Hub.
Furthermore, while dividing board members into two groups—matching and not matching—provides an accessible and intuitive way of assessing representativeness, it works better for issues with unambiguously Democratic-aligned and Republican-aligned positions. Moreover, conceptualizing representativeness as a dichotomy tends to obscure finer gradations in the degree of alignment for each issue. Another way to compare board members’ views on various issues and local politics is to calculate the correlations between them (see Table A2 in the Appendix). Regardless of which weighting approach we use, we find that there is essentially no relationship between board members’ responses to our survey question about charter schools (measured on a five-point scale from “strongly oppose” to “strongly support”) and the percentage of voters in their district who voted for Trump. The correlations get progressively stronger with respect to board members’ views regarding teachers’ unions, book restrictions, teaching about racism, and the rights of transgender students. This analysis leads us to a potentially surprising finding: To the extent that representativeness varies by issue, it is more pronounced for some of the so-called culture war issues that are the ostensible source of many recent school board conflicts.
School Board Members’ Perceptions of School Board Elections
Finding 7. Most school board members say that their elections are not very competitive and not very partisan, that teachers’ unions play a small role, and that these dynamics have not changed much since the pandemic.
Given some of the media coverage of school board politics over the past few years—think of the Loudoun County example at the beginning of this report, the emergence of conservative-leaning parent groups such as Moms for Liberty, or the influx of outside campaign contributions to school board candidates in places such as the Los Angeles Unified School District—one might assume that school board elections have become more competitive and increasingly partisan affairs. Likewise, given the influential role that teachers’ unions played in pandemic-era school reopening debates, it seems plausible that organized labor has grown more influential in electioneering and board decision-making. Our data can speak directly to these two narratives. Figure 10 displays the results of our analyses of board members’ perceptions of the political environment that shapes their elections (see also Table A6 in the Appendix).
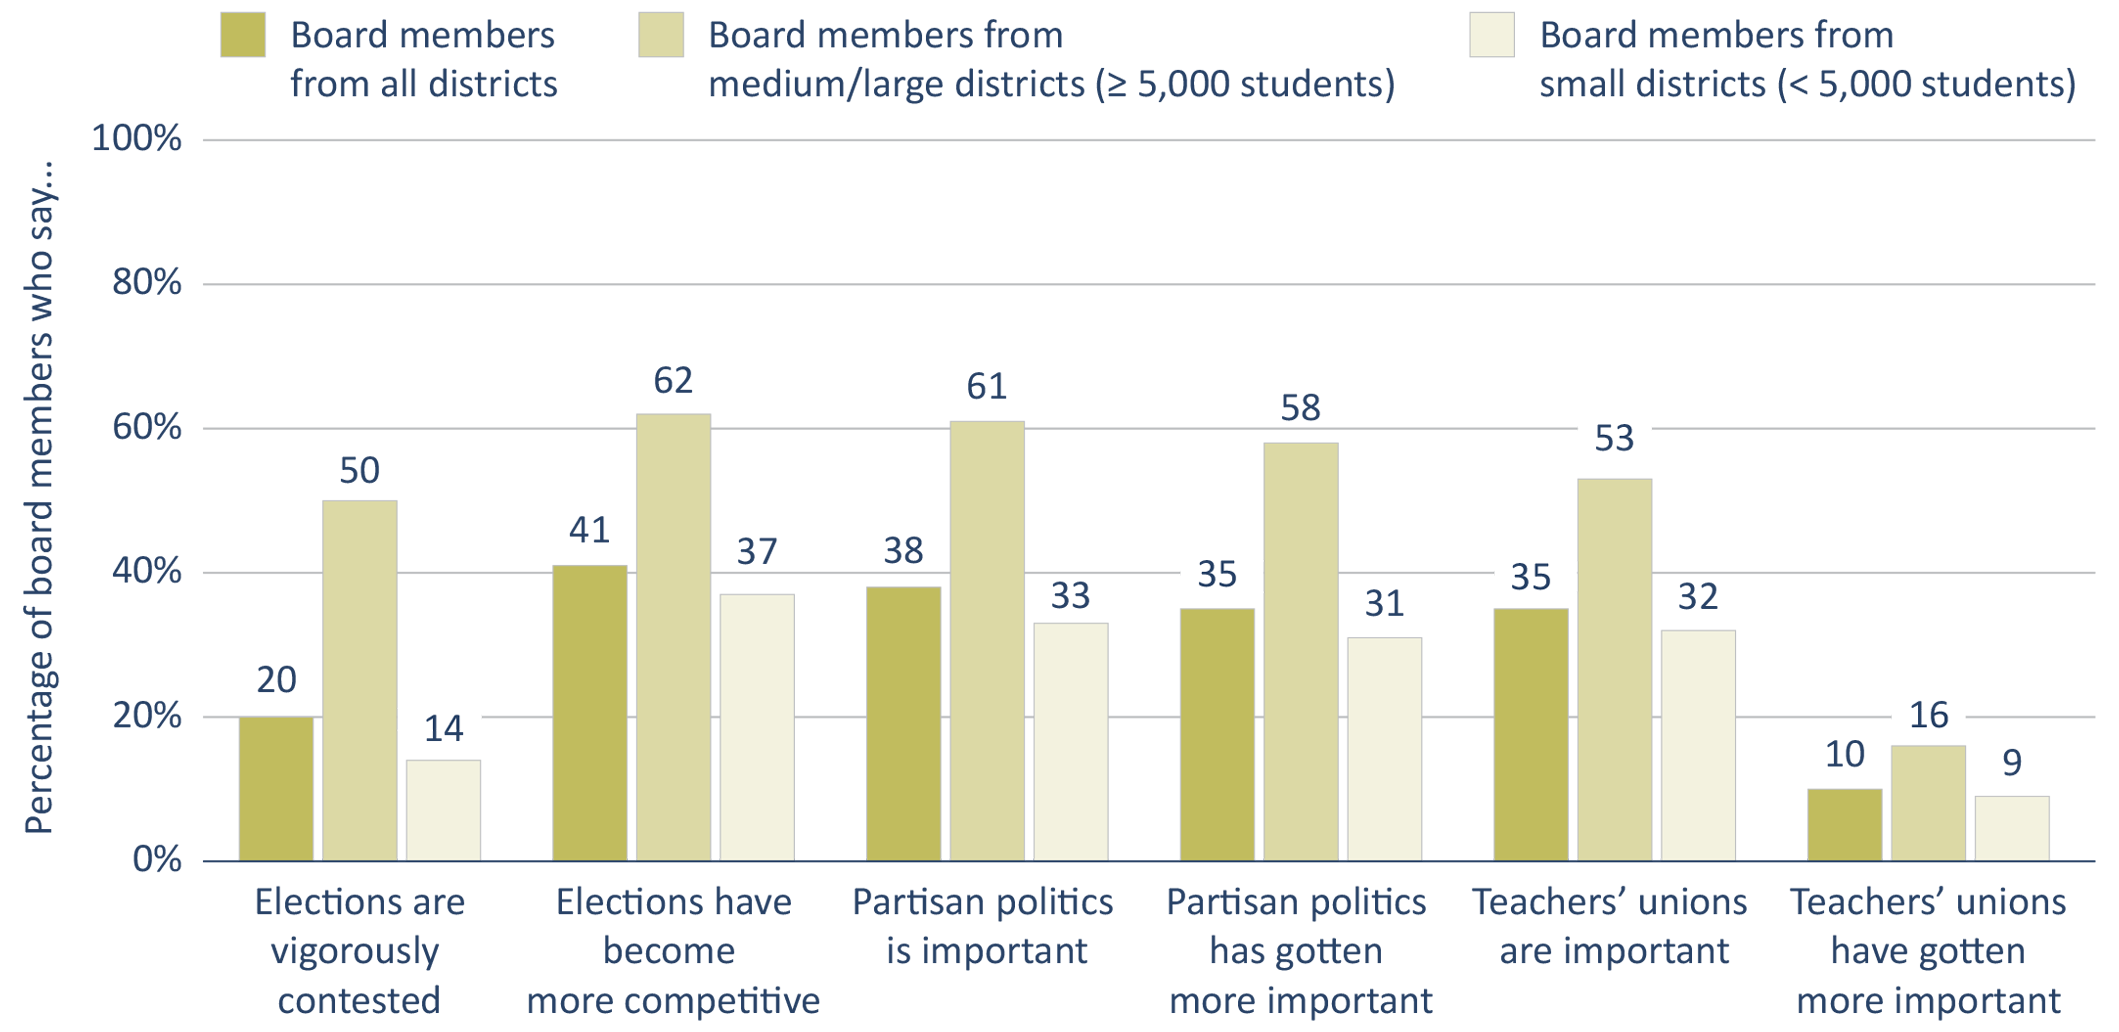
As it turns out, most school board members characterize their elections as relatively uncompetitive, nonpartisan, and largely removed from the influence of teachers’ unions. This is consistent with a recent study showing that most board turnover is the result of incumbent retirements rather than electoral defeat.[32] Our survey bears this out: Just one in five board members described elections in their districts as “vigorously contested”; less than two in five indicated that partisan politics is somewhat or very important; and about one in three suggested that teachers’ unions are somewhat or very important. On the other hand, a substantial minority of board members believe that these three electoral dynamics have gotten more important since the pandemic.
Figure 10: Most school board members say that their elections are not very competitive and not very partisan, that teachers’ unions play a small role, and that these dynamics have not changed much since the pandemic. In larger school districts, however, the reverse is true.
Note: The full sample of school board members consists of 5,205 individuals; the sample size varies for each question. Board member estimates are weighted so that the school districts represented by the individuals in our sample are representative of all districts nationwide with respect to student enrollment, the percentage of enrolled students who are White, the percentage of school-age students living in poverty, and population density.
Finding 8. In larger school districts, however, most school board members say that elections are competitive and partisan and that teachers’ unions play a significant role.
This broad characterization, however, conceals a stark division between board members representing smaller school districts and those representing larger districts. Among board members in districts serving more than 5,000 students—that is, most medium-to-large urban and suburban districts—the exact opposite is closer to the truth. Half of such board members describe their elections as “vigorously contested”; three in five indicate that partisan politics is somewhat or very important; and slightly more than half suggest that teachers’ unions are somewhat or very important. Furthermore, a majority of these board members believes that elections have grown more competitive and more partisan since the pandemic. Board members’ perceptions of the influence of teachers’ unions, however, have remained relatively constant, regardless of district size. In other words, although we observe little evidence to support the assertion that school board elections in general have grown more contentious since the pandemic, that claim may have some merit with respect to the most populous districts.
Discussion
Much has changed in the politics of American education since we administered our survey of school board members in the winter of 2022–2023. In particular, the early days of the second Trump presidency have generated a great deal of uncertainty for educational leaders as the administration simultaneously seeks to diminish the federal role in K–12 education while also aggressively using its authority to shape state and local decision-making. An analysis of political conflict in local school governance, which was already relevant in 2023, has only become more so.
Our results suggest that U.S. school board members, at least in terms of their partisanship and general ideology, are remarkably similar to the U.S. public. Nationwide, board members’ party affiliations and ideological preferences almost perfectly mirror the politics of the country as a whole. Admittedly, this alignment is somewhat exaggerated by the sizable number of board members representing less populous—and presumably more Republican and conservative—districts. The average student is somewhat more likely to be represented by a board member whose political beliefs are moderate or left of center. That said, most school board members share the politics of their local communities. More than seven in ten students are represented by board members who identify with the same party as the majority of their residents. Given that over 90 percent of school board elections are formally nonpartisan contests and many are held at times other than November of even-numbered years, this degree of partisan alignment is notably high.[33]
In other areas, however, the gaps between board members and the public are more substantial. Compared with the U.S. public, school board members are much more likely to be White, to have gone to college (and especially to have an advanced degree), and to have been a teacher. Not all of these disparities are necessarily detrimental or unique to school boards. Nearly all elected officials in the U.S., from city council members to senators, are more likely to have completed college than the average adult. (Whether that is a good or a bad thing is, we suppose, in the eye of the beholder.) Likewise, it seems reasonable that former educators might be more likely to take an interest in school board service. On the other hand, educators’ views of education policy differ meaningfully from the public’s as a whole,[34] and their overrepresentation inevitably shapes the decisions that boards make.[35]
The sizable racial/ethnic gap observed by earlier researchers continues to appear in our analysis. The population of school board members is twenty-eight percentage points Whiter than the total U.S. population, which is itself much Whiter than the U.S. school-age population. Once again, some of this pattern can be explained by the large proportion of board members representing less populated, more rural, and often Whiter school districts. When viewed from the perspective of the average student, the gap is reduced to a smaller but still substantial eighteen percentage points. Black Americans and especially Hispanic Americans remain relatively underrepresented on America’s school boards. While most board members (84 percent) have the same racial/ethnic identity as the majority of residents in their district, this figure is inflated by the large number of White board members representing smaller and mostly White districts. Board members representing about two-thirds of all students share the same racial/ethnic identities as most of their constituents.
When it comes to some of the education policy issues that have stirred conflict in school board meetings and prompted heated media coverage, there are nontrivial discrepancies between the views of board members and the views of the public at large. Only about half of school board members hold positions on recent polarizing issues that line up with the party affiliation of the majority of their residents (an imperfect but useful proxy for the public’s views on these matters). Yet on some of the most divisive culture war issues that have gained salience in recent years, we found higher rates of alignment between boards and their communities than on more long-standing debates—for example, debates about charter schools and teachers’ unions, which animated the politics of education in previous decades. Likewise, boards appear to be far more pleased with the state of their districts’ schools than the American public and even parents of school-age children. School boards may well have some political slack to ignore voters’ preferences on less contentious education issues, because those issues have receded into the background and given way to social and cultural issues that are more likely to provoke violent conflict. Mitigating the hostility prompted by these debates can cost school districts tens, and even hundreds, of thousands of dollars.[36] One recent study shows that when districts are distracted by battles over culture war issues—rather than focusing on academics—student learning suffers.[37]
We find that issue alignment improves somewhat when considering board members who represent larger proportions of students. Board–community divergences, when they occur, appear to be most prevalent in less populated districts. The weaker indicators of representation in smaller, more sparsely populated school districts could plausibly be related to the relative lack of competition for those seats. Whereas board members in medium-to-large districts tend to characterize their elections as fiercely competitive, partisan, and influenced by major interest groups (such as teachers’ unions), their counterparts in smaller districts paint a very different picture, with plenty of uncontested seats and few political pressures.
Altogether, our findings underscore a central tension in contemporary school governance: While boards are relatively well aligned with their constituents on some of the most polarizing, high-profile issues—often overlapping with the deeply entrenched partisan views in their districts—they appear less attuned to matters related to school quality, school choice, and the role of teachers’ unions. These dynamics may even enable the types of cultural flashpoints that came to the fore during the pandemic to crowd out more general concerns about student academic outcomes. In other words, school board politics in most communities appears to be less heated and less riven by partisan conflict than is often portrayed in the media. However, we do observe persistent and potentially pernicious divides among voters’ preferences, board members’ beliefs, and students’ needs with respect to key education issues. The challenge becomes ensuring that local school board governance works not just for the most vocal participants in the most emotionally charged debates but also for the broader swath of students whose futures hinge on the decisions being made.
Appendix
This appendix provides additional description of the survey sampling and analysis methodology, including details of how the study addresses nonresponse and weighting, as well as comprehensive results of the survey, including an additional figure and data tables.
Nonrandom Nonresponse
The school board members who completed our survey are potentially different, in both observable and unobservable ways, from their counterparts who chose not to complete our survey. Although we cannot eliminate the uncertainty associated with this challenge completely, we can both minimize it and demonstrate that any remaining bias is likely to be modest, leaving our general conclusions intact.
The underlying issue relates to what survey methodologists refer to as nonrandom nonresponse. In short, the individuals who participate in a given survey are potentially systematically different from those who do not participate, biasing the estimates generated by the survey data. Nonrandom nonresponse is a nearly ubiquitous problem in survey research, including surveys that employ random sampling in order to contact potential participants. (The subset of contacted individuals who actually complete the survey is unlikely to be a random subset of the original pool of individuals invited to participate.) Nonrandom nonresponse tends to be an even larger problem for non-probabilistic surveys such as ours.
There are two forms of nonresponse: ignorable and nonignorable (Bailey, 2024). Ignorable nonresponse means that the differences between participants and nonparticipants are completely explained by observable factors, such as one’s demographic characteristics. We can then use these factors to weight the data, eliminating the issue. To the extent that nonresponse in our survey is explainable by the student enrollments, racial compositions, socioeconomic compositions, and population densities of the districts in which school board members serve, our weighting scheme corrects for it. (See the following section of this appendix for more detail.)
Nonignorable nonresponse means that the differences between participants and nonparticipants are related to factors that we either do not observe or do not know the actual distribution of in the population. Nonignorable nonresponse cannot be corrected with weights, but we can think through the severity of the problem for our analysis.
Based on the work of Meng (2018), for any given value generated from survey data (Yn), you can characterize the difference between that value and the true value in the population (YN) as:
Yn − YN = ρR,Y √((N − n)/n) σY
where ρR,Y is the correlation between an individual’s propensity to respond to the survey (R) and that individual’s response to a given survey item (Y); √((N − n)/n) captures the size of the population (N) in relation to the size of the sample (n); and σY is the variation in responses to survey item Y.[38]
The intuition behind the equation above is surprisingly straightforward. The problem of nonignorable nonresponse is worse when (1) there is a stronger relationship between one’s likelihood of completing the survey and one’s views on the subject that the survey is trying to elicit, (2) there is a greater difference in size between the sample and the size of the overall population, and (3) there is more variation in the value that we seek to measure.
The second factor—the size of the population in relation to the size of the sample—is particularly relevant for our analysis and merits additional explanation. Most of the tools of inferential statistics rely on the size of the sample rather than the size of the overall population. However, when considering nonignorable nonresponse, both quantities matter. In probabilistic samples, the relevant difference is between the final count of respondents who completed the survey and the pool of potential respondents who were initially invited to participate. In non-probabilistic samples—such as ours—the relevant difference is between the final count of respondents who completed the survey and the entire target population. When this difference is large (i.e., when the response rate is low), as it often is in contemporary survey research, even a small correlation between one’s likelihood of completing the survey and one’s views (ρR,Y) can result in a survey sample that is quite different from the population it purports to represent. This problem worsens as the variation in the population’s views on the issue in question (σY) increases.
Using this framework, we can benchmark the seriousness of nonignorable nonresponse in our study against a recent well-known example: the 2016 election polls that underestimated the Trump vote share, in part because Trump supporters were less likely (even after adjusting for various observable characteristics) to respond to pollsters. In his analysis of all major polls in the weeks just prior to the election compared with the actual state-level election results, Meng (2018) estimates that ρR,Y (the correlation between one’s likelihood of responding to a poll and one’s support for Trump) was about 0.005 in the population as a whole—a small but non-zero relationship. However, because of the massive difference in size between the final count of actual respondents and the pool of potential respondents (on account of the extremely low response rates to most contemporary political polls), this modest correlation resulted in survey samples that were notably less likely to include people saying they planned to vote for Trump. Meng argues that the multiple-percentage-point error in Hillary Clinton’s favor in many state-level polls—a difference large enough to mispredict the outcome of the election—was at least partially attributable to nonignorable nonresponse.
Even if we were to assume a similar value of ρR,Y—which seems reasonable, given the contentiousness around school board politics in January 2023, when we conducted our survey—our study faces a less severe threat for two reasons. First, although the actual number of U.S. school board members is an unknown quantity, the 61,299 names and email addresses that we collected is in the right ballpark, assuming an average of five board members in each of the approximately 13,000 districts in the country. In our study, the difference between our sample size and the population size is smaller than the analogous difference for election polling. As a result, our sample is less likely to be distorted by a small correlation between one’s propensity to respond and one’s views. Second, even an error of the magnitude seen in 2016 state-level presidential polling would be less problematic for our analysis. Unlike presidential election polling in a tightly contested race—in which an error of a few percentage points has enormous consequences—if our estimates diverge from the true values by a similar amount, our findings would still provide a considerable contribution to our collective understanding of the characteristics and views of school board members today (about which little is known).
Weighting
We invited 61,299 school board members to participate in our survey. There were 5,346 individuals from 3,093 school districts who responded, a rate of 8.7 percent. Although responding school board members hail from a wide variety of districts drawn from nearly every U.S. state, the subset of members who chose to respond are not a fully representative sample of all school board members nationwide. As such, we weight the survey data in order to improve their representativeness.
Generating representative survey weights for school board members raises more than a few challenges. First, there is no official census of the demographic characteristics of all U.S. school board members. Indeed, gathering such information is one of the objectives of our study. Accordingly, we cannot weight the individual-level responses against a known population. We do, however, know the demographic characteristics of every school district in the U.S., and we know the school district of every board member in our data. Therefore, we can weight our data at the district level. This helps ameliorate a key potential source of sampling bias. For example, if our sample contains disproportionately few board members from districts in which students of color constitute the majority, then we can upweight those board members so that the district racial distribution in our data matches the actual district racial distribution in the country.
We calculate our first set of survey weights, which we refer to as representative weights, with an approach known as cell-weighting using a small set of variables that meet the criteria described by Caughey et al. (2020) for variable selection[39]:
- The variable is correlated with participants’ probability of taking the survey.
- The variable is correlated with participants’ survey responses.
- The distribution of the variable in the population is known.
Following these criteria, we weight our data by district enrollment, the district-level percentage of students who are White, the percentage of school-age children living in poverty, and population density in the district. All four variables (1) predict differences between the districts in our sample and all districts nationwide, (2) predict participants’ responses to a wide range of survey items, and (3) are reliably measured for all districts in the country.
We divide each variable into terciles and create a group for each possible combination (e.g., first tercile for enrollment, third tercile for the percentage of students who are White, second tercile for the percentage of school-age children in poverty, and second tercile for density), for a total of eighty-one possible groups.[40] We then calculate the weight for observations from group g as:
wg = PopulationPercentg SamplePercentg
The values of wg are easy to interpret. For example, if there are twice as many districts in the country in a given group as there are in our sample, board members from such districts would receive a weight of 2.
Weighting in this manner does not ensure that our sample of school board members is descriptively representative of all school board members nationwide—which is not possible. Rather, our approach ensures that the districts represented by the school board members in our analysis are representative of all districts nationwide with respect to enrollment, racial/ethnic composition, childhood poverty rate, and population density.
However, there is also a second consideration that is more conceptual than technical in nature. Many of the approximately 13,000 school districts in the U.S. are sparsely populated rural districts (e.g., containing a trio of elementary schools and a pair of middle schools that feed into a single high school). Yet most K–12 students attend schools located in a relatively small number of densely populated urban and suburban districts. As a result, any attempt to capture a more representative group picture of school board members will tend to underemphasize the board members who serve the most students.
Therefore, we also reconduct many of our analyses with a second set of survey weights, which we refer to as proportional weights. These positively weight each board member by the total number of students enrolled in their district. This approach allows us to analyze school board members in a manner proportional to the number of students they serve.
Survey Questions About Education Policy Issues
Local School Quality
Students are often given the grades A, B, C, D, and Fail to denote the quality of their work. Suppose the public schools themselves were graded in the same way. What grade would you give the public schools in your community? (A, B, C, D, Fail)
National School Quality
How about the public schools in the nation as a whole? What grade would you give them? (A, B, C, D, Fail)
Charter Schools
Many states permit the formation of charter schools, which are publicly funded but are not managed by the local school board. These schools are expected to meet promised objectives, but are exempt from many state regulations. Do you support or oppose the formation of charter schools? (Strongly support, Somewhat support, Somewhat oppose, Strongly oppose, Neither support nor oppose)
Book Restrictions
Do you support or oppose efforts by parents and parent groups to restrict or remove books that they consider inappropriate from public schools? (Strongly support, Somewhat support, Somewhat oppose, Strongly oppose, Neither support nor oppose)
Teaching About Racism
Some people think that the public schools in their community place too little emphasis on slavery, racism, and other challenges faced by Black people in the United States. Other people think that their public schools currently place too much emphasis on these topics. What is your view? (Far too little emphasis, Too little emphasis, About the right amount, Too much emphasis, Far too much emphasis)
Transgender Students’ Access to Bathroom Facilities
Do you support or oppose requiring public schools to allow transgender students to use school facilities (e.g., bathrooms) that align with their gender identity? (Strongly support, Somewhat support, Somewhat oppose, Strongly oppose, Neither support nor oppose)
Transgender Students’ Eligibility for Athletic Activities
Do you support or oppose requiring public schools to allow transgender students to participate in school activities (e.g., athletic teams) that align with their gender identities? (Strongly support, Somewhat support, Somewhat oppose, Strongly oppose, Neither support nor oppose)
Perceptions of Teachers’ Unions
Some people say that unions fight for better schools and better teachers. Others say that teachers' unions make it harder to improve schools. What do you think? Do you think teachers' unions have a generally positive effect on schools, or do you think they have a generally negative effect? (Strongly positive effect, Somewhat positive effect, Somewhat negative effect, Strongly negative effect, Neither positive nor negative effect)
Additional Tables
Table A1: School board member political and demographic characteristics.

Note: The full sample of school board members is n = 5,205. Board member (representative) estimates are weighted so that the school districts represented by the individuals in our sample are representative of all districts nationwide with respect to student enrollment, the percentage of enrolled students who are White, the percentage of school-age students living in poverty, and population density. Board member (proportional) estimates are positively weighted by student enrollment. 1 “Democrat” and “Republican” include individuals who indicated that they “lean” toward the respective party. 2 Gallup, 2023. 3 U.S. Census Bureau, American Community Survey, 2018–2022 five-year estimates. 4 U.S. Census Bureau, Household Pulse Survey, January–April 2024. 5 U.S. Bureau of Labor Statistics, 2023 (sum of preschool, elementary, middle, secondary, and special education teachers—not exclusive to public schools).
Table A2: The political representativeness of school board members.
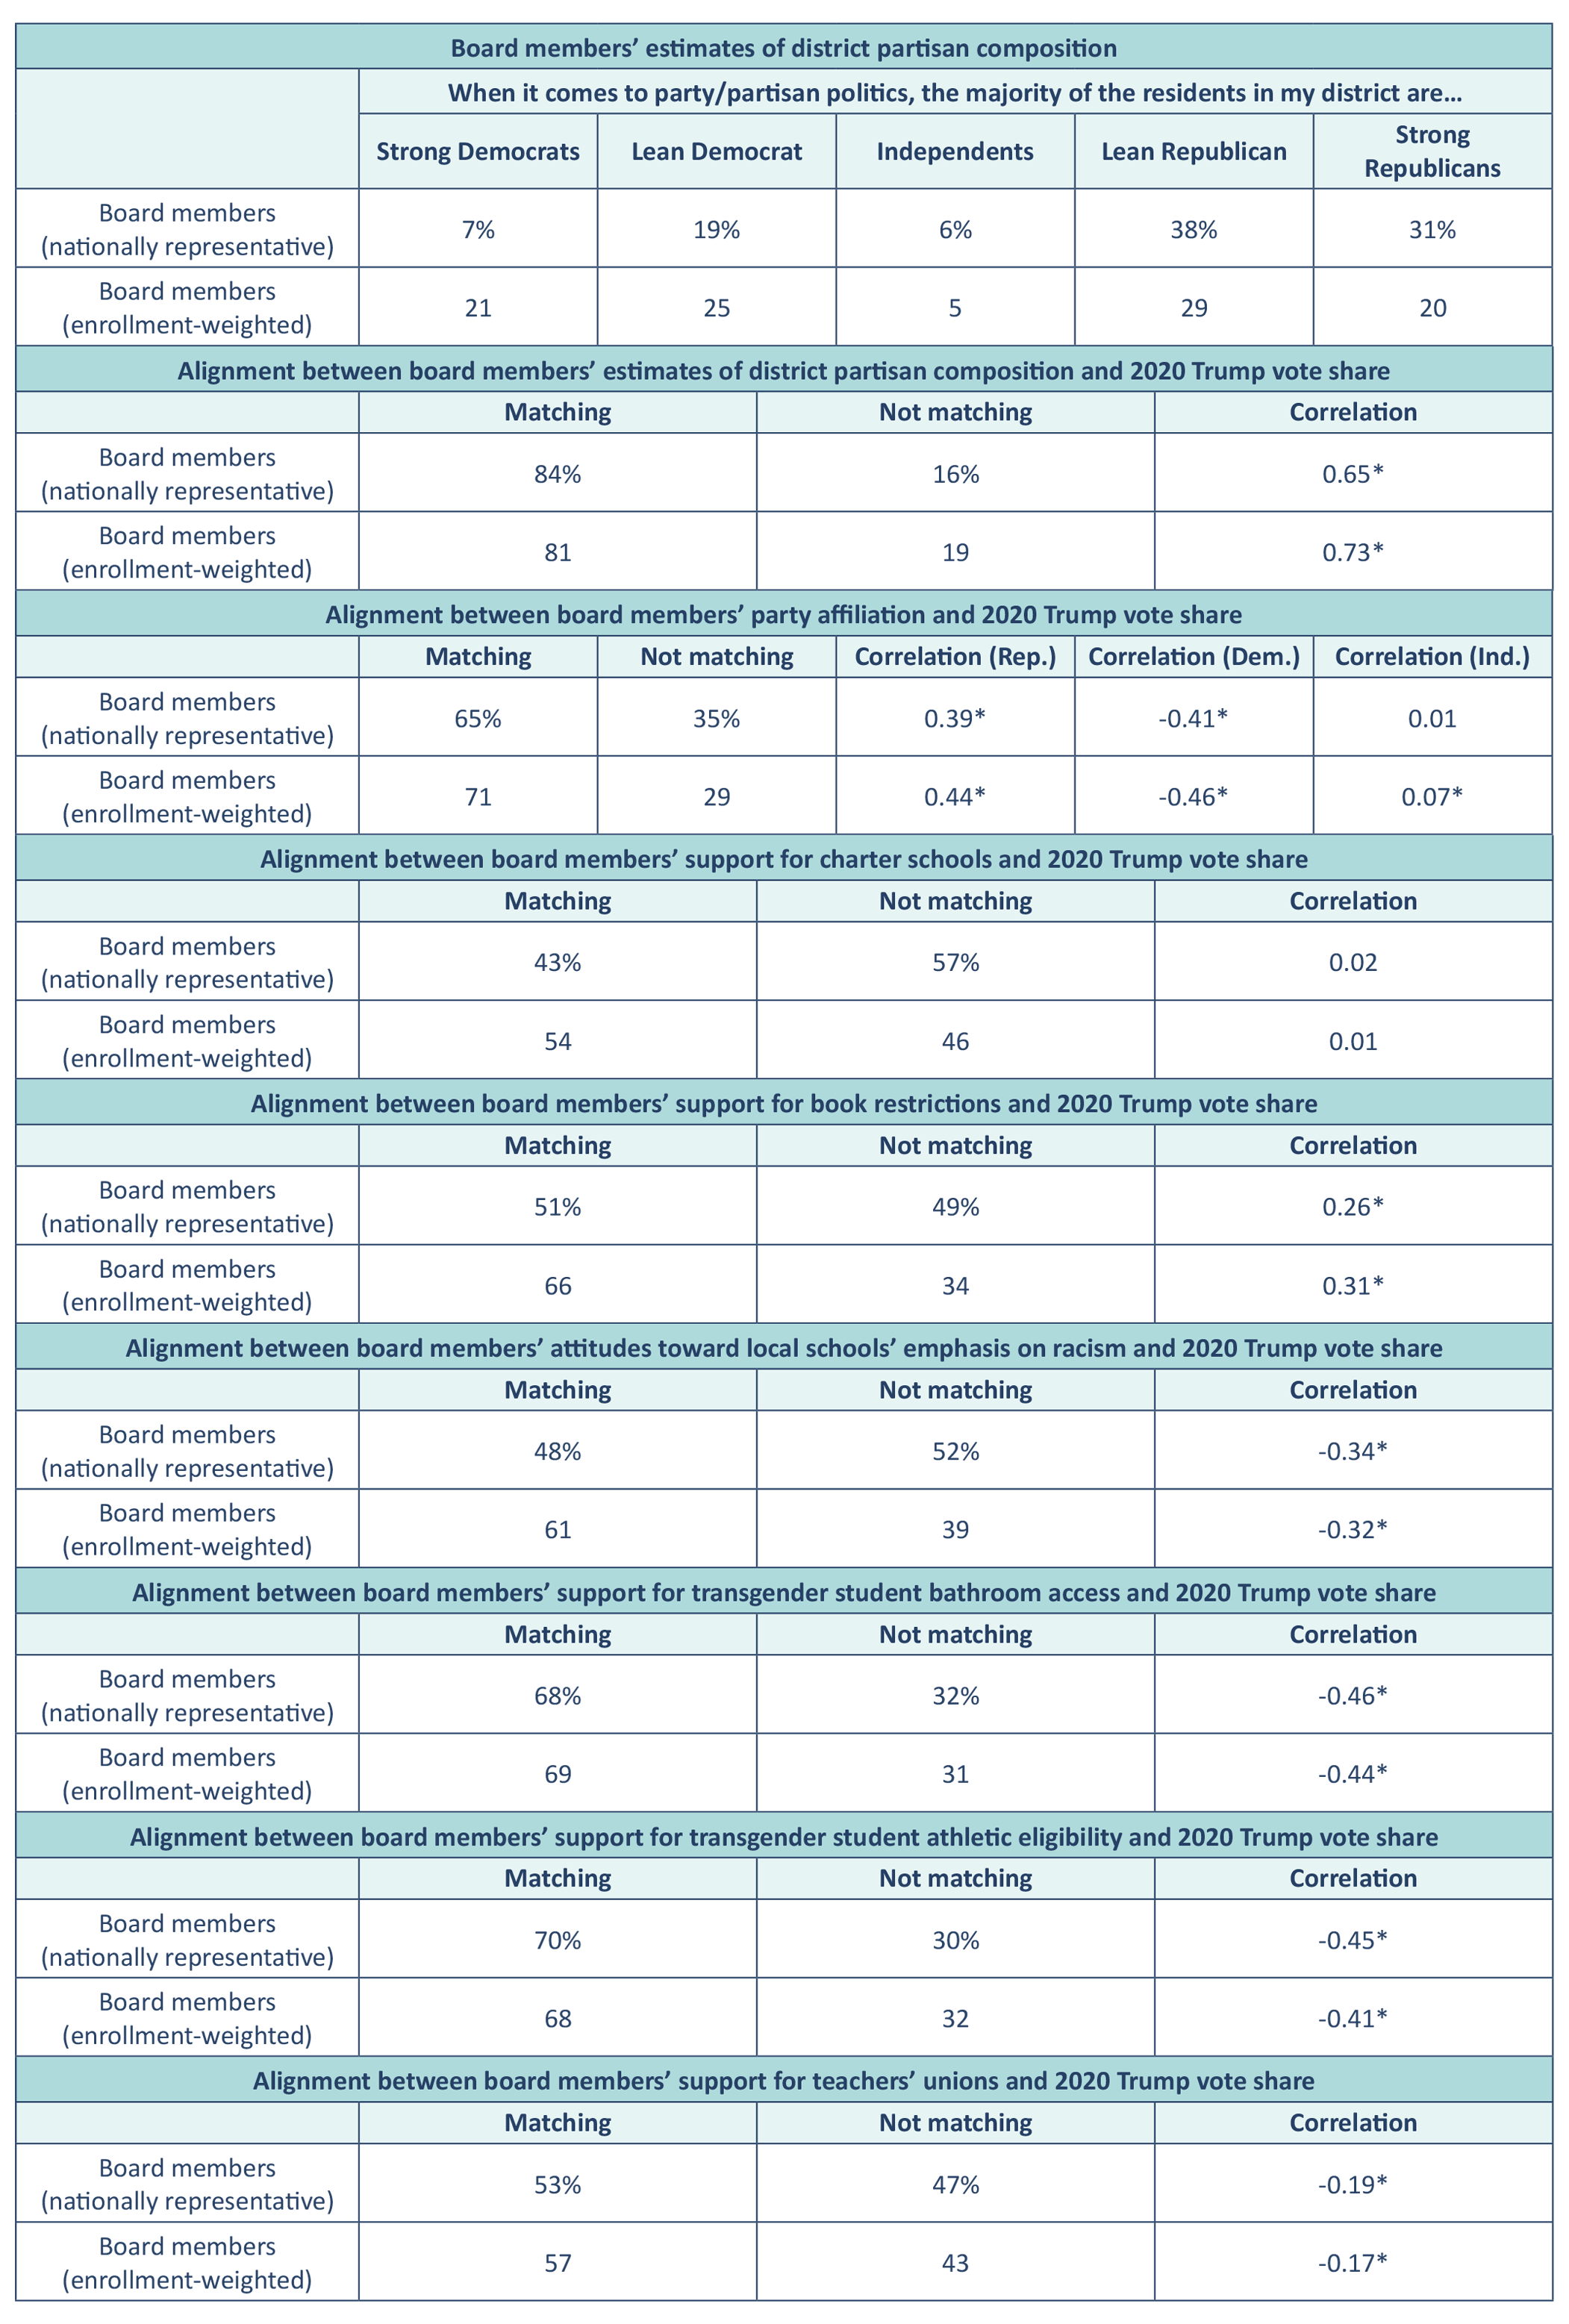
Note: A board member is considered matching if (A) they provided a Republican-aligned response and Trump won more than 50% of the vote, (B) they provided a Democratic-aligned response and Trump won less than 50% of the vote, or (C) they provided a neutral response and Trump won between 40% and 60% of the vote. The correlations followed by a specific identity in parentheses reflect the correlation between a dichotomous indicator of that identity and the 2020 Trump vote share. All other correlations reflect the correlation between board members’ responses on a 1–5 scale and the 2020 Trump vote share. Board member (representative) estimates are weighted so that the school districts represented by the individuals in our sample are representative of all districts nationwide with respect to student enrollment, the percentage of enrolled students who are White, the percentage of school-age students living in poverty, and population density. Board member (proportional) estimates are positively weighted by student enrollment. * P < 0.05.
Table A3: The racial/ethnic representativeness of school board members.

Note: A board member is considered matching if their racial/ethnic identity aligns with that of the majority of residents/students in their district. The correlations followed by a specific identity in parentheses reflect the correlation between a dichotomous indicator of that identity and the percentage of residents/students who share that identity. Board member (representative) estimates are weighted so that the school districts represented by the individuals in our sample are representative of all districts nationwide with respect to student enrollment, the percentage of enrolled students who are White, the percentage of school-age students living in poverty, and population density. Board member (proportional) estimates are positively weighted by student enrollment. * P < 0.05.
Table A4: School board members’ opinions on controversial education issues.
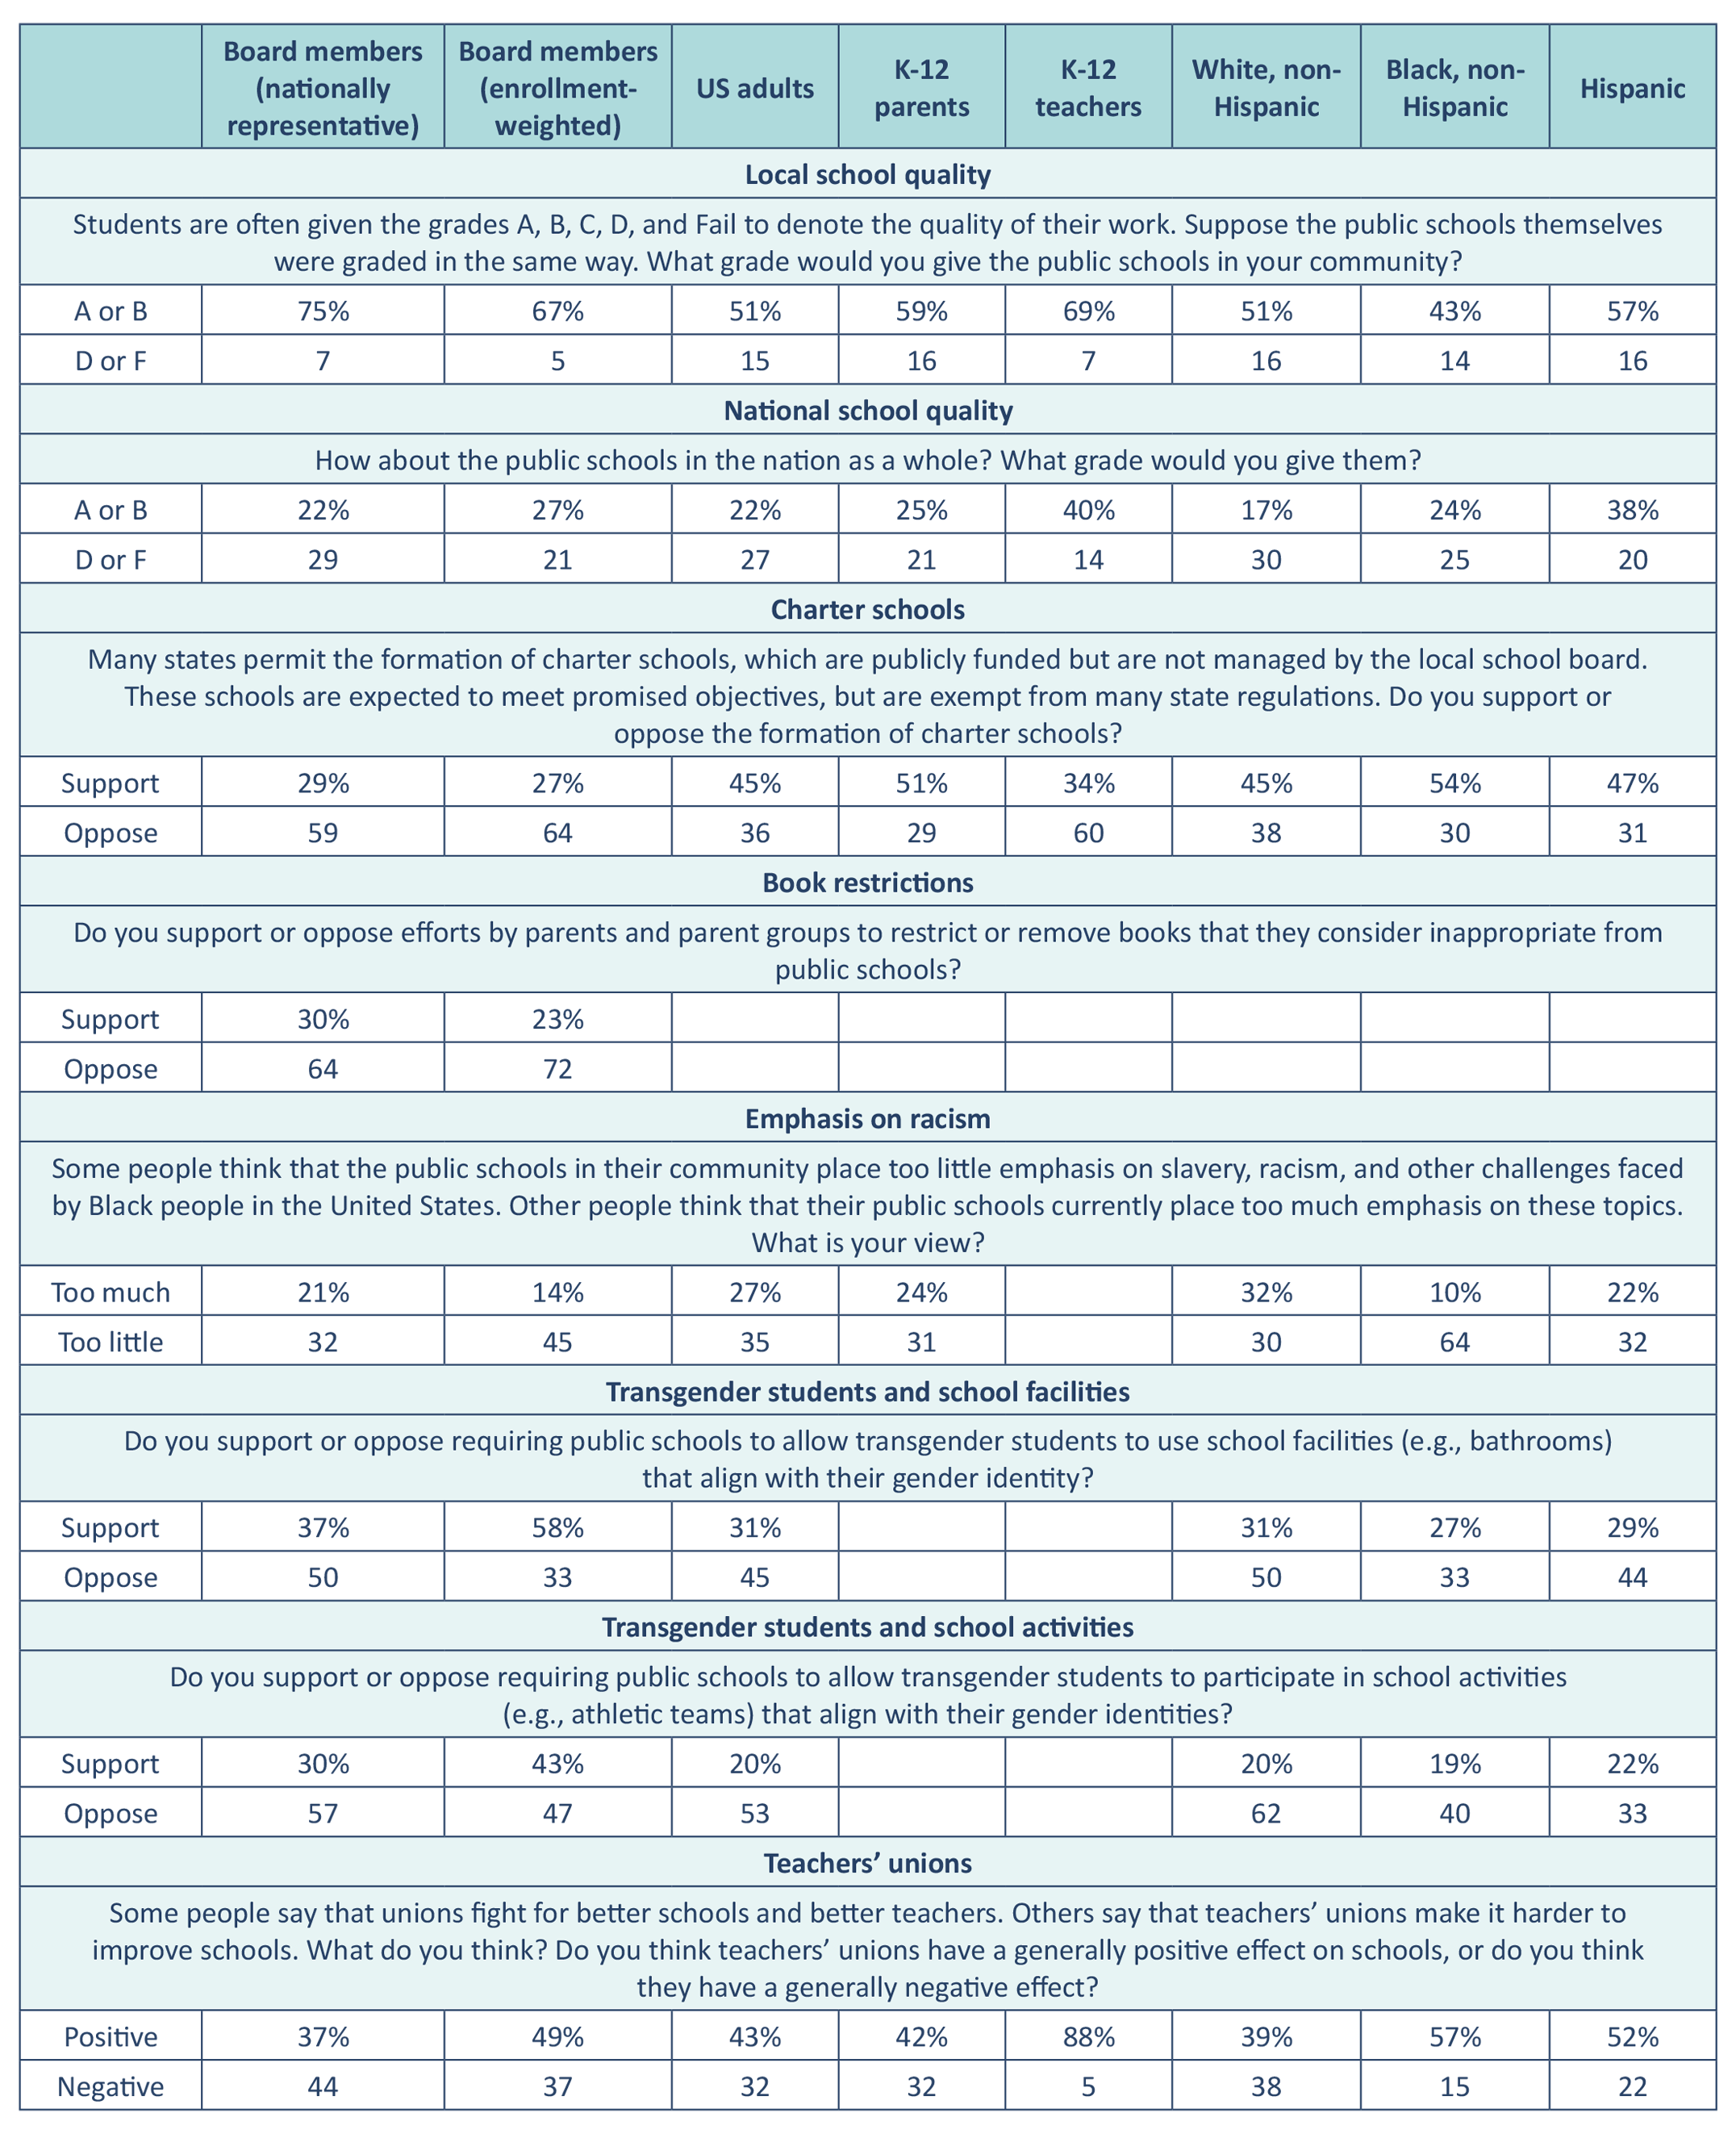
Note: Board member (representative) estimates are weighted so that the school districts represented by the individuals in our sample are representative of all districts nationwide with respect to student enrollment, the percentage of enrolled students who are White, the percentage of school-age students living in poverty, and population density. Board member (proportional) estimates are positively weighted by student enrollment. Estimates for comparison groups regarding local school quality, national school quality, charter schools, emphasis on racism, and teachers’ unions are drawn from the 2022 Education Next Survey of Public Opinion. Estimates for comparison groups regarding transgender students and school facilities/activities are drawn from the 2023 Cooperative Election Study. Estimates for K–12 teachers, when available, are drawn from the 2020 Education Next Survey of Public Opinion.
Table A5: School board members’ opinions and political party affiliation.
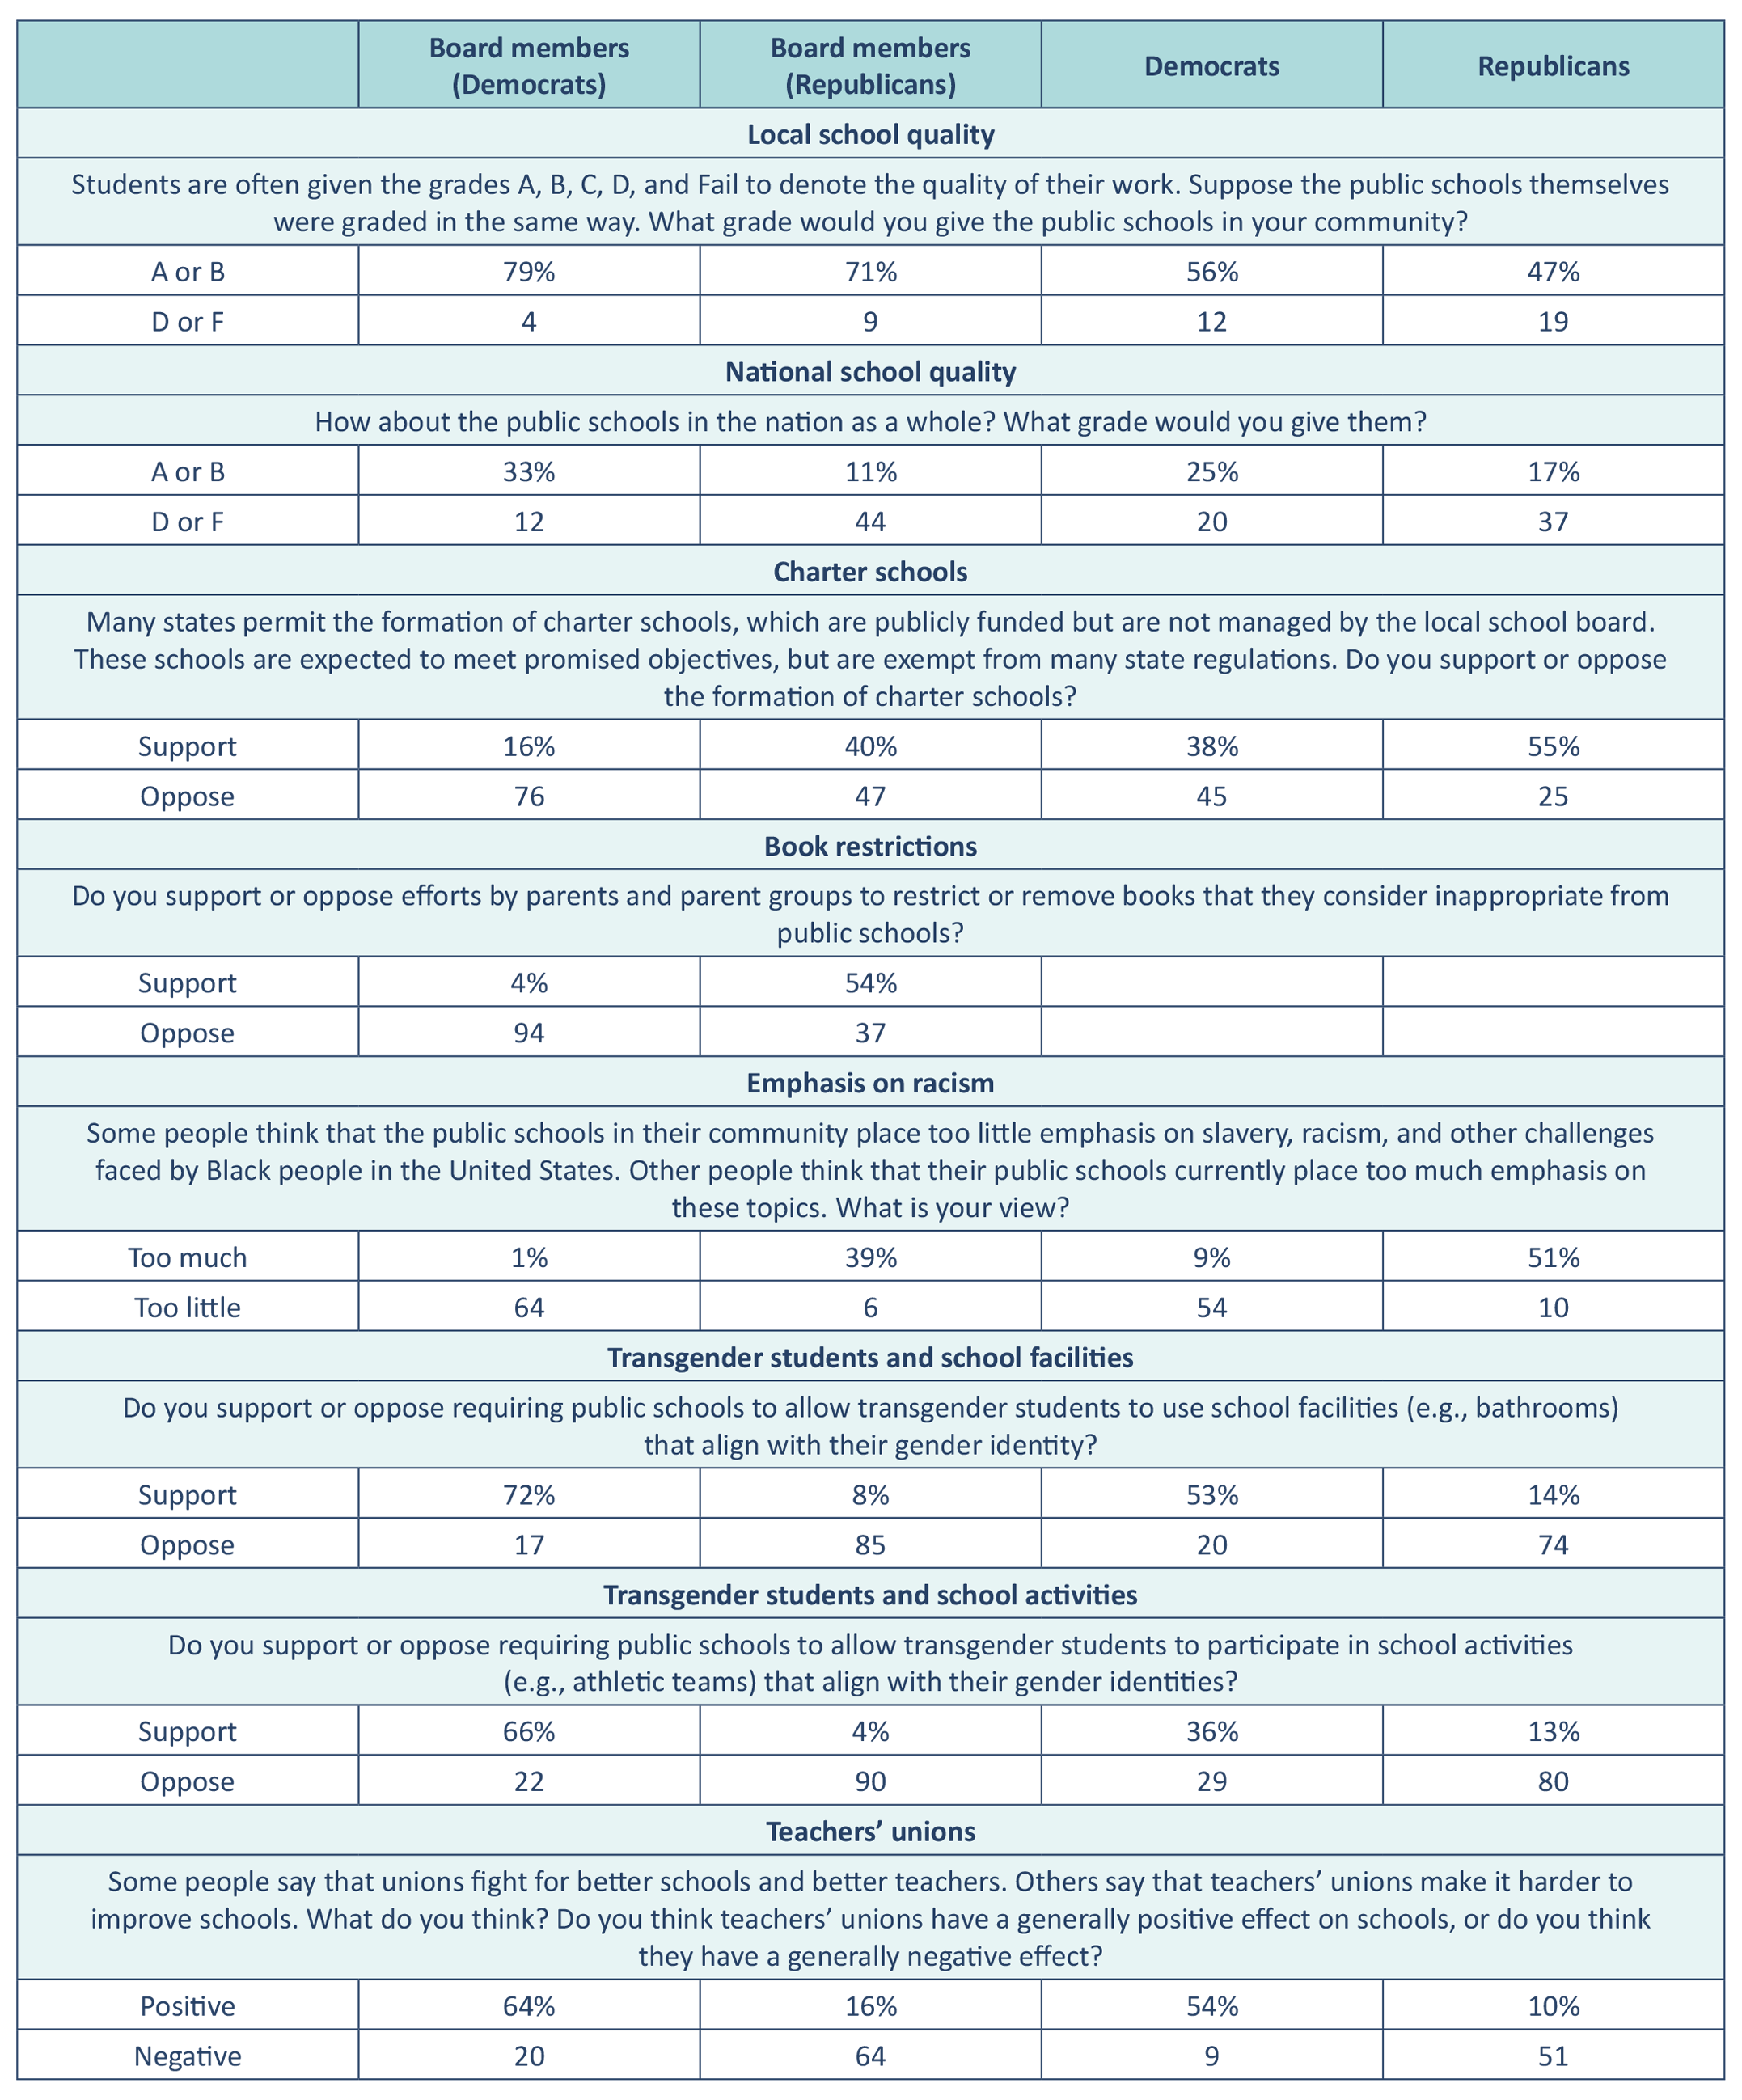
Note: School board member estimates are weighted so that the school districts represented by the individuals in our sample are representative of all districts nationwide with respect to student enrollment, the percentage of enrolled students who are White, the percentage of school-age students living in poverty, and population density. Estimates for comparison groups regarding local school quality, national school quality, charter schools, emphasis on racism, and teachers’ unions are drawn from the 2022 Education Next Survey of Public Opinion. Estimates for comparison groups regarding transgender students and school facilities/activities are drawn from the 2023 Cooperative Election Study. Estimates for K–12 teachers, when available, are drawn from the 2020 Education Next Survey of Public Opinion.
Table A6: School board members’ perceptions of school board elections.
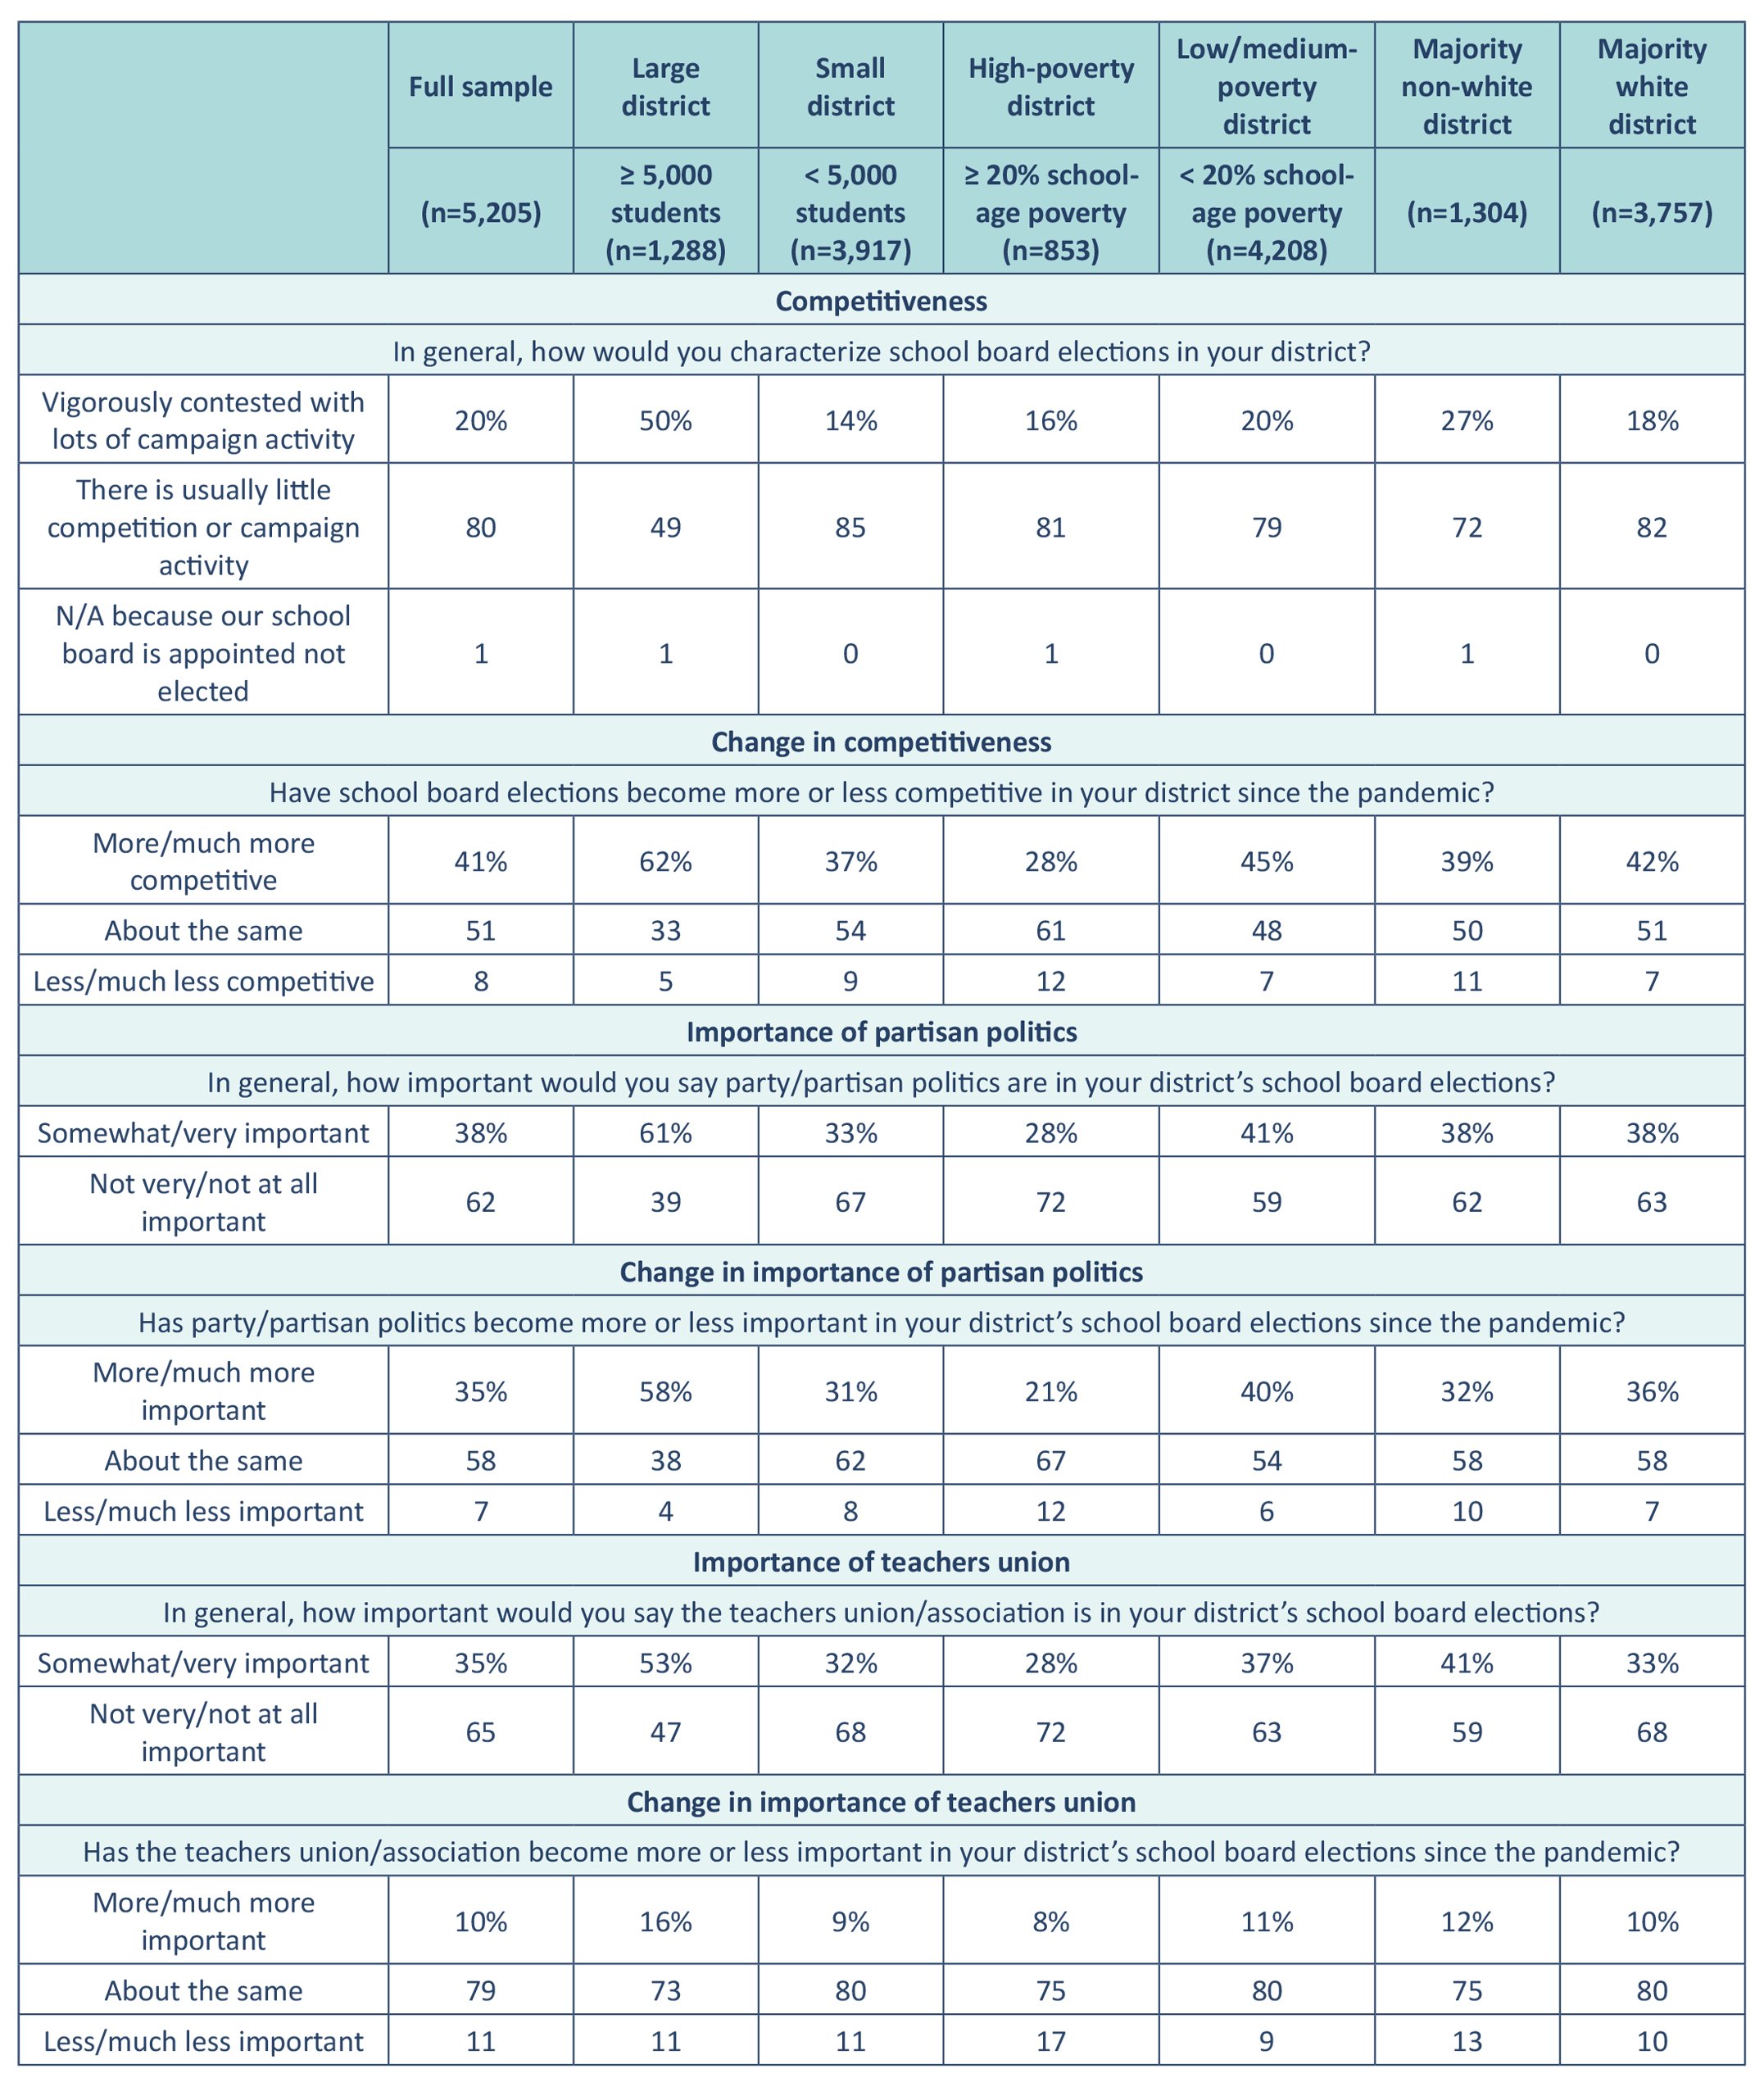
Note: School board member estimates are weighted so that the school districts represented by the individuals in our sample are representative of all districts nationwide with respect to student enrollment, the percentage of enrolled students who are White, the percentage of school-age students living in poverty, and population density.
Endnotes
[1] “Analysis of School District and Board Member Characteristics, 2022.” Ballotpedia, August 24, 2022. https://ballotpedia.org/Analysis_of_school_district_and_board_member_characteristics,_2022
[2] Valant, Jon. “Democrats’ Views on Charters Diverge by Race as 2020 Elections Loom.” Brookings Institution (blog), May 21, 2019. https://www.brookings.edu/articles/democrats-views-on-charters-diverge-by-race-as-2020-elections-loom/
[3] Kogan, Vladimir. No Adult Left Behind: How Politics Hijacks Education Policy and Hurts Kids. Cambridge: Cambridge University Press, 2025, 95.
[4] Barnum, Matt. “Did School Closures Help Youngkin Win in Virginia? Yes, a Bit, Analysis Suggests.” Chalkbeat, December 8, 2021. https://www.chalkbeat.org/2021/12/8/22814789/youngkin-virginia-election-school-closures; Nora Kenney and Michael Hartney. “Virginia Showed That Parents Won’t Put Up with Being Ignored by School Boards.” Manhattan Institute, November 9, 2021. https://manhattan.institute/article/virginia-showed-that-parents-wont-put-up-with-being-ignored-by-school-boards; Stephanie Saul. “How a School District Got Caught in Virginia’s Political Maelstrom.” The New York Times, November 14, 2021. https://www.nytimes.com/2021/11/14/us/loudoun-county-school-board-va.html; Mark Walsh. “Virginia Supreme Court Backs Teacher Who Spoke Against Transgender Policy at Board Meeting.” Education Week, August 31, 2021. https://www.edweek.org/policy-politics/virginia-supreme-court-backs-teacher-who-spoke-against-transgender-policy-at-board-meeting/2021/08
[5] Tyack, David B. The One Best System: A History of American Urban Education. Cambridge, MA: Harvard University Press, 1974.
[6] Henig, Jeffrey R. The End of Exceptionalism in American Education: The Changing Politics of School Reform. Cambridge, MA: Harvard Educational Press, 2013; Kenneth J. Meier and Amanda Rutherford. The Politics of African-American Education: Representation, Partisanship, and Educational Equity. Cambridge: Cambridge University Press, 2017; Tyack, The One Best System.
[7] Tyack, David B., and Elisabeth Hansot. “Conflict and Consensus in American Public Education.” Daedalus 110, no. 3 (1981): 1–25.
[8] Erie, Steven P. Rainbow’s End: Irish-Americans and the Dilemmas of Urban Machine Politics, 1840–1985. Berkeley: University of California Press, 1990; Kirst, Michael W. “Turning Points: A History of American School Governance.” In Who’s in Charge Here? The Tangled Web of School Governance and Policy, edited by N. Epstein, 14–41. Washington, D.C.: Brookings Institution Press, 2004; Labaree, David F. Someone Has to Fail: The Zero-Sum Game of Public Schooling. Cambridge, MA: Harvard University Press, 2010.
[9] Collins, Jonathan E. “Should School Board Elections Be Partisan?” Kappan, December 2, 2024. https://kappanonline.org/should-school-board-elections-be-partisan; Hartney, Michael T. “Revitalizing Local Democracy: The Case for On-Cycle Local Elections.” Manhattan Institute, October, 2021. https://media4.manhattan-institute.org/sites/default/files/MI-issue-brief-hartney-election-timing.pdf; Abowitz, Kathleen Knight. “School Boards, Long Locally Focused and Nonpartisan, Get Dragged into the National Political Culture Wars.” The Conversation, June 3, 2024. https://theconversation.com/school-boards-long-locally-focused-and-nonpartisan-get-dragged-into-the-national-political-culture-wars-229143
[10] Druckman, James N., et al. Partisan Hostility and American Democracy: Explaining Political Divisions and When They Matter. Chicago, IL: University of Chicago Press, 2024; Mason, Lilliana. Uncivil Agreement: How Politics Became Our Identity. University of Chicago Press, 2018.
[11] Bushweller, Kevin. “Americans’ Satisfaction with Public Schools Hits 24-Year Low.” Education Week, February 5, 2025. https://www.edweek.org/leadership/americans-satisfaction-with-public-schools-hits-24-year-low/2025/02
[12] Ford, Michael R., and Douglas M. Ihrke. “Board Conflict and Public Performance.”; Hess, Frederick M. School Boards at the Dawn of the 21st Century.; Hess, Frederick M., and David L. Leal. “School House Politics.”; Hess, Frederick M., and Olivia Meeks. School Boards Circa 2010. National School Boards Association, 2011; National School Boards Association. Today’s School Boards and Their Priorities for Tomorrow.
[13] Fischer, Brett. “No Spending Without Representation: School Boards and the Racial Gap in Education Finance.” American Economic Journal: Economic Policy 15, no. 2 (2023): 198–235; Kogan, Vladimir, et al. “How Does Minority Political Representation Affect School District Administration and Student Outcomes?” American Journal of Political Science 65, no. 2 (2021a): 699–716.
[14] Kogan, Vladimir, et al. “The Democratic Deficit in U.S. Education Governance.” American Political Science Review 115, no. 3 (2021b): 1082–1089.
[15] Flavin, Patrick, and Michael T. Hartney. “Racial Inequality in Democratic Accountability: Evidence from Retrospective Voting in Local Elections.” American Journal of Political Science 61, no. 3 (2017): 684–697.
[16] Gleason, Shane A., and Christopher T. Stout. “Who Is Empowering Who: Exploring the Causal Relationship Between Descriptive Representation and Black Empowerment.” Journal of Black Studies 45, no. 7 (2014): 635–659; Rocha, Rene R., et al. “Race and Turnout: Does Descriptive Representation in State Legislatures Increase Minority Voting?” Political Research Quarterly 63, no. 4 (2010): 890–907.
[17] Hartney, Michael T., and Sam D. Hayes. “Off-Cycle and Out of Sync: How Election Timing Influences Political Representation.” State Politics & Policy Quarterly 21, no. 4 (2021): 335–354.
[18] Biasi, Barbara, et al. “Identity and Ideology in the Boardroom.” Working paper, 2025.
[19] Hess, Frederick M. School Boards at the Dawn of the 21st Century: Conditions and Challenges of District Governance. Alexandria, VA: National School Boards Association, 2002. https://www.aei.org/wp-content/uploads/2011/10/20060228_SchoolBoards.pdf; Hess, Frederick M., and David L. Leal. “School House Politics: Expenditures, Interests, and Competition in School Board Elections.” In Besieged: School Boards and the Future of Education Politics, edited by William G. Howell. Washington, D.C.: Brookings Institution Press, 2005.
[20] Hess, Frederick M., and Olivia Meeks. School Boards Circa 2010: Governance in the Accountability Era. National School Boards Association, Thomas B. Fordham Institute, and Iowa School Boards Foundation, 2011. https://www.aei.org/wp-content/uploads/2011/10/HessFeb2011.pdf?x85095
[21] Ford, Michael R., and Douglas M. Ihrke. “Board Conflict and Public Performance on Urban and Non-Urban Boards: Evidence from a National Sample of School Board Members.” Journal of Urban Affairs 39, no. 1 (2016): 108–121.
[22] National School Boards Association. Today’s School Boards and Their Priorities for Tomorrow. Alexandria, VA: National School Boards Association, 2018. https://cdn-files.nsba.org/s3fs-public/reports/K12_National_Survey.pdf
[23] Grossmann, Matt, et al. “All States Close but Red Districts Reopen: The Politics of In-Person Schooling During the COVID-19 Pandemic.” Educational Researcher 50, no. 9 (2021): 637–648; Hartney, Michael T., and Leslie K. Finger. “Politics, Markets, and Pandemics: Public Education’s Response to COVID-19.” Perspectives on Politics 20, no. 2 (2022): 457–473; Houston, David M. “Polarization, Partisan Sorting, and the Politics of Education.” American Educational Research Journal 61, no. 3 (2024): 508–540; Saavedra, Anna, et al. Searching for Common Ground: Widespread Support for Public Schools but Substantial Partisan Divides About Teaching Contested Topics. Los Angeles: University of Southern California, February 2024. https://www.the74million.org/wp-content/uploads/2024/04/UAS_CARE_Searching_For_Common_Ground.pdf; Stanford, Libby, et al. “Which States Have Private School Choice?” Education Week, January 31, 2024. https://www.edweek.org/policy-politics/which-states-have-private-school-choice/2024/01
[24] Although this may seem like a low response rate, it compares reasonably well with other national surveys of political elites, especially as response rates in polling have declined in recent years (see, for example, Butler and Dynes 2016; Anzia 2022).
[25] See Appendix for a more detailed discussion of nonrandom nonresponse in the context of our survey.
[26] See Appendix for a more detailed discussion of our approach to weighting.
[27] Prior research suggests that so-called “partisan leaners” behave in ways very similar to their peers who explicitly embrace one party or the other (Keith et al. 1992; Magleby et al. 2011).
[28] Igielnik, Ruth, Scott Keeter, and Hannah Hartig. “Behind Biden’s 2020 Victory: An Examination of the 2020 Electorate, Based on Validated Voters.” Pew Research Center, 2021. https://www.pewresearch.org/wp-content/uploads/sites/20/2021/06/PP_2021.06.30_validated-voters_REPORT.pdf
[29] Ford, Michael R., and Douglas M. Ihrke. “Board Conflict and Public Performance.”; Hess, Frederick M. School Boards at the Dawn of the 21st Century.; Hess, Frederick M., and David L. Leal. “School House Politics.”; Hess, Frederick M., and Olivia Meeks. School Boards Circa 2010. 2011; National School Boards Association. Today’s School Boards and Their Priorities for Tomorrow.
[30] Knight Foundation. “Americans’ Views on Book Restrictions in U.S. Public Schools.” August 2024. https://knightfoundation.org/wp-content/uploads/2024/08/Americans-Views-on-Book-Restrictions-in-U.S.-Public-Schools-2024.pdf
[31] While dividing board members into two groups—matching and not matching—provides an accessible way of assessing representativeness, it works better for issues with clearly Democratic- or Republican-aligned positions. Conceptualizing representativeness as a dichotomy can obscure finer gradations in the degree of alignment for each issue. Another way to compare board members’ views is to calculate the correlations between them (see Table A2). We find that there is essentially no relationship between board members’ views on charter schools (measured on a five-point scale from “strongly oppose” to “strongly support”) and the percentage of voters in their district who voted for Trump. The correlations get progressively stronger with respect to board members’ views regarding teachers’ unions, book restrictions, teaching about racism, and the rights of transgender students. Representativeness thus varies by issue and is more pronounced for some of the so-called culture war issues that are the ostensible source of many recent school board conflicts.
[32] Kogan, Vladimir, Stéphane Lavertu, and Zachary Peskowitz. “High Turnover with Low Accountability: Local School Board Elections in 16 States.” AERA Open 11 (2025): 23328584251349180.
[33] Ballotpedia. “Rules Governing Party Labels in School Board Elections.” 2025. https://ballotpedia.org/Rules_governing_party_labels_in_school_board_elections
[34] Peterson, Paul E., et al. Teachers Versus the Public: What Americans Think About Schools and How to Fix Them. Washington, D.C.: Brookings Institution Press, 2014.
[35] Strunk, Katharine O., and Jason A. Grissom. “Do Strong Unions Shape District Policies? Collective Bargaining, Teacher Contract Restrictiveness, and the Political Power of Teachers’ Unions.” Educational Evaluation and Policy Analysis 32, no. 3 (2010): 389–406.
[36] Rogers, John, et al. The Costs of Conflict: The Fiscal Impact of Culturally Divisive Conflict on Public Schools in the United States. Los Angeles: UCLA Institute for Democracy, Education, and Access, 2024. https://idea.gseis.ucla.edu/publications/files/costs-of-conflict-report
[37] Kogan, No Adult Left Behind.
[38] For surveys that use a probability-based sampling procedure to contact potential participants, the term √((N − n)/n) is replaced with √((1 − pr)/pr), in which pr is the response rate. Because the pool of potential participants is a random sample of the overall population, it is the size of the pool—rather than the size of the population—that matters.
[39] According to Mercer et al.’s (2018) comparison of different approaches to weighting, the choice of variable used to construct weights is of greater consequence than the statistical method used to compute them. For this reason, we opt for cell weighting—rather than raking or other more algorithmically complex approaches—because of its simplicity and ease of communication (Bailey 2024).
[40] Lohr, Sharon. Sampling: Design and Analysis. 2nd ed. Boston, MA: Brooks/Cole, 1999. Lohr recommends a grouping structure in which there are at least twenty observations in each group. With 5,346 respondents and eighty-one possible groups, we would have sixty-six observations per group if the sample were evenly divided.
About this Study
This report was funded in part by The Wallace Foundation. Any opinions, findings, and conclusions or recommendations expressed in this material are those of the author(s) and do not necessarily reflect the views of The Wallace Foundation. The report was also funded in part by our sister organization, the Thomas B. Fordham Foundation. We are grateful to Boston College professor Michael Hartney and George Mason University professor David Houston for their diligent work on the report and the resulting insights from their analysis. Thanks also to external reviewers Leslie Finger, assistant professor of political science at the University of North Texas, and Sarah Anzia, the Chancellor's Professor of Public Policy & Political Science at the University of California, Berkeley, both of whom offered helpful feedback on a draft of the study.
At the Fordham Institute, we express gratitude to national research director Adam Tyner for managing the project and editing the report; Chester E. Finn, Jr. and Michael J. Petrilli for providing feedback on drafts; Robert Chung for assisting with editing and formatting; Stephanie Distler for managing report production; Victoria McDougald for overseeing media dissemination; and Elainah Elkins for handling funder relations. We also send our heartfelt gratitude to David Yontz for copyediting and Dave Williams for creating the report’s figures.