An overview of Ohio’s recently-enacted family-friendly voucher changes
For nearly twenty years, EdChoice has provided tens of thousands of students with the opportunity to attend private schools via state-funded scholarships, also known as vouchers.
For nearly twenty years, EdChoice has provided tens of thousands of students with the opportunity to attend private schools via state-funded scholarships, also known as vouchers. Eligibility for “performance-based” EdChoice has traditionally been tied to school report card ratings; students who were slated to attend a school designated by the state as low-performing were able to apply. “Income-based” EdChoice scholarships, on the other hand, are available for students whose families fall below a certain income threshold.
In December 2020, Senate Bill 89 made two big changes to EdChoice. First, it tied performance-based eligibility to federal poverty rates and performance index scores rather than school report card ratings. Second, it broadened income-based eligibility to include more middle-income families. These reforms made private schools more accessible to thousands of families.
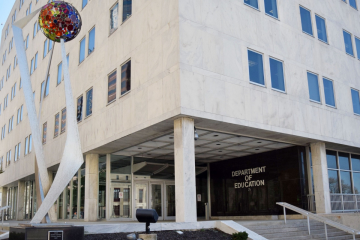
The legislature didn’t stop there, though. The recently passed budget also made some big structural changes, including eliminating the cap on the number of EdChoice scholarships the Ohio Department of Education (ODE) can award each year, increasing the maximum scholarship dollar amounts, and directly funding EdChoice scholarships rather than relying on deductions from districts’ state aid.
These are important adjustments, and they’ll certainly revolutionize Ohio’s voucher landscape on a broad scale. But the budget also included some smaller, under-the-radar provisions that could have a huge impact on individual students and families. Here’s a look at three important ones.
1. Eligibility expansion
The budget identifies several new groups of students who will be automatically eligible for an EdChoice voucher. For example, scholarships are now available for foster children and kids who have been placed with a guardian, legal custodian, or kinship caregiver. Such a small tweak may not seem important to those who have no experience with child custody issues. But kids in foster care move far more often than their peers, and that can mean changing school districts, as well. Being able to enroll in a private school—and remain enrolled despite changes in their home address—gives kids consistency and stability. Students who are placed in foster homes or with legal guardians may also have unique needs that require specialized attention. For foster parents or legal guardians who can’t afford private school tuition, a voucher could be a crucial lifeline that allows them to find the school that best meets their student’s needs. Eligibility has also been extended to students who live in a foster home but aren’t a foster child themselves. This is hugely important because it’s much easier for families to manage transportation, extracurriculars, adult involvement, and myriad other issues when kids attend the same school.
The budget also extends EdChoice eligibility to students who were previously diagnosed with special needs. In Ohio, there are two voucher programs that serve students with disabilities: the Autism Scholarship Program and the Jon Peterson Special Needs Scholarship Program. To take advantage of these scholarships, students must have a current IEP through their district of residence. When students no longer require special education services, they cease to be eligible for a voucher. For families who wish to keep their student enrolled in private school but can’t afford it without assistance, this loss can be devastating. Thanks to the recent budget, however, these families will have the option to smoothly transition to the EdChoice program.
2. Eligibility awareness
One of the longstanding issues with performance-based EdChoice is that it can be difficult for families to determine whether their children are eligible. Neither ODE nor traditional public districts are required to notify parents if their child attends a designated school. Nonprofit organizations, like School Choice Ohio, work incredibly hard to notify parents of their eligibility and answer questions, but their reach is limited and their work contested by powerful entrenched interests. Parents who are savvy enough to find the designated school list that ODE publishes annually can track down their eligibility status, but that assumes they know where to look.
A provision in the state budget should remove some of the guesswork. It requires ODE to create a system that allows families to input an address and receive a response within ten days that confirms whether the student living at that address is eligible for EdChoice. To keep the system updated, districts will be required to provide the attendance zones of their designated buildings by January 1 each year. Districts are also prohibited from contesting eligibility determinations. This isn’t a perfect solution. Ideally the system would be able to confirm eligibility immediately. But this is far better than the status quo, and should make it easier for parents to determine their options.
3. The application process
There are also administrative changes that should make the application process smoother for families. For example, the budget eliminates the separate application windows for both EdChoice programs and the Cleveland Scholarship Program, as well as the confusing “priority application window” for income-based EdChoice. Instead, the legislation requires all three programs to have an application window that opens on February 1. Having one application window for all three programs should make communicating with families much easier and should eliminate potential confusion among applicants.
Additionally, ODE must now determine if students are eligible and notify them within forty-five days of receiving their application for any of these three programs. Under current rules, families must be notified within thirty days of ODE making a decision, but there are no specifications for how long the department can take to actually make their decision. This means that families could be waiting for months to find out whether they’ve been awarded a scholarship. These changes will ensure that families get a quicker turnaround on scholarship status and can plan accordingly for the coming fall.
***
Over the last few years, Ohio has seen plenty of changes to its five voucher programs. Expanded eligibility, increased dollar amounts, and the transition to direct funding are huge improvements. But seemingly small changes—guaranteed eligibility for vulnerable students, better information, and a clearer application process—deserve praise, as well. These provisions will make voucher programs work better for students and families. And at the end of the day, that’s what matters most.
Earlier this summer, Ohio’s state superintendent Paolo DeMaria announced his retirement, effective in September. We at Fordham wholeheartedly salute DeMaria for his work on behalf of students and his leadership in helping schools navigate the challenges of the past year.
The state board of education is tasked with finding his replacement, and attracting a high-caliber education chief should be a top priority. To be sure, this won’t be a cushy job for the faint-of-heart. He or she will need to traverse heated political debates and win support from strong-willed lawmakers and board members. The state superintendent will also oversee the work of the Ohio Department of Education (ODE), an agency that implements and enforces education laws. The good news, though, is that Ohio has lots going for it in the area of K–12 education. The next superintendent will have abundant opportunities to make a mark on policies that impact Ohio’s two million public and private school students. Consider five such opportunities.
Opportunity 1: Cement into place a revamped school report card. After months of debate, lawmakers recently overhauled the state’s school report cards. Supported by a number of education groups (including Fordham), the new system should yield ratings that are fairer to schools and provide the public with easy-to-use information about school quality. While the legislature has created the statutory framework, the state board and Ohio Department of Education (ODE) will need to iron out some of the details in the coming months. Most notably, they’re tasked with setting rigorous but attainable “grading scales” for each report card measure and ensuring clear presentations of the ratings and underlying data. This technical work must be done right. But just as importantly, the next state superintendent will have to clearly explain the crucial role report cards play in a healthy, responsible, and transparent public school system. That type of vocal leadership can build the public support and confidence needed for the new report cards to be successful.
Opportunity 2: Energetically advance the state’s early literacy initiatives. Recognizing the link between early literacy and students’ long-term success, Ohio lawmakers passed the Third Grade Reading Guarantee in 2012. Its most well-known provision is mandatory retention when students cannot demonstrate fluency on third grade reading assessments. But there are other crucial dimensions to the policy that help ensure that children receive the supports needed to reach that vital benchmark. These include required parental notification and reading plans for off-track children, and intensive interventions for retained students. Despite its importance, the policy has faced political pushback and uneven implementation. The next superintendent could jump-start this vital initiative by pushing for rigorous implementation and voicing support for early literacy.
Opportunity 3: Lay a solid foundation for the state’s brand-new enrichment ESA. In a state budget bill chock-full of exciting initiatives, one of the most tantalizing is the creation of an educational savings account (ESA). This program will open afterschool and enrichment opportunities for low- and middle-income students by providing $500 per year that parents can spend on approved activities. The ESA holds much promise to narrow “opportunity gaps,” but its future beyond 2023 is uncertain because it’s being funded through temporary federal relief dollars. To sustain the program over the long-haul, lawmakers will likely need to commit state money and may even need to increase the outlay to meet parent demand, as dollars could easily run out if applications exceed the appropriation. Getting the program off on the right foot will be critical, and ODE will play a key role in making sure that happens. The agency will accept applications, select a vendor that creates the accounts and monitors spending, and inform parents about acceptable uses of the dollars. Active involvement from the state chief could help position the program for growth in the years ahead.
Opportunity 4: Push for excellent career and technical education and work-based learning. Recognizing the need to strengthen the technical skills of Ohio students, state policymakers have ramped up support for CTE. In the recently passed budget, lawmakers allocated $20.5 million for programs that reward schools when students earn industry recognized credentials. These funds will supplement the already generous categorical “add-on” dollars that schools have long received when pupils take various CTE courses. With such goodwill, the next state superintendent should have plenty of room to showcase high-quality CTE and workforce development initiatives. By the same token, he or she may need to put their foot down at times to ensure that these programs are truly opening doors to great careers—not rewarding lower-level skills that don’t allow students to stand out and get ahead in the workplace.
Opportunity 5: Champion great educational options for all Ohio students. Ohio has a proud history of pioneering educational choice, but recent policy developments have accelerated the move to empower parents and students. Today, Ohio has a plethora of public school options, which include district-run magnet schools, regional STEM schools, and public charter schools. Interdistrict open enrollment is an option for most Ohio students. High school students can take college-level courses via College Credit Plus or CTE courses at their local joint-vocational school. With expanded eligibility for state-funded scholarships, more Ohio students than ever have private-school options. In the most recent budget, lawmakers even recognized the dedication and contributions of parents who homeschool their children by offering modest tax relief. The next state superintendent will have ample opportunity to champion a rich plurality of educational options and support the growth of choices that meet the unique needs of all Ohio students.
***
Just like the president has many hats, the state superintendent plays many roles as well. He or she will need to work diplomatically with lawmakers and the state board to get things done. They’re responsible for supervising one of the nation’s largest and most diverse school systems, and for communicating state education priorities to the broader public. It’s a big job with big opportunities. And for someone who is ready to make a difference in the lives of millions of students, it might just be the job of a lifetime.
Before they can stand in front of a classroom full of students, most prospective teachers have to pass state licensure exams. But how many candidates pass those exams on the first try and how many need multiple attempts? Which schools fare best at readying their students for these exams?
Such data can reveal critical information about teacher preparation programs. High pass rates could indicate programs that maintain rigorous standards and excel at preparing future teachers, while low rates may reveal the opposite. A close look at retake rates could spotlight programs that go above and beyond to support candidates who don’t pass on their first attempt. And disaggregating pass-rate data by demographic factors such as race and socioeconomic status could help advocates pinpoint gaps and devise solutions to diversify the teaching force.
Pass-rate data are gathered at the federal and state levels, but little of it is detailed enough to help guide policy making. To fill the void, the latest report from the National Council on Teacher Quality (NCTQ) offers an in-depth look at institutional pass rates for subject-content exams taken by elementary teaching candidates. NCTQ’s decision to focus on elementary content exams is important because, unlike their secondary counterparts, elementary teachers are generally responsible for teaching all subjects. That includes reading, and research shows that background and content knowledge in other subjects is crucial when kids are learning to read. NCTQ’s analysis includes national data, case studies on exceptional states and institutions, and dashboards for the majority of states—including Ohio.
There are three things to note before diving into the Ohio data. First, teacher licensure exams vary by state. Some states use Praxis or NES exams, while others use state-specific exams. Ohio uses the Ohio Assessments for Educators (OAE). Like NES exams, OAEs are developed by the national testing giant Pearson. Unlike NES, however, they are unique to Ohio and the state’s learning standards. That makes it difficult to compare Ohio’s results to those of other states, especially those that use exams from another test maker. Second, while there is research showing a positive relationship between licensure exams and student outcomes, this research does not appear to include OAEs. Without a rigorous study of Ohio’s exams, it’s difficult to use pass rates to gauge the effectiveness of individual preparation programs. That’s especially true because we can’t be sure the cut scores set by the state board are appropriately high (history shows a questionable track record). Third, a number of Ohio programs—over a dozen on most measures—had too few test takers to report pass rates. These institutions could be doing a stellar job of preparing future teachers, or they could be struggling. Without data, we just don’t know.
That said, it’s useful and important to analyze the pass rates at Ohio institutions. The OAE elementary education content exam comprises two subtests—one that assesses content knowledge for English language arts and social studies, and a second that covers content in math, science, health, fitness, and the arts. NCTQ focused on results from subtest two because, based on first-attempt pass rates, it appeared to be more challenging. Their data-set includes assessment results from September 2015 through August 2018. Here’s a look at three big takeaways from the NCTQ analysis.
1. Most prospective elementary teachers ultimately pass their licensure exams.
As is typically the case with licensure exams in other career fields, teacher candidates have multiple opportunities to pass their exams. In Ohio, the best-attempt pass rate—the percentage of candidates who ultimately pass the exam regardless of their number of attempts—is 87 percent. Institution-specific pass rates range from 58 to 100 percent. The three poorest performing institutions were Urbana University (58 percent), University of Rio Grande (64 percent), and Antioch University Midwest (69 percent). The top performers were Ohio Northern University and Lake Erie College, both of which posted a 100 percent pass rate, and the University of Toledo which clocked in at 95 percent.
2. First-attempt pass rates are lower and vary widely between institutions.
First-attempt pass rates are an important measure because taking licensure tests multiple times is both expensive and time-consuming. The more teacher candidates who take and pass exams on the first try, the better. In Ohio, 72 percent of test takers pass on their first attempt. That’s a decent average, but it masks sizable variation among institutions. For example, the three poorest performing institutions had first-try pass rates below 50 percent: University of Rio Grande (21 percent), Antioch University Midwest (40 percent), and Urbana University (46 percent). Unsurprisingly, these are the same institutions that posted the state’s lowest best-attempt pass rates. The three highest performers, meanwhile, were Capital University (90 percent), Ohio Wesleyan University (88 percent), and Miami University (87 percent).
3. Pass rates based on other factors are a mixed bag.
NCTQ used admissions selectivity ratings from their 2018 Teacher Prep Review to determine whether some less-selective institutions still managed to achieve high pass rates. Despite getting a grade of C on the 2018 review—which NCTQ equates to being “moderately selective”—Bluffton University and Lake Erie College both registered first-attempt pass rates that were higher than the state average.
Bluffton University also did well when the data were broken down by socioeconomic status. There were only eight institutions where 36 percent or more of all undergraduate students were Pell grant recipients. Such a low number indicates that more work should be done to recruit teachers from low-income backgrounds. Of those eight, only Bluffton University and Cincinnati Christian University earned first-attempt pass rates that were higher than the state average. These data suggest that the schools that do have significant numbers of candidates from low-income backgrounds could be doing more to help them pass their exams on the first try.
Most institutions had too few test takers of color to report disaggregated pass rate data. This, too, points to a significant problem: there are too few candidates of color enrolled in Ohio teacher preparation programs. As the NCTQ report notes, teachers of color have been shown to improve learning outcomes for all students, particularly for students of color. Addressing the dearth of teaching candidates of color should be a top priority for preparation programs and the state.
***
What to do with all these data? On the policy front, Ohio should make two moves. First, the state should investigate how it can track and publish data for all required licensure exams with the same level of detail that the NCTQ report offers. NCTQ does great work, but Ohio’s prospective teachers, teacher preparation programs, policymakers, and advocates would benefit from having consistent data about pass rates for all licensure exams. Second, the state should consider modifying the OAE elementary education exam so that it separately tests knowledge in each core subject area. Right now, English language arts and social studies are combined under one subtest, while the second combines math, science, art, health, and fitness. Combining these subjects into one test is certainly expedient, but elementary teachers need to have a firm grasp of all the subjects they’ll be required to teach. A combination test can mask deficiencies in one area and make it impossible to ensure that prospective teachers have sufficiently mastered the necessary content.
Such data are also useful to elementary education preparation programs. Those with troublingly low pass rates should look to their more successful peers for best practices to boost a higher percentage of their candidates over the top. And every institution would benefit from investigating how to attract more candidates of color and Pell Grant recipients. As NCTQ notes, teacher preparation programs didn’t create systemic educational inequities, but they are “in a prime position to take action and close these gaps.” A good first step would be analyzing and using these data to improve.
Opponents of school choice in Ohio continue to threaten a lawsuit seeking to eradicate the state’s largest private-school scholarship program, known as EdChoice. They’ve accused it of “draining” money from traditional school districts and harming those who remain in those schools. Both accusations are bunk. When students use scholarships, state dollars simply follow them—as they should—to their schools of choice. Meanwhile, rigorous studies from Ohio and elsewhere find that district students benefit as private-school competition increases.
In the latest twist, teachers union representative Stephen Dyer claims that EdChoice is causing racial segregation. As reported by the Ohio Capital Journal:
The courts should be interested in the new case because of the potential “de facto” racial segregation issues that could come up because of the increased funding to the private school voucher program, according to Stephen Dyer, director of government relations, communications and marketing for the Ohio Education Association.
“The folks taking the vouchers tend to be less reflective of the demographic composition of the district that their [sic] leaving,” Dyer said on Monday. “Obviously, state-sanctioned racial segregation is not something that the U.S. Supreme Court is fond of.”
Setting aside the fact that SCOTUS has already ruled that publicly-funded scholarships for private schooling are constitutional, accusations of “state-sanctioned racial segregation” would be alarming if true. But is Dyer right or is this just more grandstanding?
No rigorous study exists on the marginal impacts of EdChoice on segregation. Such a study would require tracking individual students’ transfers across public and private schools. But we do know some basic facts that counter Dyer’s sweeping claims: (1) EdChoice is clearly not the cause of racial segregation en masse across Ohio schools; (2) the program serves a much higher proportion of Black and Hispanic families than the average school district; and (3) given the demographics of EdChoice students vis-à-vis their home districts, it’s highly doubtful that the program is significantly worsening segregation in the cities with the most scholarship students.
Fact 1: Districts were segregated long before EdChoice came on the scene
The onset of private-school scholarships cannot be blamed for segregating Ohio schools. In 2005–06, the year immediately prior to the introduction of EdChoice, Columbus City Schools were 63 percent Black and 29 percent White; Dayton Public Schools were 71 percent Black and 24 percent White; and Cincinnati Public Schools were 71 percent Black and 23 percent White. The statewide demographics that year were 13 percent Black and 77 percent White. That unevenness cannot be attributed to EdChoice as it didn’t exist at that time.
So let’s not kid ourselves. Ohio school districts have long been, and continue to be, heavily segregated along racial lines. That’s due to residential patterns—minority families tend to live in urban communities—along with district boundaries that force them into less integrated schools. (The discriminatory open enrollment policies of suburban districts don’t help either.) If anything, district boundary lines and the school attendance zones within them—what some have termed “educational redlining”—could be seen as true “state-sanctioned racial segregation.”
Fact 2: EdChoice students are disproportionally Black and Hispanic
Compared with the statewide demographics, EdChoice students are far more likely to be Black or Hispanic. In 2018–19, 38 percent of them were Black, more than double the statewide district average of 16 percent. Eleven percent were Hispanic versus 6 percent statewide. To be sure, these numbers reflect the design of EdChoice, which restricts eligibility to children who are slated to attend low-performing schools or come from lower-income households. Nonetheless, these data remind us that EdChoice serves thousands of minority students—and that the lawsuit disgracefully seeks to destroy educational opportunities for those youngsters and their families.
Figure 1: Demographics of EdChoice participants versus districts statewide

Source: Ohio Department of Education, Test Scores for Voucher Students. Note: The demographics of EdChoice students were calculated based on 2018–19 test-taking data in grades 3–8 and high school, thus excluding some scholarship students (e.g., in grades K–2). Scholarship students from Cleveland are also omitted, since they participate in the Cleveland Scholarship (not EdChoice). It’s not clear whether that program will be challenged in court.
Fact 3: EdChoice students are demographically similar to their district peers in the Ohio Big Eight
As noted above, Dyer contends that scholarship students are “less reflective” of their home districts’ demographics. But are they? The following takes a look at data from seven of Ohio’s Big Eight cities where roughly half of the EdChoice recipients reside. (As explained under Figure 1, Cleveland is omitted.) Focusing on these locales is important for two reasons. First, scholarship students constitute a large-enough share of the city-wide student population that they could in theory alter those districts’ demographics. In Columbus, for example, EdChoice students represent about 7 percent of the pupil population, a higher fraction than the state overall (roughly 2 percent). Second, Ohio’s big-city districts have historically had the most “racially isolated” schools and one might be most concerned about the impacts on segregation in those places.
Figure 2 shows that the racial demographics of scholarship students track closely with local districts. Across the entire Big Eight, 59 percent of EdChoice students are Black or Hispanic, just shy of the 63 percent in district schools. In Akron, Canton, Columbus, and Toledo, a somewhat higher fraction of EdChoice students are Black or Hispanic, though the reverse is true in Cincinnati, Dayton, and Youngstown. These data call into serious question whether the program is, as alleged, worsening public school segregation. Bear in mind, too, this does not compare EdChoice demographics to the private schools they attend, another important consideration. It’s possible that EdChoice allows Black and Hispanic students to attend schools with more White students, thus reducing segregation.
Figure 2: Percentage of Black or Hispanic students, EdChoice versus traditional districts in the Big Eight

See notes under Figure 1 for details about the calculations.
* * *
The EdChoice lawsuit, if and when it comes, is likely to rely on wild conjectures about how the program harms school districts, the latest being unsubstantiated claims about racial segregation. Rather than giving credence to these falsehoods, a closer look at the data allows us to see what this litigation would really do if it were to prevail in court: kill educational opportunity for Ohio students and families, including many Black and Hispanic parents who simply want schools that meet their kids’ needs.

Post-secondary preparation supports are numerous and common in high schools across the country. They run the gamut from Advanced Placement courses and immersive career-technical training to advising and guidance counseling. While voluntary, such supports are often indispensable for students of all backgrounds, especially when the goal is college enrollment. A recent paper provides an interesting case study of one such program in Ohio, aiming to show whether its structure helps build the “cultural capital” of students to help them achieve their college enrollment goals. Even though the data are incomplete, they nonetheless provide insight into students’ engagement in these initiatives.
Researchers from Adrian College, Drexel University, and Bowling Green State University—along with a counseling staffer from Toledo City Schools—looked at the local implementation of a college preparation program funded in part by the federal GEAR UP initiative in an unnamed Ohio high school. The U.S. Department of Education does not codify GEAR UP’s structure, nor do the states receiving funding. The Ohio Department of Higher Education says it is “focused on embedding a college-going culture in targeted schools and communities” through GEAR UP in order “to increase the number of low-income students prepared to enter and succeed in postsecondary education.”
Each grant recipient—generally a consortium of K–12, higher education, and community partners—is responsible for creating a program that it feels is most supportive of its students. The version under study here provides direct student services such as academic coaching, tutoring, and multiple college visits. It also offers parents information about financial aid and how to maximize college fair contacts, as well as providing teacher professional development to support students in their college-going goals. While the state prioritizes lower-income students, most GEAR UP providers don’t limit participation based on income. Students can earn college scholarships via participation, based on their course grades/GPA, discipline and attendance record, community service, and extracurricular activities.
For the program under study, these four activities are measured in a Benchmark Binder that students must compile during high school, along with parental/adult involvement and some bonus activities. Points are assigned on a rubric for each area—with the heaviest weight on academic outcomes and community service—and students who reach a prescribed minimum of points by graduation receive a GEAR UP scholarship (approximately $2,000 to $5,000 per year) to be used at any postsecondary institution of their choice. A high school teacher and four graduate students from a local university partner are available at the students’ convenience to advise, assist, and check progress on Binder completion.
While previous investigations have examined the outcomes of students with GEAR UP access to students without such organized support, the current study looks at a single school where all students had access to GEAR UP but chose varying levels of engagement with it.
The researchers examined a sample of the seniors in the graduating class of 2011, all of whom indicated that they planned to pursue higher education after graduation. Just over 58 percent of the sample were categorized as “active”—that is, they completed their Benchmark Binder and successfully earned the minimum amount of Binder points by graduation to qualify for the scholarship award—and the rest were categorized as “passive,” not having completed or earned the minimum number of Binder points. While demographic comparison was not a primary interest of the researchers, they note that there were 40 percent more females and almost 10 percent more non-white students in the active GEAR UP group compared to the passive group. There were slightly more than 30 percent more low-income students in the passive GEAR UP case group compared to the active case. Focus group interviews were held with students in both groups to determine motivational differences between then.
The results are reported by areas of similarity and areas of difference between the active and passive groups. For example, average GPA increased and average attendance rate decreased for both groups from ninth grade to twelfth grade, while average student behavioral incidents decreased for both groups. Focus group data indicated that students in both groups realized at some point in their four years that they needed to “buckle down” if they were serious about matriculating, and the language each group used was similar. The later students realized they needed to put in more work to reach their goal, the harder it was for them to do so successfully, whether they followed the GEAR UP protocols or not. Participation in extracurricular activities was reported to be easy for members of both groups thanks to numerous sports offered by the school, while community service hours proved more difficult for both groups. Generally, this was due to the off-campus, after-hours nature of the service opportunities available. Positive adult involvement in activities related to building college-going capital was reported as equally important by students in both groups.
However, it was differences between the groups that ultimately told the tale. Although both groups saw an increase in average GPA over four years, students in the passive group went from just 1.88 to 1.97 while the active group went from 2.79 to 3.17. The active group notched a final GPA average of 2.93 (equivalent to a B), while passive students reached just 2.03 (or a C average). Behavioral incidents among the passive students decreased significantly during their high school careers (from 2.11 incidents per year as freshmen to a dramatically lower 0.31 incidents per year as seniors), but the early suspensions and other disciplinary actions took their toll on many students’ momentum and confidence. By contrast, active students started low (0.19 behavioral incidents per year) and ended even lower (0.06 incidents per year). While these data indicate hugely unequal starting points for students, the ultimate goal of such college preparatory efforts is to equalize them over time. It is specifically these students—those who don’t already have an inside track toward college-going capital through family history, financial support, or early academic success—who need the focused support GEAR UP is meant to provide.
In the end, it is a lost opportunity that the researchers chose not to investigate or report how many students in each group ended up successfully enrolling in college. Did the Binder completion effort help students gain capital they would not have otherwise had? Or was it simply one more checkmark for overachievers? Did students who dismissed the effort as early as ninth grade get to college without GEAR UP? If so, who were they and who or what else guided them to their college goal? Could students who didn’t enroll in college have changed their fate with a stronger or earlier effort to complete the Binder activities? With any luck, the research team will examine questions such as these in future studies.
While there is no one sure path into college, college preparatory programs in our high schools should provide the broadest possible opportunity for students to show what they know and can do. And those opportunities must start early, be aligned to what colleges value, be accessible realistically around students’ lives, and clearly demonstrate their importance to students’ future plans.
SOURCE: Christine M. Knaggs, Toni A. May, Kathleen T. Provinzano, John M. Fischer, and Jeffrey Griffith, “Measuring College-Going Cultural Capital of Urban High School Seniors in a Voluntary College Preparatory Program,” The High School Journal (April 2021).