Mobile Navigation

  • National
    • Policy
      • High Expectations
      • Quality Choices
      • Personalized Pathways
    • Research
    • Commentary
      • Gadfly Newsletter
      • Flypaper Blog
    • Events
    • Scholars Program
  • Ohio
    • Policy
      • Priorities
      • Media & Testimony
    • Research
    • Commentary
      • Ohio Education Gadfly Biweekly
      • Ohio Gadfly Daily
  • Charter Authorizing
    • Application
    • Sponsored Schools
    • Resources
  • About
    • Mission
    • Board
    • Staff
    • Career
Home
Home
Advancing Educational Excellence

Main Navigation

  • National
  • Ohio
  • Charter Authorizing
  • About

Ohio Menu

  • Topics
    • Accountability & Testing
    • Advanced Education
    • Career & Technical Education
    • Charter Schools
    • Curriculum & Instruction
    • ESSA
    • Evidence-Based Learning
    • Governance
    • Personalized Learning
    • Private School Choice
    • School Finance
    • Standards
    • Teachers & School Leaders
  • Research
  • Policy
  • Commentary
    • Ohio Gadfly Newsletter
    • Ohio Gadfly Blog
    • Events

The Education Gadfly Weekly

Sign Up to Receive Fordham Updates

We'll send you quality research, commentary, analysis, and news on the education issues you care about.
Thank you for signing up!
Please check your email to confirm the subscription.

Ohio Gadfly Biweekly—Are private schools “unaccountable”?

Volume 15, Number 26
12.17.2021
12.17.2021

Ohio Gadfly Biweekly—Are private schools “unaccountable”?

Volume 15, Number 26
view
Private schools are accountable blog image
School Choice

Are private schools “unaccountable”?

In the debates over private school scholarship (a.k.a. voucher) programs, one of opponents’ favorite talking points is to say that nonpublic schools are “unaccountable” or “unregulated.” To get a flavor, consider the following statements made over the past couple years:

Aaron Churchill 12.17.2021
OhioOhio Gadfly Daily

Are private schools “unaccountable”?

Aaron Churchill
12.17.2021
Ohio Gadfly Daily

Rebutting the union’s misleading comparisons of charter and district schools

Jessica Poiner
12.10.2021
Ohio Gadfly Daily

Boosting the effectiveness of STEM role models

Jeff Murray
12.16.2021
Flypaper

Online courses and college degree completion

Jeff Murray
12.16.2021
Flypaper

Ohio’s Lost Einsteins: The inequitable outcomes of early high achievers

9.28.2021
Report
view
Anti charter blog image

Rebutting the union’s misleading comparisons of charter and district schools

Jessica Poiner 12.10.2021
Ohio Gadfly Daily
view

Boosting the effectiveness of STEM role models

Jeff Murray 12.16.2021
Flypaper
view

Online courses and college degree completion

Jeff Murray 12.16.2021
Flypaper
view

Ohio’s Lost Einsteins: The inequitable outcomes of early high achievers

Scott Imberman 9.28.2021
Report
view
Private schools are accountable blog image

Are private schools “unaccountable”?

Aaron Churchill
12.17.2021
Ohio Gadfly Daily

In the debates over private school scholarship (a.k.a. voucher) programs, one of opponents’ favorite talking points is to say that nonpublic schools are “unaccountable” or “unregulated.” To get a flavor, consider the following statements made over the past couple years:

  • “This harmful [voucher] plan will continue to siphon locally voted tax dollars away from students in public schools and send them to unaccountable private schools.” —Ohio School Boards Association

  • “The Senate education budget will weaken our system of public education...while simultaneously increasing spending on private, unaccountable, and unregulated education opportunities.” —Susie Kaeser of the Ohio League of Women Voters

We at Fordham, and others, have strongly refuted claims that choice programs “siphon” money or “weaken” public education. But less has been written on private-school accountability, particularly in the context of Ohio. Does the “unaccountable” accusation ring true, or is this yet another tall tale? As we’ll see, the reality is far more nuanced than a simplistic talking point.

First and foremost, let us remember that private schools must attract families and students to operate, and they have to regularly prove their value to maintain such allegiances. When private schools fail to meet their “customers’” needs, their budgets shrink—an important form of “consequential accountability.” In an efficient and accountable system, schools would receive dollars based on their actual headcounts. More students mean more dollars and vice versa. The private school system works this way. Schools generate funding through tuition payments and (for some students) publicly funded vouchers, both sources of revenue that are predicated on enrollment. Thus, private schools suffer the fiscal consequences when their enrollments dip; some have even had to close. Because of this threat, private schools are incentivized to work hard to meet the needs of families and students. It’s no surprise, then, that surveys consistently find that private school parents report the most satisfaction with their schools.

In contrast, traditional districts are shielded from budgetary pain when students leave their schools. Ohio, for example, has long provided guarantees—and continues to do so under its new formula—that subsidize districts with shrinking enrollments. Districts are also protected from funding losses through the property tax system, as those revenues are not directly linked to headcounts. Although there is accountability through tax referendums, districts don’t lose local dollars when students head for the exits, and “no” votes can occur for reasons other than parents’ dissatisfaction with their local public schools.

It’s possible that critics are instead thinking of formal interventions for unsatisfactory academic performance, another type of accountability. They’d be right to assert that Ohio does not intervene in private schools on the basis of report card results (a topic we’ll discuss later). And unlike Louisiana, Ohio doesn’t suspend private schools from voucher programs because of low performance.

Nevertheless, it’s a stretch to argue that districts face greater consequences for poor outcomes. Education scholar Mike McShane of EdChoice describes public school accountability this way: “Schools can underperform for decades and suffer functionally zero consequences.” He’s right. Here in Ohio, the state has experimented with a district-level intervention known as academic distress commissions (ADC). But after district officials repeatedly blasted the policy, legislators have abandoned it and given the three ADC districts an easy off-ramp. Meanwhile, federal legislation requires Ohio to oversee “school improvement” efforts at chronically-low-performing public schools. But once again, those interventions are wholly toothless. The feds don’t mandate any real changes in these schools—e.g., replacing ineffective staff or inferior curricula—nor does the state make serious demands either. Finally, in a common misconception, public schools don’t lose funding on the basis of poor academic performance. Instead, they are actually eligible to receive extra federal dollars as a direct result of their abysmal performance. Some consequence!

Or perhaps the critics are referring to the regulatory environment of private schools. Because of their different governing structure and distinctive educational models—often including religious instruction—private schools aren’t regulated in the same manner as public schools. Nor should they be: Such variances help preserve the very qualities that attract many families to private schools in the first place. Yet they are still subject to a raft of regulations. Consider the following examples:

  • Ohio private schools are formally chartered[1] by the state and must adhere to the operational standards that apply to school districts. Under those guidelines, private schools are required, for example, to create a strategic plan, regularly communicate with parents, and include instruction in the core academic subjects. The state may revoke a private school’s charter—thus prohibiting it from participating in voucher programs—for noncompliance with operational standards.

  • Private schools must offer the same number of minimum instructional hours as traditional school districts.

  • All private school students must meet high school graduation requirements that are generally comparable to public school students. Students attending private schools by virtue of a voucher are subject to the Third Grade Reading Guarantee.

  • Private schools must adhere to federal and state nondiscrimination policies with respect to both  admissions and hiring.  

  • Teachers working in private schools must obtain state licenses (a.k.a. “nontax certificates”) that include a bachelor’s degree requirement, and they are subject to background checks.

Given these requirements, it’s hard to imagine that rules and regulations are at the heart of the “unaccountable” claims. That leaves state testing and report cards. It’s true that Ohio doesn’t require private school students to take state assessments, nor does it issue report cards to their schools—both important forms of transparency and accountability for academic outcomes. That said, the state does require students in the EdChoice and Cleveland scholarships programs to take standardized assessments, whether a state exam or state-approved alternative test. Ohio also discloses their proficiency rates on those tests.

Now if I had my druthers, Ohio would require private schools to administer state exams to voucher students (as it has in the past), and it would issue report cards that reveal both their achievement and growth results. In my view that’s only fair, given that taxpayers are footing the bill for their education, and such information would be helpful to families weighing private school options. At the same time, it’s absurd to think that private school critics are making similar good-faith arguments about the merits of academic transparency. The official platform of the Ohio School Boards Association, for example, opposes user-friendly school ratings, and they and their allies have put forward proposals that would gut report cards. Meanwhile, Susie Kaeser has taken to the editorial pages to savage state testing and accountability policies based on those results. Public school advocates don’t seem shy about attacking accountability, so it would be disingenuous to criticize private schools on the basis of such policies.

In the end, the cries of “unaccountable” and “unregulated” private schools fall flat. There’s no basis in reality for claiming that private schools face no accountability or regulation. Indeed, there’s a good case that they are more accountable than traditional districts through the discipline of the educational marketplace. Much like their tired harangue about “siphoning” money, the critics should stop distorting the truth with their “unaccountable” arguments as well.


[1] This “charter” is different from the one received by a public charter school.

view
Anti charter blog image

Rebutting the union’s misleading comparisons of charter and district schools

Jessica Poiner
12.10.2021
Ohio Gadfly Daily

In early November, Scott DiMauro, the President of the Ohio Education Association, went on the attack against public charter schools. In a piece in the Ohio Capital Journal, he analyzed report card data and supposedly found some “seriously alarming” results for school choice programs. But as is the case with several other anti-choice pieces that have been published over the last few years, his analysis is misleading and inaccurate. Let’s take a look at two of the most egregious statements.

Statement One: “Charter advocates often complain about comparing all school districts’ performance with charters, but last year, 606 out of 612 public school districts in the state lost scarce resources to charter schools.”

Charter advocates “complain” about this comparison because it’s purposefully misleading. According to the Ohio Department of Education (ODE), 114,374 students were enrolled in one of Ohio’s 315 charter schools during the 2020–21 school year. But nearly 95 percent of students who attend brick-and-mortar charter schools live in the state’s fifty-five urban school districts. That’s why we at Fordham focus so heavily on comparisons between urban charter schools and urban district schools.

Of course, brick-and-mortar schools aren’t the only charters in Ohio. The state is also home to fifteen virtual charters known as e-schools, and they enroll over 34,000 students. Because e-schools offer classes online and aren’t tied to a physical location, they can and do serve students from all over the state. It’s e-schools that make it possible for charter critics to claim that over six hundred districts “lose” tax dollars to charters and justifies, at least in their minds, the comparison to statewide averages.

But making that claim without context is misleading because it overlooks the scale of the alleged impact. There’s a big difference between a few students transferring to charters and hundreds of students doing so. Charter critics know that. They know that the vast majority of charter students live in urban districts. They also know that, on average, the percentage of students in each district who attend online schools is very low. And yet they make the purposely misleading comparison anyway.

It’s also disingenuous to claim that districts have “lost scarce resources” to charters. In a student-centered funding system, no school—district, charter, private, or otherwise—is entitled to students and the per-pupil funding associated with them. And if districts aren’t entitled to funds, then it can’t be considered a “loss” when they don’t receive them. That would be akin to a childless person claiming that they “lost” funding when they weren’t awarded a child tax credit, or officials complaining they have “lost scarce resources” when a family moves to a neighboring district. Families have the right to choose where to send their children to school (despite what DiMauro and other choice critics believe), and schools should be allocated money based on students they actually teach, not students they could have taught. If a student opts to attend a charter school, the state money designated to educate that child should follow them to the school that’s doing the work of educating them. To do otherwise would be to prioritize systems—one specific system—over students. That’s exactly what DiMauro does when he focuses on the bogeyman of lost revenue rather than the question of what students and families need.

It’s also important to remember that schools are funded by state and local dollars. On average, 45 percent of elementary and secondary public school revenues are from local sources. For the most part, these dollars aren’t tied to student enrollment. When a child attends a charter or private school, districts still receive all the local dollars that families pay in taxes. That means that, on average, nearly half of district budgets are insulated from student enrollment losses. Charter and private schools can’t say the same. And all this doesn’t even account for federal funding, including hundreds of millions in Covid-relief dollars, or decades’ worth of growth in state school funding amounts. Overall, it’s hard to claim with a straight face that funding for school districts is “scarce.”

Statement Two: “Vouchers and charters take critical resources and weaken the public schools that serve the vast majority of Ohio’s children while delivering worse educational outcomes for our kids.”

We’ve already debunked the argument that school choice programs “take critical resources” from traditional public schools. And the assertion that public schools are “weaker” because of choice programs is an inaccurate read of the existing research. Various studies, from both Ohio and elsewhere, show that school choice programs don’t hurt district achievement or funding. That leaves the claim that vouchers and charters deliver worse educational outcomes for kids. Elsewhere in the piece, DiMauro calls them “poorer performing alternatives.” As evidence, he highlights post-pandemic drops in performance index scores at charter schools like KIPP in Columbus and the Breakthrough network in Cleveland.

There’s a lot to unpack here. For starters, the assertion that charters deliver worse educational outcomes for kids is mostly wrong. A rigorous analysis of Ohio data from 2015–16 through 2018–19 found that in grades 4–8, students in brick-and-mortar charters made significant gains on state math and ELA exams when compared to district students of similar backgrounds. Black students made particularly strong progress, as did both high and low achievers. In addition, students’ attendance rates increased and disciplinary incidents decreased when they attended a brick-and-mortar charter. That’s hardly “worse educational outcomes.”

Given that, how can DiMauro claim that choice programs are poorer performing alternatives? The answer is that he cherry-picked data from a Covid-disrupted school year to fit his narrative. First, he compared charter schools—which are largely located in Big Eight districts—to all districts in the state. As discussed earlier, this is a common tactic used by those who champion the establishment over the wishes of parents and children. It allows them to compare charter schools, where the majority of students are economically disadvantaged (nearly 80 percent) and children of color (64 percent), to districts where the majority of students are affluent and White. In the best of times, it’s a misleading comparison. But in the context of Covid-19 learning loss, it’s flat out irresponsible. It’s no secret that the pandemic hit low-income and minority families the hardest. If someone wanted to get an honest and accurate picture of charter school performance during this time, they wouldn’t compare the performance index scores of charters to all districts. Instead, they would compare charters and districts that teach similar student populations and therefore faced similar pandemic-related challenges.

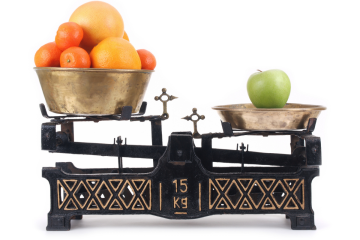
But DiMauro didn’t just compare apples to oranges and declare that apples were better. He also ignored years’ worth of evidence. He focused solely on results from the 2020–21 school year, which was dominated by a pandemic. And that’s the most infuriating part of all this—the stunning hypocrisy. Teachers unions have spent the entirety of the pandemic talking about how difficult our new reality has been for schools. They repeatedly mention how hard educators are working, the laundry list of difficulties faced by students and staff, and how unfair it is to judge schools on typical academic performance standards when the current climate is anything but typical.

And they’re right. Schools, educators, and students do deserve compassion and patience, and it will take time to make up for learning loss. But why is that compassion and patience only afforded to certain students and families? Have charter and private schools not struggled with the same health and safety concerns, the same student engagement and absenteeism woes, and the same remote learning issues? Are charter and private school educators not also teaching in the midst of a pandemic? Are the social and economic impacts of a once-in-a-generation event like this somehow less stressful for students who are enrolled in a school choice program?

Look, no one is saying that the huge drops in performance index scores or the rise in chronic absenteeism at Ohio’s charter schools aren’t worrisome. In fact, I’m pretty sure if DiMauro picked up the phone and called the folks who work at these schools or the families of the students enrolled there, they’d say they’re just as worried about student learning loss as he supposedly is. But the fact that he’s chosen to pointedly ignore years’ worth of research that contradicts him, zero in on a single and atypical year, and lambaste schools he doesn’t like while calling for compassion and patience for others is truly galling.

The bottom line? When union representatives say they’re advocating for “our kids,” they clearly don’t mean all Ohio children. If they did, they wouldn’t prioritize funding systems over funding kids. They wouldn’t cherry-pick performance data to make themselves look better—because they’d recognize that working alongside choice programs can lead to huge benefits for kids and communities. And they certainly wouldn’t see a global health crisis that caused millions of deaths, forced millions of others out of work, and compelled schools to close their doors for nearly a year as an opportunity to score political points.


view

Boosting the effectiveness of STEM role models

Jeff Murray
12.16.2021
Flypaper

Providing relatable role models for young people is a guiding principle by which STEM practitioners hope to motivate scientists of the future and diversify their ranks. Conscious of the importance of this endeavor, New York University researchers Jessica Gladstone and Andrei Cimpian examined the literature on role modeling to identify strategies for maximizing its motivational impact. Their meta-analysis suggests important nuances that should be taken into account when designing such programs.

Gladstone and Cimpian began by analyzing four theories of motivation—social cognitive theory, expectancy-value theory, mindset theory, and attribution theory—and find considerable overlap in the features of an effective role model. When specifically applied to STEM, these features include a role model’s perceived competence, their perceived similarity to the student, and the seeming attainability of their STEM career. Each of these could increase students’ motivation to pursue STEM, but the researchers hypothesize that different attributes impact different students in a variety of ways. (None of this is rocket science, so to speak.)

They then dug into the extensive role modeling literature looking for studies conducted in a STEM-relevant domain that also included STEM-specific outcome variables such as performance, interest, and sense of belonging in a scientific field. The researchers identified fifty-five studies published between 1976 and 2019 and analyzed each for evidence of the impacts of the role model attributes noted above. They also looked for the ways in which four specific student-level moderators (gender, race and ethnicity, age, and identification with STEM) interacted with role model effects.

Gladstone and Cimpian found evidence that suggests that the perceived competence of role models is highly motivating for students, particularly if the student and role model share characteristics such as gender or race, but there also seems to be a limit. Role models perceived as “exceptional” (think perfect ACT scores, medal winners, top of the class at Yale, etc.) were actually demotivating to all but a handful of students. The researchers caution that this evidence emerged from a small fraction of the studies they analyzed, but it stands to reason that being exposed to only “the best and the brightest” exemplars would be less impressive to young people who do not see themselves that way.

This conclusion led Gladstone and Cimpian to break down the perceived similarity characteristic between students and role models into demographic and psychological dimensions. When role models belonged to groups that are underrepresented in STEM (e.g., women and people of color), they often had positive effects for all students, regardless of demographic similarity. In contrast, majority-group models (e.g., men or White people) did not motivate students from underrepresented groups and were sometimes demotivating in a similar manner as was seen in the competence dimension.

Characteristics that increased the role model’s psychological similarity to students—such as stereotypical “non-nerdy” pursuits like playing music or sports—generally had positive effects on student motivation. Prompting students to reflect on their similarity to the role models was also sometimes effective in boosting connection and motivation. Finally, every instance in which exposure to a role model lowered STEM motivation was linked in some way to the perceived unattainability of the role model’s career. Efforts to “demystify” STEM careers and the pathways to reach them were generally positively related to student motivation.

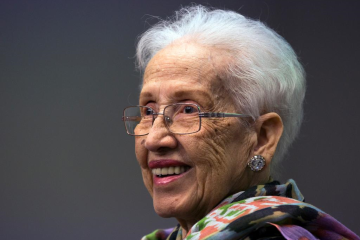
Overall, it appears that not all STEM role models are motivating to all students. In fact, a number of the role models that adults may think are super awesome can serve to turn off students who cannot see themselves resembling those individuals. Very few people in middle or high school will seriously picture themselves becoming the next Stephen Hawking, but Katherine Johnson’s life and work, unsung for far too long, shows us a more relatable option. And best of all, there are far more of the latter than the former available to showcase. Gladstone and Cimpian offer four solid recommendations for choosing and presenting role models in the most effective way. STEM practitioners need to think outside of the box if they want to move kids from seeing what they can be to being what they have seen.

SOURCE: Jessica R. Gladstone and Andrei Cimpian, “Which role models are effective for which students? A systematic review and four recommendations for maximizing the effectiveness of role models in STEM,” International Journal of STEM Education (December 2021).

view

Online courses and college degree completion

Jeff Murray
12.16.2021
Flypaper

Students’ inability to enroll in required courses—due to capacity or scheduling constraints—can stymie progress toward a college degree. New findings published in Educational Evaluation and Policy Analysis suggest that online courses can help keep students on track to college graduation.

The data come from a large, unnamed public research university in California. Researchers examined six years of data for three cohorts of incoming students—those who entered in the fall of 2009, 2010, and 2011—in thirteen of the largest majors. They look at how online course-taking impacted degree completion and the time it took to earn them. For each major, researchers collected information on all the course requirements and which courses could be taken online. On average, 3 percent of major-required courses (MRCs) were offered online during the study period, although there was much variability across majors. Eight percent of students in the study took at least one MRC online in their first four years of college. The vast majority of those online courses were taken in students’ first year, which proves important.

The topline findings are that a 1 percent increase in the number of MRCs offered online—simply offering the online option—was related to a 1.2 percent greater likelihood of students completing their degree within four years. In turn, a 1 percent increase in the proportion of MRCs actually taken online is related to a 14.4 percent greater chance of successfully graduating within four years. And a 1 percent increase in the proportion of first-year MRCs taken online was related to a 9 percent greater chance of successfully graduating within four years.

For students taking longer than four years to complete their degree, only first-year online MRCs had a significant impact on their time-to-degree. A 1 percent increase in the proportion of lower division MRCs offered online was associated with a decrease of 1.3 percent of a year (approximately 0.16 months) in time-to-degree, while a 1 percent increase in the proportion of lower division MRCs actually taken was associated with a 12 percent decrease in time-to-degree, corresponding to approximately 1.4 months.

While these results emerge despite the minimal offerings available—testing the methodology in a setting where more online options exist would likely prove enlightening—the researchers do urge caution in interpretation because there is no random assignment of students to online versus in-person versions of the courses. They are, in most cases, choosing of their own accord which version of a course they take and why. Additional caveats noted by the researchers are of a similar student-centric nature: possible effects on completion time from non-major courses taken online, students switching majors during the timeframe (especially if they do so to finish faster), double- and triple-major students whose graduation times can become extended, and savvy students petitioning for use of other courses to fulfill major requirements. It is also likely that students able to take major courses in their first year (rather than starting from scratch with general education credits) are those coming in with those base college credits via dual enrollment or AP and may represent more focused or motivated students than average.

Despite the fact that some research shows slight negative impacts of online course taking for near-term measures of student learning and performance in college—such as course completion, course grades, and success in subsequent courses—many students can and do utilize the flexibility afforded by online courses to efficiently reach the goal of completing a degree. Quality of online courses matters, but so does the ability to schedule and take needed courses. One hopes that the necessary burgeoning of online options in the Covid era will help with both. But far more analytical attention is being paid to the former while the latter goes unnoticed. This research shows that quantity of offerings matters, too.

SOURCE: Christian Fischer et. al., “Increasing Success in Higher Education: The Relationships of Online Course Taking With College Completion and Time-to-Degree,” Educational Evaluation and Policy Analysis (November 2021).

view

Ohio’s Lost Einsteins: The inequitable outcomes of early high achievers

9.28.2021
Report

Too often, high-achieving students get lost in the shuffle in debates about improving education for all. Yet to keep the U.S. and Ohio competitive on a global scale, we need to nurture a next generation of inventors, scientists, and business leaders. Recent debates about race and equity have shown the importance of ensuring that high-achieving children from all backgrounds have ample opportunity to reach the highest rungs of the social ladder.

To shed more light on high-achieving students, Fordham’s latest research report tracks the educational outcomes of Ohio children who scored in the top 20 percent on their third grade math or English language arts exams. Dr. Scott Imberman of Michigan State University conducted deep-dive analyses that follow early high achievers into college.

Key findings include:

  • Gifted identification: Just 34 percent of economically disadvantaged early high achievers and 30 percent of Black early high achievers were formally identified by their schools as gifted. Among other early high achievers, just over half were identified in that way.

  • ACT exams: Less than half of economically disadvantaged and Black early high achievers took the ACT—47 and 41 percent, respectively. This compares with 71 percent of non-disadvantaged high achievers who participated in the predominant college entrance exam used in Ohio. (During the period of this study, the ACT was voluntary for Ohio students.)

  • AP exams: Economically disadvantaged and Black early high achievers took an average of 0.3 and 0.2 AP exams, respectively, versus 0.7 exams for non-disadvantaged high achievers. Average AP exam scores were also lower for those student groups relative to their peers.

  • Four-year college enrollment: Just 35 percent of economically disadvantaged and 26 percent of Black early high achievers went on to enroll in four-year colleges. This compares with 58 percent of non-economically disadvantaged and 57 percent of White high achievers who enrolled in such institutions. 

In addition to documenting these disparities in outcomes among high achievers of different backgrounds, Dr. Imberman also examined the impact of being identified as gifted on early high achievers’ later state test scores. Based on rigorous statistical analyses, he finds that gifted identification modestly improves math achievement for Black early high achievers.

Download the report to dive into the analyses, and consider some ideas that could help ensure that all high-achievers reach their potential.

*****

Gifted identification finding graphic​

Gifted AP exams finding graphic

*****​

Fordham Logo

© 2026 The Thomas B. Fordham Institute
Privacy Policy
Usage Agreement

National

P.O. Box 110
Burke, VA 22009

202.223.5452

[email protected]

Ohio

P.O. Box 82291
Columbus, OH 43202

614.223.1580

[email protected]

Sponsorship

130 West Second Street, Suite 410
Dayton, Ohio 45402

937.227.3368

[email protected]