Mobile Navigation

  • National
    • Policy
      • High Expectations
      • Quality Choices
      • Personalized Pathways
    • Research
    • Commentary
      • Gadfly Newsletter
      • Flypaper Blog
    • Events
    • Scholars Program
  • Ohio
    • Policy
      • Priorities
      • Media & Testimony
    • Research
    • Commentary
      • Ohio Education Gadfly Biweekly
      • Ohio Gadfly Daily
  • Charter Authorizing
    • Application
    • Sponsored Schools
    • Resources
  • About
    • Mission
    • Board
    • Staff
    • Career
Home
Home
Advancing Educational Excellence

Main Navigation

  • National
  • Ohio
  • Charter Authorizing
  • About

National Menu

  • Topics
    • Accountability & Testing
    • Advanced Education
    • Career & Technical Education
    • Charter Schools
    • Curriculum & Instruction
    • ESSA
    • Evidence-Based Learning
    • Facilities
    • Governance
    • Personalized Learning
    • Private School Choice
    • School Finance
    • Standards
    • Teachers & School Leaders
    • Think Again
  • Research
  • Commentary
    • Gadfly Newsletter
    • Flypaper Blog
    • Gadfly Podcast
  • Events
  • Scholars Program

The Education Gadfly Weekly

Sign Up to Receive Fordham Updates

We'll send you quality research, commentary, analysis, and news on the education issues you care about.
Thank you for signing up!
Please check your email to confirm the subscription.

The Education Gadfly Weekly: Wrong, Betsy DeVos! Student outcomes have improved.

Volume 19, Number 24
6.12.2019
6.12.2019

The Education Gadfly Weekly: Wrong, Betsy DeVos! Student outcomes have improved.

Volume 19, Number 24
view

Betsy DeVos and other naysayers are wrong: Student outcomes in the U.S. have improved significantly in recent decades

This is the first in a series of summer posts that will examine whether America’s schools have, despite charges to the contrary, improved over the past quarter-century of reform. That is a big, daunting question—but there’s no doubt that student outcomes have improved during the education reform era.

Michael J. Petrilli 6.12.2019
NationalFlypaper

Betsy DeVos and other naysayers are wrong: Student outcomes in the U.S. have improved significantly in recent decades

Michael J. Petrilli
6.12.2019
Flypaper

Is dumbing-down why graduation rates are up? In both high school and college?

Chester E. Finn, Jr.
6.12.2019
Flypaper

The evidence indicates that charter schools enjoy an edge on teacher diversity nationwide

Brandon L. Wright | Adam Tyner, Ph.D. | Kara Long
6.12.2019
Flypaper

The effects of school discipline on families of color

Robert Pondiscio
6.12.2019
Flypaper

How different post-secondary pathways affect the ability of disadvantaged students to attain credentials with labor market value

Amber M. Northern, Ph.D.
6.12.2019
Flypaper

The Education Gadfly Show: Data-based decision-making is great, as long as data are not only test scores

6.12.2019
Podcast
view

Is dumbing-down why graduation rates are up? In both high school and college?

Chester E. Finn, Jr. 6.12.2019
Flypaper
view

The evidence indicates that charter schools enjoy an edge on teacher diversity nationwide

Brandon L. Wright, Adam Tyner, Ph.D., Kara Long 6.12.2019
Flypaper
view

The effects of school discipline on families of color

Robert Pondiscio 6.12.2019
Flypaper
view

How different post-secondary pathways affect the ability of disadvantaged students to attain credentials with labor market value

Amber M. Northern, Ph.D. 6.12.2019
Flypaper
view

The Education Gadfly Show: Data-based decision-making is great, as long as data are not only test scores

Michael J. Petrilli, Amber M. Northern, Ph.D., David Griffith, Ph.D., Josh Boots 6.12.2019
Podcast
view

Betsy DeVos and other naysayers are wrong: Student outcomes in the U.S. have improved significantly in recent decades

Michael J. Petrilli
6.12.2019
Flypaper

Back in April, speaking in front of the Education Writers Association, Secretary DeVos said that decades of reform efforts and increased social spending, both inside and outside of schools, “hasn't ultimately improved anything for any students, particularly not for the most vulnerable students.” It’s a standard refrain from DeVos, and many other reformers as well, when making the case that past efforts have failed and it’s time to try something different. Even my friend Rick Hess, after acknowledging big gains in math achievement, has argued that “a fair assessment” of the past two decades of reform “would admit that there has been a lot of action, but not much in the way of demonstrated improvement.”

In a series of posts over the course of the summer, I’m going to dig into these claims, all in pursuit of determining whether America’s schools have improved over the past quarter-century of reform. That’s a big, daunting question, because it requires looking not just at outcomes—test scores, graduation rates, college completion, and the like—but also at changing social conditions. As we will see, the untold story of the past several decades—at least until the Great Recession—is that poor kids in America are doing much better than before, and that has served as a welcome tailwind for efforts to improve America’s schools.

But I’m getting ahead of myself. A much more straightforward question is whether outcomes have improved. And here the answer is easy and encouraging: Yes, absolutely—until the Lost Decade of Academic Achievement.

This is how my colleague Nicholas Munyan-Penney and I put it two years ago, as we were preparing for the release of the 2017 NAEP scores:

  • There have been gains almost across the board since the 1990s. But progress is generally much larger in math than in reading; in fourth grade than in eighth grade; in eighth grade than in twelfth grade; for African American and Hispanic students than for whites; and for low performers than for high performers.
  • Most of the gains happened in the 1990s and early 2000s. The exception is reading, for which the 1990s were often flat, or even down. And progress in most categories has been very meager since the mid-2000s. Somewhere around 2007 or 2009, promising momentum petered out.
  • Progress in math has been especially remarkable. Black eighth graders gained twenty-three points from 1990 to 2015, Hispanic students gained twenty-four, and white students gained twenty-two. That’s roughly equivalent to two grade levels, and means that students are coming into high school much better prepared than they were two decades ago. That may help to explain at least some of the increase in America’s graduation rate, though it hasn’t yet translated into much progress in twelfth grade math achievement.
  • Children of color are reading much better in the early grades than before. Hispanic and black fourth graders students respectively gained twenty and twenty-one points from 1994 to 2015, while their white peers gained eight. As with the other trends, the most progress came in the late 1990s and early 2000s. Maybe it was because of improved reading instruction in the phonics/Reading First era, or maybe it reflected improved socioeconomic conditions for children of color in the 1990s. Either way, the gains for eighth graders were only half as large, and they all but evaporated by twelfth grade. In fact, there were marked declines for twelfth graders in the 10th percentile, perhaps because more low achievers were staying in school rather than dropping out.

That last point is critical, because it points to the clearest disappointment: twelfth grade scores in reading and math that are flat as a pancake. And it’s achievement at the high school level that DeVos and others use when making the case that our schools haven’t improved a lick.

To be sure, it’s extremely frustrating that twelfth grade achievement hasn’t improved, and could be an indictment of our high schools, which have been mostly impervious to reform pretty much forever. But there could be other explanations. It could be that the rapidly rising graduation rate (the black “four-year adjusted cohort graduation rates” is up 11 percentage points since 2010; for Hispanic students it’s 9 points) means that there are more low-performing students taking NAEP, students who in the past would have already left school. Or maybe there’s another socioeconomic explanation.

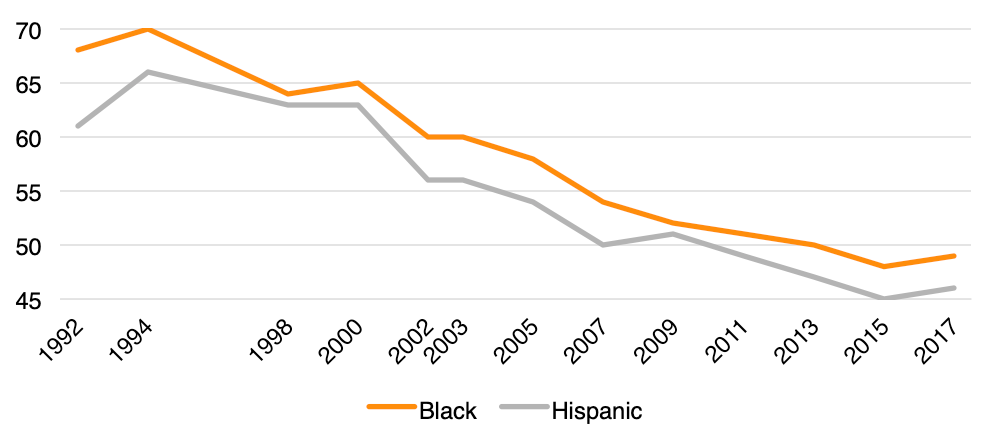
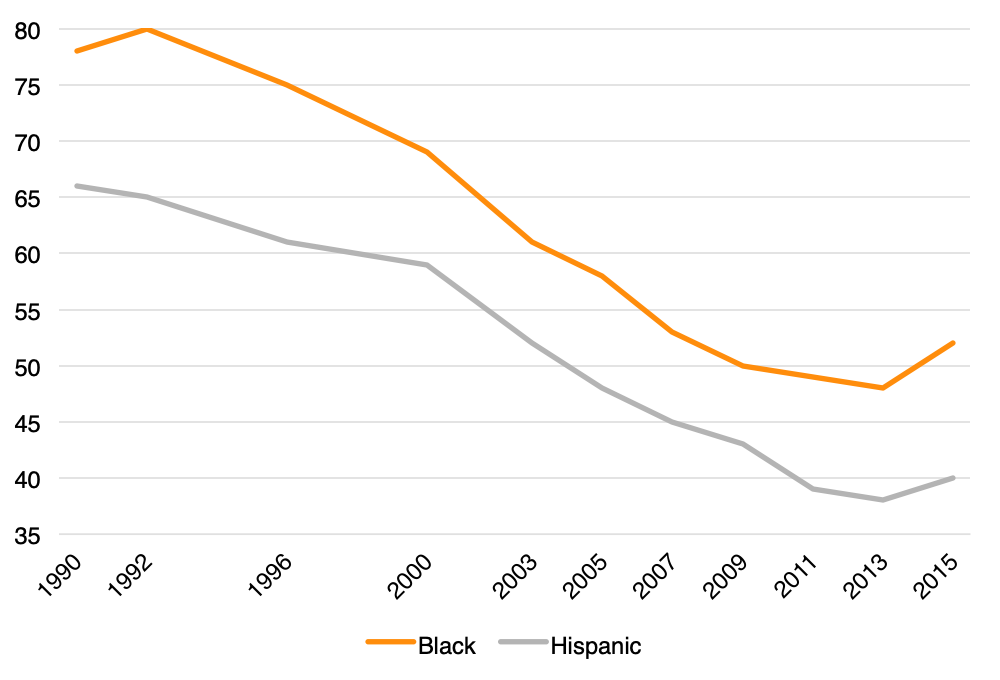
It definitely doesn’t mean our elementary and middle schools aren’t getting better outcomes, though, especially for their lowest performing students. Consider these trends, for example:

Figure 1. Percentage of fourth graders reading below basic on NAEP

mp1

Figure 2. Percentage of eighth graders scoring below basic in math on NAEP

mp2

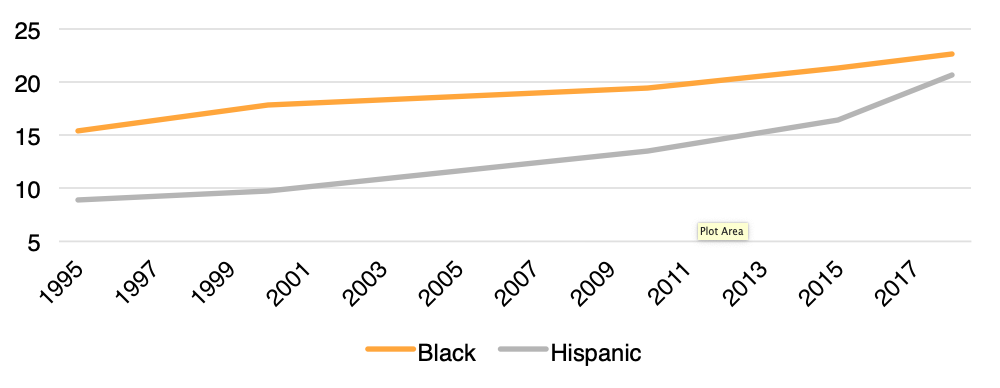
Finally, it’s extremely encouraging (and not well known!) that the four-year college completion rate (for all Americans between the ages of twenty-five and twenty-nine, not just those who graduated high school or even went to college) rose from 24.7 percent in 1995 to 37 percent in 2018. That’s a whopping 50 percent increase. And while racial completion gaps remain large, there’s been huge progress for African Americans and especially Hispanics, increasing their completion rates 47 percent and a remarkable 133 percent respectively over the past quarter century. (Though as my colleague Checker Finn points out, lower graduation standards may be part of the story here too.)

Figure 3. Percentage of 25–29 year olds with a four year degree or higher

mp 3

A “fair assessment” of the past twenty-five years, and especially the years before the Great Recession, is that something improved outcomes for students, particularly “the most vulnerable students.” To learn whether it was schools or something else, please follow along this summer. My hope is that the answers will help us figure out how to return to the pre-Great Recession trends of big progress once again.

view

Is dumbing-down why graduation rates are up? In both high school and college?

Chester E. Finn, Jr.
6.12.2019
Flypaper

Start with two unlovable but immutable realities:

First, there’s really no constituency for higher standards and greater rigor in education. Valuable though those things are in the long run for both individuals and society, they’re painful in the short run. Everyone appears to benefit—and certainly to welcome—higher grades, more diplomas, more college going, more college degrees, and all the other accoutrements of “accomplishment,” whether it’s grounded in true achievement or is the result of grade inflation, easing off, smoke, and mirrors. It’s not just kids and families who see benefit. It’s also teachers who would far rather give A’s, philanthropists seeking payoff from their investments, advocacy organizations that can declare success, and elected officials who bask in the rewards conferred on them by grateful voters.

Second, whenever high stakes get attached to any metric, finagling of that metric follows. Whether simple inflation, corner cutting, or outright cheating, you can be certain that people will seek to harvest the rewards that follow from upticks in that metric and avoid the penalties that might befall them if it stays flat or ticks downward. That’s hardly a new insight. Indeed, it was elegantly and disturbingly formulated in 1976 by the eminent social psychologist Donald Campbell, and is simply known as “Campbell’s law”: “The more any quantitative social indicator is used for social decision-making, the more subject it will be to corruption pressures and the more apt it will be to distort and corrupt the social processes it is intended to monitor.”

(I should add that I remain fully committed to results-based accountability in education, just warier than I once was of placing huge weight on any one metric.)

With that backdrop, consider two new reports on graduation rates, one associated with high school, the other with college. The former, in my view, is so gung-ho about getting graduation rates up to 90 percent that it understates the risk that many of today’s diplomas may be pretty squishy, if not semi-fraudulent. The latter, to its authors’ credit, tiptoes into the perilous recognition that enrollment-and-revenue-hungry colleges may be making it easier to graduate.

High school first. The “Everyone Graduates Center” at Johns Hopkins is at least as much about advocacy as about research. For sixteen years, it has focused on boosting high school graduation rates and its annual Building a Grad Nation reports are boosterish, perhaps to a fault. The 2019 version, just issued, uses as primary indicators which states and groups of students have reached the 90 percent graduation rate and how rapidly are they progressing toward that target. The main message is that the country “continues to see steady, but slowing, growth in graduation rates” and quite a lot more needs to be done.

There’s much good stuff in these pages, and many sound recommendations. But there’s also cause for concern that the boosterism has caused the authors to don rosy lenses. They praise Nevada, for example, for effecting a “dramatic spike” in graduation rates by, in effect, making it much easier to graduate: For the two years of the state’s new end-of-course exams, kids only needed to take them, not to pass them, and even when they’re fully implemented, they’ll only count 20 percent toward the diploma. What’s more, those who previous failed the then-statewide proficiency exam—all the way back to 1980—will now get their diplomas retroactively!

Kudos to the authors for taking on the important question of whether recent upticks in graduation rates may be due to slipping standards and diminished rigor—and their recommendations include strong support for deeper dives into worrisome practices like “credit recovery”—but the tool they created for gauging possible slippage—called the Secondary School State Improvement Index—practically guaranteed the conclusion that “the bulk of evidence supports a picture of improvements in both graduation rates and measures of secondary school achievement.”

The index has four elements, two of which are a state’s NAEP (reading and math) results in eighth grade, which purports to show how many kids are entering high school with a reasonable level of academic preparedness. Fair enough, but what does it say about how much they learn while in high school? Nada. NAEP deserves blame here, too, for it does not systematically report any of its twelfth grade results at the state level.

The third element is how many of a state’s high school graduates scored 3 or better on at least one Advanced Placement test. This one has merit—and numbers are definitely up—but it’s compromised by the fact that AP access varies widely by state, as well as within states, indeed within districts. In 2017, Maryland high schools took AP exams at the rate of 943 per thousand eleventh and twelfth graders, for example, while their counterparts in North Dakota took 222. Also of concern is that AP is oriented to high achievers while eased graduation standards are apt to have the greatest impact on low achievers.

The fourth element in this index is the state’s own “adjusted cohort graduation rate,” which is part of states’ ESSA accountability systems; it tracks the fraction of first time ninth graders to graduate within four years. Important to know, of course, but it’s circular to use it as a gauge of academic quality when the point of the gauge is to determine whether the graduation rate has been inflated by dumbing down the diploma itself!

In short, three of the four elements seem entirely inappropriate for this purpose, and the last one—AP qualifying scores—would be a lot better if we could be sure that all high school students in a state have access to that possibility and that rising performance levels on AP had something to do with the graduation standards affecting the kids who might otherwise drop out.

The report is still worth your while. Much of its data is valuable, its conclusions often insightful, and most of its recommendations solid. But be aware that we’re a long way indeed from confidence that rising graduation rates are not in considerable part a result of slackening standards and dubious practices. Be aware, too, that the harder our accountability systems (à la ESSA) and our advocacy organizations (such as “Everyone Graduates”) press on graduation rates, the greater will be the temptation to finagle, fudge, and use elastic yardsticks. Much as NCLB once told states to set their own proficiency levels, ESSA has them set their own graduation standards—and then mostly let districts determine who meets those standards, even as there’s intense scrutiny of the resulting graduation rates. None of this should inspire confidence in “improved” graduation rates.

The college report that came out in recent days emerged not from a booster group but from sober analysts at Brigham Young University. They asked “Why Have College Completion Rates Increased?” (since the 1990s). They found that “student characteristics, institutional resources, and institution attended explain little of the change”—so they set out to see what might. Their fundamental conclusion, albeit hesitantly presented and generously qualified: “standards for degree receipt have changed.” And their explanation: “It is hard to know for sure, but the recent policy focus on college completion rates seems a likely candidate. As schools face increased scrutiny and, in some cases, increased funding incentives, they may be responding by increasing graduation rates. The lowest cost way to increase graduation rates is through changing standards of degree receipt” (my emphasis).

They note, too, that “In either a human capital or signaling model of education, declining standards of degree receipt would predict a declining college wage premium. Our work may explain some of the decline in the college wage premium that has been observed.”

Maybe those who have been touting college degrees as the gold standard of educational success ought to spend a little more time investigating just what those degrees consist of. And maybe policy types and philanthropists should pay a little more attention to actual learning while in college and a little less to the paper credentials that come at the end.

In sum: We can’t rule out “dumbing down” as one explanation for rising high school graduation rates, and there’s now provocative evidence that it’s also contributing to rising college graduation rates.

Yes, there’s still something to be said for diplomas and degrees. They do “signal” something about motivation, persistence, and self-control—and in a society that looks down at those “who never graduated from high school” and that admires “college graduates,” it’s good when more people make it over those hurdles. External validation has some value. But it will have less and less value—and do those with the credentials ever less good, as the hurdles en route to them are lowered and as it becomes known that some folks are just strolling around them.

Repeat after me: There’s no constituency for greater rigor in education. And then repeat after me (and Don Campbell) that the more emphasis we put on a manipulable metric, the higher the odds that it will rise in part as a result of finagling, hedging, cheapening, faking, and legerdemain.

Correction: June 13

The ever-vigilant John Bridgeland, one of several authors of Building a Grad Nation (and overall great guy), pointed out to me that I paid too little heed to the final paragraph of the Nevada sidebar on page twenty-five and therefore erroneously characterized the authors’ view of recent changes in the Silver State. Although I continue to read the first seven paragraphs of that nine-paragraph box as a virtual how-to-do-it guide for states that want to boost graduation rates by lowering standards, it is true that the ultimate paragraph raises concerns and urges those monitoring Nevada’s new requirements “to ensure students receiving a diploma are also receiving a quality education.” I stand corrected.

Bridge (as he is known to all) has other quarrels with my description of Building a Grad Nation (and the center that produced it), but I find none of those persuasive.


view

The evidence indicates that charter schools enjoy an edge on teacher diversity nationwide

Brandon L. Wright | Adam Tyner, Ph.D. | Kara Long
6.12.2019
Flypaper

Last week, we at Fordham released a new study called Student-Teacher Race Match in Charter and Traditional Public Schools. Authored by Seth Gershenson, Associate Professor at American University, it finds that black students in charter schools in North Carolina are about 50 percent more likely to have a same-race teacher than their black counterparts in traditional public schools, that the impact of having a same-race teacher is twice as large in charter schools as in traditional public schools, and that within charter schools, the effect of having a same-race teacher is about twice as large for nonwhite students as for white students. 

In light of these findings, some have criticized Fordham with inappropriately generalizing the results from the Tar Heel State to charter and traditional public schools across the country. The study itself was careful not to do so. Yet the national data we have indicate that the charter advantage in teacher diversity holds far beyond North Carolina.

Dr. Gershenson chose to use North Carolina for a reason. His work here is but the most recent entry in a growing body of literature exploring student-teacher race match, a significant portion of which examines data from the state. As the study notes, this is partly because of data availability, but also because:

North Carolina is a large and diverse state, whether one looks at its socioeconomic composition, its demographics, or its topography. While its student body is slightly poorer and more racially diverse than the United States as a whole, the state’s public school system generally resembles those of many other large states. Moreover, results of education studies in North Carolina tend to align with those using nationally representative data, suggesting that results are often generalizable outside of the Tar Heel State.

To be sure, the report acknowledges that North Carolina is different in some ways from the country at large, and that its “checkered racial history and atypical charter population” warrants caution in applying the study’s findings beyond the state’s borders. So we can’t say, and didn’t say, that all of the results are generalizable to America’s charter schools writ large.

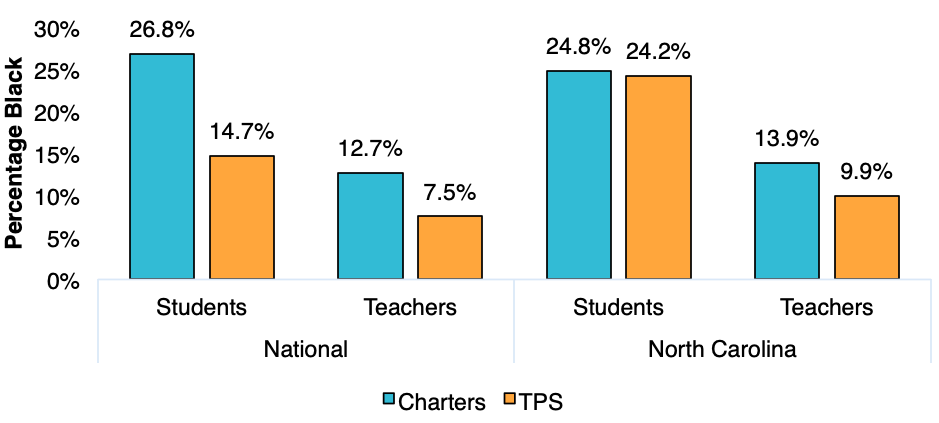
We do, however, think the report findings are worth the consideration of a national audience because they are indicative of broader patterns. For example, one of the key findings of the report is that charter schools employ a more diverse teacher workforce than traditional public schools. Using national data from the 2016–17 National Center for Education Statistics National Teacher and Principal Survey we find that, although the racial composition of students attending North Carolina’s charter schools is different than the national picture, teacher diversity in charters is greater than in traditional public schools in both cases (see Figure 1).

Figure 1. Percentage of black students and black teachers in charter and traditional public schools nationally and in North Carolina

figure 1

Sources: 2016–2017 National Teacher and Principal Survey, U.S. Department of Education; Seth Gershenson, Student-Teacher Race Match in Charter and Traditional Public, Thomas B. Fordham Institute (June 2019).

In North Carolina, 24.8 percent of charter students are black, versus a slightly smaller 24.2 percent in traditional public schools. Nationally, the gap is larger, at 26.8 percent and 14.7, respectively. And the pattern for teacher diversity is similar: 13.9 percent of Tar Heel State charter teachers are black, compared to just 9.9 percent of their district peers. Nationwide, these percentages are 12.7 and 7.5 percent, respectively.

Still, it might not be fair to compare charter schools to all traditional public schools because, nationally, charters are more highly concentrated in urban areas and are known to serve more minority students.

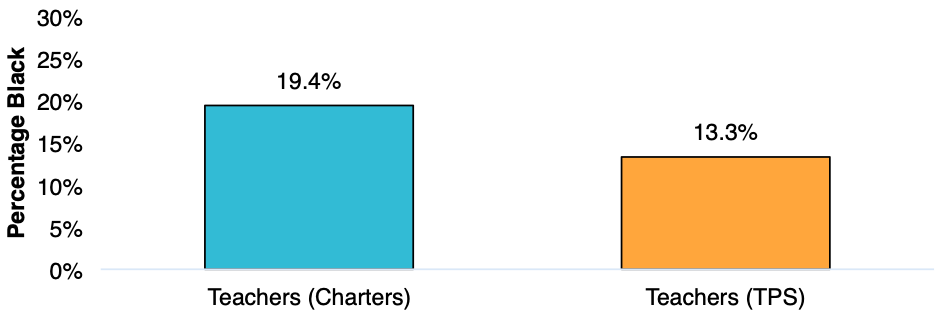
Yet when we restrict the sample of schools nationwide to those that serve mostly children of color, we find that charters still employ a more diverse teacher workforce, even though the difference narrows considerably. According to data from the same national survey, 19.4 percent of such charter schools’ full-time teachers are black, versus 13.3 percent in traditional public schools. This 46 percent difference is comparable to what we found for North Carolina. And the trend is similar for Hispanic teachers: 17.8 percent and 13.7 percent for charters and traditional public schools, respectively (see Figure 2).

Figure 2. National percentage of black teachers in schools with minority student enrollment of 50 percent or higher

figure 2

Source: 2016–2017 National Teacher and Principal Survey, U.S. Department of Education.

No matter how you slice it, the teacher workforce is more diverse in charters than traditional public schools—both in North Carolina and across America. Because charter schools also serve a larger proportion of minority students, this means their students of color are probably more likely to be taught by a same-race teacher, though we can't analyze this directly using the national data that are available.

Yes, our latest report only uses data from North Carolina. But many studies examining differences between charters and traditional public schools have used data from one locale because restrictions in data availability make national and even regional analysis extremely difficult to conduct.

Moreover, our findings aren’t the final word on any of these issues; no research ever is. Yet the results are suggestive. Researchers should use the findings as a springboard for further analysis and see if our findings do actually hold true in other states. Educational leaders of all kinds should seek ways to improve teacher diversity. And traditional public school administrators should learn from and emulate some of the ways charter schools hire more teachers of color. It’s the children who will benefit.

view

The effects of school discipline on families of color

Robert Pondiscio
6.12.2019
Flypaper

A trio of researchers, Joanne W. Golann and Anna Lisa Weiss of Vanderbilt University’s Peabody College; and Mira Debs of Yale, set out to explore “what discipline means to Black and Latinx families” at two commonly available school choice options: a so-called “no excuses” charter school, and a pair of public Montessori magnet schools. This is a rich vein of ore to mine. Few areas of education and ed policy are more filled with confident assertions of “what parents want” based on mere assumption than school discipline. Soliciting parents’ views in depth is a fine start.

Golann and her co-authors define discipline as “a multifaceted system of structures to support a variety of student outcomes, including social and emotional skills and academic achievement.” In their more expansive definition, they identify three distinct components: behavioral discipline, self-discipline, and academic discipline. Behavioral discipline “refers to efforts to train students to follow rules and defer to authority”; self-discipline is about impulse control in the absence of rules and consequences; academic discipline refers to school environments that support student achievement. One of the authors studied a single “no excuses” school, which they dub “Dream Academy,” a high-performing middle school serving about 250 students in a “medium-sized, deindustrialized Northeastern city” with limited school choice options. A second author conducted her fieldwork in a pair of public Montessori magnet elementary schools in a similar city, identified only as the “Birch” and “Vine” schools. Not surprisingly, parents at both types of schools valued all three types of discipline, crediting each with a strong sense of order, and which parents praised “as a welcome change from the relative lack of safety and order many of their children had experienced in neighborhood schools.” However they also note “a majority of parents at Dream Academy felt that the school overstepped its disciplinary role.”

This hints at the paper’s unique strength: its examination of how urban black and Hispanic parents perceive school choice options after enrollment—a potentially clearer lens on parental preference and a more useful guide to evaluating choice options going forward. “Despite the pedagogical differences of the Montessori and no-excuses schools, and their differences of student age and socioeconomic and racial composition, across schools, the Black and Latinx parents we interviewed wanted the same thing. They appreciated how behavioral systems of rules resulted in a safe and quiet learning environment for their children; they also wanted rules and consequences that were logical and not punitive,” the authors note. “The parents in the Montessori setting were satisfied, but the no-excuses parents felt uncomfortable when the school seemed overly focused on behavior management.” More sharply drawn differences in parental perception emerge on the more nuanced issues of self-discipline and academic discipline. A perceived absence of opportunities for self-advocacy, for example “led Dream Academy parents to be apprehensive that their children would grow up to become what some Black parents called ‘robots’ or ‘little mindless minion[s], just going by what somebody says.’” On the other hand, the Montessori parents “needed reassurance that their children would be prepared for middle school and on track for college. In contrast to the pervasiveness of college culture at Dream Academy, there was, by intention, little mention of college or even middle school preparedness at Birch or Vine,” they note. “The lack of explicit school discourse around academic success in the school created additional uncertainty for some Black and Latinx parents.”

Some cautionary notes are needed. The salience and transferability of the paper’s takeaways may be affected by the relative lack of choice in the “Dream Academy” city: Did those parents choose a school that is less aligned with their views on discipline but merely better (and safer) than other alternatives? The authors dwell on the differences in pedagogy and school culture at the schools in their competing models, but less on the structural conditions that drive their respective enrollment. Dream Academy is an “oversubscribed” charter school whose students are two-thirds black, one-third Hispanic, with 84 percent eligible for free or reduced-price school lunch. The two Montessori schools are district magnet schools whose students are one-third black, one-fifth Hispanic, 30 percent white, and 10 percent Asian. The authors themselves note the high percentage of “middle-class and stable, two-parent working class Black and Latinx parents” in their sample as a limiting factor.

A less obvious limitation may be extrapolating conclusions about “no excuses” schools at large from a single, possibly non-representative school. It is unclear whether “Dream Academy” is part of a large CMO or a stand-alone “mom and pop.” Moreover, the fieldwork—a mere twenty-five parent interviews at a single school—was conducted in 2012–13. After a KIPP Foundation study just one year earlier revealed only one-third of that network’s first cohorts had graduated college in six years, the leaders of the nearly every urban charter network made significant shifts in their discipline practices and school cultures, aimed chiefly at ensuring precisely the kind of agency and academic discipline the authors describe. Thus a similar ethnographic study today might yield different parental views at today’s “no excuses” charters—assuming you could find one. Because “no excuses” has become (erroneously) conflated with careless zero-tolerance discipline practices, you’d be hard-pressed to find a high-achieving urban charter school that hasn’t rejected altogether the no excuses label, even if many of the animating ideas and practices—structured lessons, intensive intervention, college-bound culture, etc.—remain the same.

“Countering the idea that discipline should be a system of rules and punishments alone, parents we interviewed at all schools saw the importance of discipline to accomplish a variety of outcomes: to create order and safety in the school and to foster self-discipline and academic rigor,” the authors conclude, and amen. There is (or ought to be) no tension between “rules and punishments” in the service of behavior management, self-discipline, or academic rigor. It’s precisely the point.

SOURCE: Joanne W. Golann, Mira Debs, and Anna Lisa Weiss, “To Be Strict on Your Own”: Black and Latinx Parents Evaluate Discipline in Urban Choice Schools,” American Educational Research Journal (March 2019).

view

How different post-secondary pathways affect the ability of disadvantaged students to attain credentials with labor market value

Amber M. Northern, Ph.D.
6.12.2019
Flypaper

Education policy is rife with references to developing suitable “career pathways” that presumably start in high school and extend through college. A new working paper by Harry Holzer and Zeya Xu examines the impacts of the pathways chosen by community college students, meaning the credentials and fields of study they elect to pursue upon enrolling. Specifically, they examine whether students’ choices over time have positive returns for them, including earnings and the likelihood of obtaining said degree or credential.

They use student-level data for the entire cohort of students who began community college in Kentucky in the academic year 2010–11 and follow them for six years, through spring of 2016. They have data on students’ chosen field of study, courses, credits earned, grades, whether they took developmental courses (a.k.a. remedial), and their desired and attained credentials, including certificates, diplomas, associate degrees or bachelor’s degrees. They can also track them if they transferred elsewhere in the state. They have data, too, on their high school courses, grades, and test scores, so that they can determine if a student was “college ready”—a definition mostly based on eleventh grade ACT scores. Finally, although they don’t have individual earnings, they have overall data for students between the ages of twenty-five and thirty-four in 2017, who would have been approximately the age of younger students beginning community college in 2010.

They use a variety of analytic methods, including student fixed effects models and “exploratory” regression discontinuity models. Although each model has its drawbacks, together they attempt to control for a variety of factors that may be driving student selection in the pathways.

On the descriptive front, they find that only one-fourth of students were deemed college-ready according to their high school measures. The most popular pathway was health care, chosen by one-fourth of students. Nearly one-third of females chose an associate degree in the field, while less than one-tenth of males did the same. Interestingly, the students categorized as not college-ready profess similar choices as the college-ready group (and incidentally complete certificates at about the same rate, though they complete degrees at much lower rates). The overall completion rate over six years in a Kentucky community college is just under 30 percent, and only 22 percent for associate or bachelor’s degrees. According to the report, “Of those receiving certificates, about a fourth go on to attain associate’s degrees as well, while a third of those receiving associate’s degrees go on to attain bachelor’s degrees.” The highest completion rate is for the bachelor’s of arts degree, but it comprises few students; the next is the health pathway, 37 percent. Applied STEM also generates certificates and diplomas at moderately high rates. And regarding attrition, nearly 60 percent of students enrolled in the first year return the second year.

As for the impact analysis, students in health care and other certificate/diploma pathways are 77 and 69 percent more likely, respectively, to attain a credential than those who fail to choose a pathway. Moreover, students in liberal arts are no more likely than students with undeclared pathways to attain any credential in a six-year period. And health care and applied STEM are consistently associated with greater likelihood of credential attainment and higher earnings than other pathways. They also found that students change programs frequently, which hinders outcomes since it limits their ability to accumulate credits within pathways. Early momentum generated by enrolling in and attaining credits in the first year can have positive impacts on credential completion rates.

That lattermost finding is the basis for one of the analysts’ key recommendations. That’s reforming developmental education, since when kids fail these prerequisite classes, they are less likely to hang in there. They raise the possibility of making developmental courses “co-requisites,” meaning students take them concurrently with the college-level class. Other studies have found lackluster results when “co-requisite” developmental courses replaced the pre-requisite kind, and it’s not hard to see why: How can a student unprepared for college work be expected to pass the college work she’s unprepared for at the same time she’s being remediated for her lack of preparation?

SOURCE: Harry Holzer and Zeyu Xu, “Community College Pathways for Disadvantaged Students,” CALDER (Mary 2019).

view

The Education Gadfly Show: Data-based decision-making is great, as long as data are not only test scores

6.12.2019
Podcast
 

On this week’s podcast, Josh Boots, Founder and Executive Director of EmpowerK12, joins Mike Petrilli and David Griffith to discuss how high-performing schools use all sorts of data—and not just test scores—to improve their instruction and outcomes. On the Research Minute, Amber Northern examines recent increases in college completion rates.

Amber's Research Minute

Jeffrey T. Denning, Eric R. Eide, and Merrill Warnick, “Why Have College Completion
Rates Increased?
” Annenberg Center at Brown University, EdWorkingPapers (June 2019).

Fordham Logo

© 2026 The Thomas B. Fordham Institute
Privacy Policy
Usage Agreement

National

P.O. Box 110
Burke, VA 22009

202.223.5452

[email protected]

Ohio

P.O. Box 82291
Columbus, OH 43202

614.223.1580

[email protected]

Sponsorship

130 West Second Street, Suite 410
Dayton, Ohio 45402

937.227.3368

[email protected]