Mobile Navigation

  • National
    • Policy
      • High Expectations
      • Quality Choices
      • Personalized Pathways
    • Research
    • Commentary
      • Gadfly Newsletter
      • Flypaper Blog
    • Events
    • Scholars Program
  • Ohio
    • Policy
      • Priorities
      • Media & Testimony
    • Research
    • Commentary
      • Ohio Education Gadfly Biweekly
      • Ohio Gadfly Daily
  • Charter Authorizing
    • Application
    • Sponsored Schools
    • Resources
  • About
    • Mission
    • Board
    • Staff
    • Career
Home
Home
Advancing Educational Excellence

Main Navigation

  • National
  • Ohio
  • Charter Authorizing
  • About

National Menu

  • Topics
    • Accountability & Testing
    • Advanced Education
    • Career & Technical Education
    • Charter Schools
    • Curriculum & Instruction
    • ESSA
    • Evidence-Based Learning
    • Facilities
    • Governance
    • Personalized Learning
    • Private School Choice
    • School Finance
    • Standards
    • Teachers & School Leaders
    • Think Again
  • Research
  • Commentary
    • Gadfly Newsletter
    • Flypaper Blog
    • Gadfly Podcast
  • Events
  • Scholars Program

The Education Gadfly Weekly

Sign Up to Receive Fordham Updates

We'll send you quality research, commentary, analysis, and news on the education issues you care about.
Thank you for signing up!
Please check your email to confirm the subscription.

The Education Gadfly Weekly: Training teachers to fail

Volume 20, Number 6
2.12.2020
2.12.2020

The Education Gadfly Weekly: Training teachers to fail

Volume 20, Number 6
view
Quality Choices

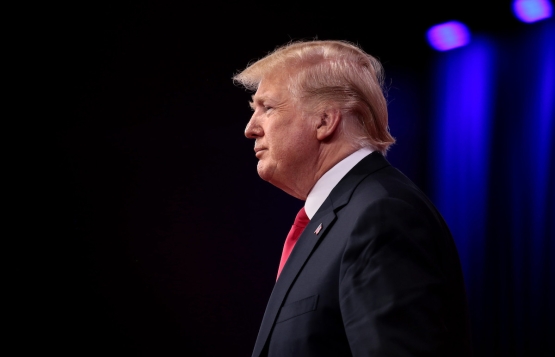
Has Trump turned against charter schools?

The Trump administration’s proposed budget takes the Education Department’s $440 million program of financial assistance for charters and melds it with twenty-eight other programs into a big new K–12 block grant. Although there’s scant political likelihood that Congress will adopt the plan, the proposal itself will be interpreted and welcomed by charter foes as a sign that even Trump and his allies and supporters have lost their enthusiasm for these independent public schools of choice.

Chester E. Finn, Jr. 2.12.2020
NationalFlypaper

Has Trump turned against charter schools?

Chester E. Finn, Jr.
2.12.2020
Flypaper

Training teachers to fail

Jasmine Lane | Jon Gustafson
2.12.2020
Flypaper

AP versus the excellence gap

Chester E. Finn, Jr.
2.12.2020
Flypaper

The harm of special education enrollment caps

Amber M. Northern, Ph.D.
2.12.2020
Flypaper

Associate degrees and certificates are more valuable than you may think

Jessica Poiner
2.12.2020
Flypaper

The Education Gadfly Show: Why teachers with higher grading standards get better student outcomes

2.12.2020
Podcast
view

Training teachers to fail

Jasmine Lane, Jon Gustafson 2.12.2020
Flypaper
view

AP versus the excellence gap

Chester E. Finn, Jr. 2.12.2020
Flypaper
view

The harm of special education enrollment caps

Amber M. Northern, Ph.D. 2.12.2020
Flypaper
view

Associate degrees and certificates are more valuable than you may think

Jessica Poiner 2.12.2020
Flypaper
view

The Education Gadfly Show: Why teachers with higher grading standards get better student outcomes

Michael J. Petrilli, David Griffith, Ph.D., Seth Gershenson, Ph.D., Amber M. Northern, Ph.D. 2.12.2020
Podcast
view

Has Trump turned against charter schools?

Chester E. Finn, Jr.
2.12.2020
Flypaper

It’s a hard week—harder even than usual—to be Education Secretary Betsy DeVos, or her chief policy advisor, assistant secretary Jim Blew. Both are longtime, outspoken, and sophisticated supporters of charter schools. Indeed, DeVos’s (and, implicitly, Donald Trump’s) support for charters has loomed large in the attacks on her that have been coming from prominent Democrats in Congress and on the presidential campaign trail, and in the fracturing of the bipartisan coalition that has enabled the charter sector to grow dramatically over the past two decades.

So it’s got to be deeply awkward for DeVos and her team to see her Department’s $440 million program of financial assistance to that sector melded (along with twenty-eight other categorical programs) into the big new K–12 block grant that figures prominently in the administration’s FY 2021 budget proposal. Although there’s scant political likelihood that Congress will adopt this plan, DeVos and Blew understand perfectly well that the proposal itself will be interpreted (and welcomed) by charter foes as a sign that even the Trump-ettes have lost their enthusiasm for these independent public schools of choice. One can easily picture Elizabeth Warren or Bernie Sanders, for example, phoning Randi Weingarten to strategize about how best to capitalize on this rug being pulled out from under charters by the administration. And the House Democrats who were already on the warpath over charter school aid will have juicy new talking points in the Senate-House appropriations conference.

Viewed from 30,000 feet, this is a Lilliputian issue alongside the Brobdingnagian changes in federal spending priorities that would be wrought by the new Trump budget, and in truth the Education Department wasn’t whacked nearly as hard as many other agencies. But the changes that would ensue in the structure of federal funding for K–12 education would be momentous indeed. As the Department put it, “The budget calls for consolidating nearly all existing K–12 formula and competitive grant programs into one block grant to States, called the Elementary and Secondary Education for the Disadvantaged (ESED) Block Grant. Funds would be allocated using the same formulas as the Title I Grants to Local Educational Agencies program.” While IDEA funding (for the schooling of children with disabilities) remains separate, just about everything else in the K–12 space, including the giant Title I program, would either be folded into the block grant or eliminated altogether. For aficionados and beneficiaries of the twenty-nine categorical programs thus folded, and at a funding level less than the sum of their parts, it’s a painful blow indeed.

In principle, let it be noted, block grants are not a bad thing. Faithful to the Tenth Amendment and, in the education space, to the spirit of ESSA, they empower states and districts to spend federal dollars as they think best. Block grants unclutter the budgetary and bureaucratic attic that’s jammed with little categorical programs, some of which—I admit—have outlived their public value and live on mainly because of interest groups that have come to depend on them.

Yet when something is or should be a national priority, entrusting states and districts to faithfully advance it is pure folly, and the aforementioned interest groups, more than a few of them both worthy and needy, cannot assume that their district or state will give them the time of day. Maryland, for example, where I live, famously has the weakest charter school law in the land, and it’s unimaginable that the union-dominated majority in the state legislature would ever apportion—or allow the executive branch to spend—federal block grant dollars to grow the charter sector. That Maryland has federal charter dollars today is because the categorical nature of the program enabled charter-friendly executives and state board members to submit the requisite application without legislative approval.

Should the proposed block grant ever come to pass, one assumes—surely hopes—that extant charters would continue, even in Maryland, to get the Title I funding that presently comes to many of them. But it’s possible that charter-averse districts would try to starve them even of that. And it’s all but unthinkable that such districts would allocate a dime from their share of the block grant to cover the start-up costs of new charters, which is the principal function of the existing federal program.

As it happens, the administration’s proposed block grant also contains several small competitive grant programs that I value, including the little Javits Gifted and Talented Program (the sole source of federal help for that pupil population) and a wee program of assistance to history and civics education. Considering their value to the nation, plus that of the growing and fast-improving charter sector, I end up torn. I don’t think Uncle Sam should micromanage American education. On the other hand, when it comes to the relatively small portion of K–12 spending derived from Washington, I don’t see any justification for just putting it on a stump and letting states and districts spend it as they see fit. Federal spending programs should advance national priorities, and—in my view—one of those should be more and better charter schools, precisely because they create quality alternatives for needy kids otherwise swindled out of a decent education by the schools run by their districts and states. To turn charter dollars over to districts and states in most places is akin to placing foxes in charge of hens.

No, this block grant isn’t going to be enacted by Congress in the form that the administration has proposed. But the long-term political damage to the charter movement may prove substantial—as DeVos and Blew surely understand. I have to assume they lost a fight with the Office of Management and Budget over this—and I think it’s a damn shame.

NB: Also shameful is the budget’s proposed increase in what can only be termed Education Department “overhead” funding, even as the programs run by the agency are slashed and consolidated, which logically should shrink the “central office,” too. Kudos, though, for a modest but much needed funding boost for the National Assessment of Educational Progress.

view

Training teachers to fail

Jasmine Lane | Jon Gustafson
2.12.2020
Flypaper

There’s been a lot of talk recently about the reading crisis in U.S. schools. Careful reporting has pinpointed a common problem: Many newly-trained and veteran teachers are not aware of the latest research on early reading instruction or comprehension. In 2016, NCTQ reviewed the syllabi of 820 teacher preparation programs across the country and found that only 39 percent of programs were teaching the basics of effective reading instruction. Four years later that number of programs has risen to 51 percent. While this signals a positive trend in adopting evidence-informed reading instruction, the fact remains that 49 percent of incoming teachers do not have the tools to effectively teach reading.

After examining our experiences at two well-known teacher training programs in Minnesota and looking at what we were—and were not—taught about the basics of literacy, we have come to the same conclusion: We were not prepared for the responsibility of the job. This failure to prepare teachers, we believe, should be a red flag for the current system in place for how we train and place teachers into classrooms.

Student interest and choice prioritized over high-quality instruction

As we went through our respective teacher training programs, we noticed a common theme to our coursework. At every turn, it seemed that student interest was front and center. The idealized teacher should be passive, give minimal guidance, and certainly not talk for more than five minutes. Teachers should not be instructing so much as they should be prioritizing and facilitating student choice. Phrases like this were perpetuated as best practice:

If I come to observe you, you shouldn’t be at the front of the room…The worst thing a teacher can do when students ask questions is answer them…Students only want to write about what they’re interested in.

Reading instruction was assumed to happen largely through osmosis and the now-dominant “workshop” model. The majority of early reading instruction revolved around “read-alouds” with picture books. There was minimal to non-existent training in effective whole-group instruction or the “Big 5” components of reading—phonemic awareness, phonics, fluency, vocabulary, and comprehension—although a consensus in research supports the effectiveness of utilizing these insights in reading instruction.

Most alarmingly, when students display lagging decoding skills, our teacher training encouraged us to utilize shortcuts to “increase engagement” like leveled reading, technology, audiobooks, and graphic novels. Clearly these strategies are not working: Minnesota has the widest gap in reading scores between white and nonwhite students in the nation—32 percent of black fourth-graders and 34 percent of Hispanic fourth-graders are proficient in reading, compared to 66 percent of white fourth-graders. Ironically, we also have some of the strictest teacher licensing requirements in the nation.

Rather than grappling with the gravity of the literacy crisis, motivation and interest seem to be top priorities and are seen as the solution to students who are unable to decode. Little attention was given to the fact that a deep and robust background knowledge (gained through social studies, science, and the arts) is a vital part of reading comprehension.

In terms of teaching writing, writers notebooks and other “multi-modal” forms of communication were emphasized instead of focusing on complex, expository writing.

The result of a teacher training dominated by student-interest and minimally-guided instruction was that, oddly enough, we were not trained in how to actually teach. Our training felt more like a philosophy of teaching degree than ensuring students could learn the tangible skills required for success in high school and beyond. As a result, as with many new teachers, the majority of our first experiences with teaching were filled with hours of searching for curricula or making plans from scratch, rather than focusing on whether or not students were actually learning—or worse, feeling unable to assign work for fear of not having time to grade it. Clearly, this is not a sustainable model and ultimately harms student learning and teachers’ morale.

Simplifying teaching to improve learning

Teacher training is stuck in a model that includes extensive and expensive coursework, followed by varying lengths of student-teaching that ultimately don’t prepare us for a sustainable workload. As Deans for Impact notes, there is very little time or focus given to purposeful practice in authentic teaching environments. Most teachers are simply put in a sink-or-swim position in their first classroom, while the message from veteran teachers is to “just survive” the first few years until you have built your curriculum.

Thankfully, though we did not receive much purposeful practice in our teacher training, we were fortunate to participate in programs like Breakthrough Collaborative and Minnesota Reading Corps prior to teacher training. These programs helped us understand how instrumental a sustained classroom experience with a set curriculum is to developing and rapidly improving the craft of teaching instead of the craft of curriculum development.

Additionally, rather than spending an inordinate amount of time in teacher training learning how to create and write lesson plans from scratch, our training should focus on improving instruction and lesson delivery using high-quality curricula as a foundation. Teachers should not be expected to create, teach, and revise curricula on their own, yet our training makes it seem as though this is sustainable.

Finally, teacher training programs should embrace the latest, most comprehensive cognitive science research available on literacy and learning for pre-K, elementary, and beyond. Empowering educators with these reliable insights on how we learn best should be a first priority if we are to take our profession seriously.

—

In the U.S., there is a system that continues to place the least experienced teachers in classrooms needing the best instruction. It does not help that many newly-trained teachers too often lack the fundamental training in literacy needed to even have a chance at being effective teachers. Continued and persistent educational inequity will not be addressed until we bring the science of learning into our preparation programs and give new teachers the research-informed training they and their students deserve.

view

AP versus the excellence gap

Chester E. Finn, Jr.
2.12.2020
Flypaper

That K–12 education in the U.S. has long been plagued by “excellence gaps” is no secret, although the terminology may be just a decade old (and owes much to Jonathan Plucker and his colleagues). These gaps gauge—and those gauging them invariably deplore—the uneven, unequal rates at which students from different demographic groups make it into the ranks of high achievers on various measures of achievement. Sadly, despite exceptions that prove the rule, we’re pretty much always referring here to gaps between poor, African American, and Hispanic youngsters on one side, and non-poor, white, and Asian kids on the other. We see this pattern whether we’re looking at NAEP results, PISA results, state assessment results—or Advanced Placement participation rates and scores.

Andrew Scanlan and I dug deep into the AP part in our new book, Learning in the Fast Lane: The Past, Present, and Future of Advanced Placement (published by Princeton University Press in 2019). We reported considerable, worthy progress on several fronts, but also called attention to worrying gaps that remain.

The Jack Kent Cooke Foundation—which helped make the book possible and is focused on the excellence gap, especially the income-linked versions, and which spends much treasure to help narrow it—asked us to spin out of the book a short, separate report on precisely this topic: The Role of Advanced Placement in Bridging Excellence Gaps.

In the report, as in the book, we delve into the degree to which students from underserved populations both participate in AP courses and succeed by earning scores of 3 or higher on the exams’ five-point scale (the level usually required to receive college credit). Specifically, we looked at differences associated with geography, race/ethnicity, and socioeconomics, and discussed ways in which the program treats these gaps.

Geography is often overlooked as a source of education gaps. Yet when it comes to AP participation, where students live is strongly correlated. Those residing in states with the lowest participation rates were about three times less likely to take AP exams than their counterparts in the top states. Rural high school seniors are only two-thirds as likely to take an AP exam as their suburban and urban peers, and more than half of high-poverty rural schools do not even offer any AP classes. In the graduating class of 2019, fewer than 10 percent of students in Louisiana and Mississippi had achieved qualifying scores (3 or higher), compared with more than 30 percent in Maryland, California, Florida, Connecticut, and Massachusetts.

These problems are at least partially amenable to policy solutions. In Texas, for example, following several ambitious initiatives to boost AP participation, half of 2013’s graduates had taken at least one AP class while in high school, more than double the rate (23 percent) just a decade earlier. By 2019, more than 22 percent of Texas graduates were also earning qualifying scores. Yet AP offerings still remain skimpy (or absent) in a nontrivial portion of the Lone Star State’s many small rural schools.

Echoing much other research sponsored by the JKC Foundation, socioeconomic status plays a large role in creating and perpetuating all sorts of excellence gaps. But it’s not inexorable, either. For its first couple of decades, the AP program mostly served a small number of top students in elite private and public high schools. Beginning in the late 1970s, however, a second major AP mission emerged: helping capable disadvantaged students master college-level coursework during high school. The book recounts the saga of Jaime Escalante, dubbed “the best teacher in America,” demonstrating via his inner-city Los Angeles classroom that poor, immigrant Hispanic youngsters could succeed in AP calculus.

Using fee reductions given by the College Board as a proxy for exam-taking by low-income students, recent years have witnessed a dramatic increase in such students participating in AP.  In the public high school graduating class of 2018, 31 percent of those taking AP exams qualified for fee reductions, up from 11 percent in 2003. Still, at a time when about half of U.S. high school students are considered low-income, sizable gaps remain. Furthermore, students from low-income families do less well on AP exams than their better-resourced peers. Although nearly half of low-income graduates who take an AP exam during high school score 3 or higher, almost two-thirds of exam takers from better-resourced families earn such scores. Success also varies widely by state. In Mississippi, for example, where students receiving lunch subsidies represent 71 percent of K–12 enrollments, just 21 percent of those scoring 3 or higher on AP exams had received fee waivers.

We also probed the role that race and ethnicity play in differential AP participation and attainment. Diversity is definitely on the upswing: Participation by black and Hispanic students grew faster than that of white and Asian students over the past two decades. Indeed, the representation of Hispanic students among AP exam takers (23 percent) is now nearly equal to their share of public high school enrollments (24 percent). Yet black students remain two times less likely to take an AP exam than white or Hispanic students (and seven times less likely than Asian students). And, as with low-income students, young people of color do not fare as well on the exams: Only 30 percent of exams taken by black students and 42 percent of exams taken by Hispanic students received scores of 3 or better in 2017, compared to 64 percent of exams taken by white students and 70 percent for Asian students.

We applaud the notable gains in AP participation by low-income and minority youth over the past twenty years and salute the College Board and innumerable philanthropies, helper groups, and policy shifts that have contributed to these gains. (Special kudos to the National Math and Science Initiative, MassInsight, and Equal Opportunity Schools, both for the superb work they’ve done in this realm and for their assistance with our research.) Yet “traditionally underserved” populations remain underrepresented and often do not perform as well on AP tests as their better-resourced peers. Geographic gaps also remain wide, especially in rural areas.

Why the disparities? Many forces are involved, from weak prior academic preparation among talented students to inadequate institutional support during high school. The College Board can—and does—counteract some of this, but has little leverage over what happens before and outside high school. Hence responsibility for closing the remaining gaps cannot rest on the College Board alone. Given the AP program’s prominence—and power—in helping prepare students for college, gain admission to four-year institutions, and succeed upon arrival there, expanding access to its offerings remains an important national endeavor. Participating in AP courses offers acceleration and enrichment for strong high school students, instills serious study skills, and exposes them to the kinds of analysis, research, and deeper understanding that are standard practice in good college classrooms. It also provides students with an avenue to earn college credit in advance, waive introductory courses, and often accelerate their progress toward degrees (thereby also saving money). States, school districts, philanthropies, and education reform groups should continue to find ways to ensure that students from all backgrounds have access not only to AP coursework, but also to the requisite supports and preparation necessary to succeed on the exams. Not doing so would wall off an important path to upward mobility, sustain inequalities, and constrain opportunities.

view

The harm of special education enrollment caps

Amber M. Northern, Ph.D.
2.12.2020
Flypaper

A couple years ago, a high-profile dispute played out between the Texas Education Agency (TEA) and the federal Department of Education, with a January 2019 New York Times headline pronouncing, “Texas Illegally Excluded Thousands From Special Education, Federal Officials Say.”

Readers may recall that Texas implemented a policy that required school districts to reduce special education caseloads. This study, conducted by economists at the University of California-Davis and Cornell, exploits variation in special education placement driven by this policy to estimate short- and longer-term effects of reducing access to these services.

In 2005 the TEA implemented a district-level special-education enrollment target of 8.5 percent—apparently in response to an unexpected budget cut—which led to an immediate drop in such enrollment. Besides the pressure to reduce enrollment, there were no other real changes introduced. Sure enough, over the next ten years, special education enrollment dropped from 13.0 to 8.5 percent. By 2018, about 225,000 fewer students were enrolled in special education programs annually across the state.

The study utilizes a couple empirical models, but mainly a difference-in-differences strategy that compares changes in special education removal, educational attainment, and labor market outcomes across cohorts before and after the policy, and with differing amounts of treatment intensity. The idea is that districts with higher pre-policy special education rates faced stronger pressure to reduce rates, and that cohorts were treated differentially based on how long they were exposed to the policy.

The main sample consists of fifth-grade special education cohorts (since special education identification typically levels off by fifth grade), enrolled between 1990–00 and 2004–05—which was the last cohort diagnosed before the special education target was enforced. Ninety-one percent of students with special needs who are diagnosed by fifth grade have malleable disabilities, such as speech impairment, learning disability, and attention deficit hyperactivity disorder (ADHD)—not physical or severe cognitive disabilities (non-malleable)—so analysts look at those two groups separately.

The key finding is that for the overall sample, students with special needs enrolled in the average district experienced a 3.5 percent point (12 percent) increase in the likelihood of special-education removal, a 1.9 percentage point (2.6 percent) decrease in the likelihood of high school completion, and a 1.2 percentage point (3.7 percent) decrease in the likelihood of college enrollment after the policy’s introduction. Specifically, for students with malleable disabilities on the margins of placement into services, removal from special education decreases high school completion and college enrollment by 52 and 37 percentage points, respectively. These are large effects, but the analysts contend that because the students now had to take the exit exam—and take it without modifications—it was harder to meet graduation requirements. And in fact, students were indeed much less likely to pass the exit exam. There were no statistically significant differences for students with non-malleable disabilities.

Finally, lower income and minority students experienced larger decreases, and the negative impacts tended to be concentrated among these students, in part because districts were under pressure to limit enrollment for minority students if their rate of identification exceeded the proportion of minority students in the district.

All of that said, they did not find that removal from special education leads to significant declines in long-term outcomes, including college degree attainment or earnings in the labor market measured six years after graduation.

Bottom line: Imposing an enrollment cap for special education is not the way to address spiraling costs. Still, we desperately need smart solutions about how to serve students with special needs better and more efficiently. We at Fordham have long bemoaned that our special education system is antiquated. Moreover, there’s little incentive to improve it for ill-served students, and districts are at a loss with how to fund it properly. Texas’s shake-up missed the mark, but another might yield improvements. Let’s not give up on trying.

SOURCE: Briana Ballis and Katelyn Heath, “The Long-Run Impacts of Special Education,” Retrieved from Annenburg Institute at Brown University (November 2019).

view

Associate degrees and certificates are more valuable than you may think

Jessica Poiner
2.12.2020
Flypaper

As its name suggests, the middle-skills pathway sits between a high school diploma and a bachelor’s degree. There are a wide variety of credentials associated with this pathway, but certificate and associate degrees are the most popular. In general, associate degrees include a mix of general education courses and career preparation, while certificates are almost exclusively career oriented.

Due to a lack of consistent data sources, information on middle-skills pathway credentials is scarce. A recent report from the Georgetown University Center on Education and the Workforce seeks to remedy this by examining certificates and associate degrees using data from the Adult Training and Education Survey, the American Community Survey, and the Integrated Postsecondary Education Data System. The report examines three aspects in particular: the prevalence of certificates and associate degrees, the demographic characteristics of the students who enroll in and complete these programs, and the associated labor market outcomes. 

The number of certificates and associate degrees awarded by postsecondary institutions is roughly equivalent to the number of bachelor’s degrees awarded. There are approximately two million conferred each year, with certificates and associate degrees each accounting for about one million. The vast majority of these credentials are earned by students attending public two-year colleges.

Students who enroll in and complete certificate and associate degree programs are far more diverse than those who enroll in bachelor’s degree programs. Among undergraduate students, 56 percent of black students and 62 percent of Latino students are enrolled in certificate and associate degree programs compared to 47 percent of white students. Nationally, both black and Latino students earn a higher percentage of certificates and associate degrees than their respective shares of the population. When it comes to socioeconomic status, low-income students are more likely to enroll in certificate programs at two-year public or for-profit colleges and are less likely to earn a postsecondary credential.

While it is generally true that higher education attainment levels lead to higher pay and lifetime earnings, the report shows that the program of study a student chooses matters immensely. In some cases, workers with a certificate or associate degree can earn more than those with a bachelor’s degree. For example, workers who earned an associate degree in engineering have median annual earnings in the $50,000 to $60,000 range, while those with a bachelor’s degree in education earn between $30,000 and $40,000. For workers with middle-skill credentials, the jobs with the best outcomes are those in STEM and managerial or professional vocations. Getting a job related to the chosen field of study also matters; workers who report having a job related to their certificate program have higher median earnings than those who don’t.

The authors were also able to analyze administrative data obtained from ten states with the capacity to link student records to wage records and produce earnings outcomes—Colorado, Connecticut, Indiana, Kentucky, Minnesota, Ohio, Oregon, Texas, Virginia, and Washington. Among the states that provided data, associate degree programs in the health profession ranked in the top five fields of study with the highest earnings. Engineering was also a valuable field: Associate degree programs in engineering technologies were within the top earning fields in every state, and certificates in engineering technology placed in the top five of earnings in eight of ten states. The authors also found additional evidence that, in some states, a certificate or associate degree holder in the right field can make as much as a worker with a bachelor’s degree. In Ohio, for instance, workers with a certificate in industrial technology reach $65,000 in median earnings, which is considerably more than the $45,700 median for workers with bachelor degrees.

The report ends with calls for greater transparency around the labor-market value of middle-skill credentials. The authors note that students need better assurances that their investments of time and money are worth it, and that policymakers and educators should focus on strengthening all pathways to and through college. They also offer several policy recommendations, including expanding federal postsecondary data collection efforts and strengthening accountability for career-oriented programs.

SOURCE: Anthony P. Carnevale, Tanya I. Garcia, Neil Ridley, Michael C. Quinn, “The Overlooked Value of Certificates and Associate’s Degrees: What Students Need to Know Before They Go to College,” Georgetown University Center on Education and the Workforce (January 2020).

view

The Education Gadfly Show: Why teachers with higher grading standards get better student outcomes

2.12.2020
Podcast

On this week’s podcast, Seth Gershenson, associate professor at American University, joins Mike Petrilli and David Griffith to discuss the Fordham study he authored this month, Great Expectations: The Impact of Rigorous Grading Practices on Student Achievement. On the Research Minute, Amber Northern examines how gender affects the ability of college students to receive favorable grade changes.

Amber's Research Minute

Cher Hsuehhsiang Li and Basit Zafar, “Ask and You Shall Receive? Gender Differences in Regrades in College,” NBER Working Paper #26703 (January 2020).

The Education Gadfly Show is available on Google Play Music, Libsyn, Spotify, iHeartRadio, Apple Podcasts, TuneIn, The Podcast App, PodBean, Podbay, Chartable, Castbox, and myTuner Radio.

Fordham Logo

© 2026 The Thomas B. Fordham Institute
Privacy Policy
Usage Agreement

National

P.O. Box 110
Burke, VA 22009

202.223.5452

[email protected]

Ohio

P.O. Box 82291
Columbus, OH 43202

614.223.1580

[email protected]

Sponsorship

130 West Second Street, Suite 410
Dayton, Ohio 45402

937.227.3368

[email protected]