Mobile Navigation

  • National
    • Policy
      • High Expectations
      • Quality Choices
      • Personalized Pathways
    • Research
    • Commentary
      • Gadfly Newsletter
      • Flypaper Blog
    • Events
    • Scholars Program
  • Ohio
    • Policy
      • Priorities
      • Media & Testimony
    • Research
    • Commentary
      • Ohio Education Gadfly Biweekly
      • Ohio Gadfly Daily
  • Charter Authorizing
    • Application
    • Sponsored Schools
    • Resources
  • About
    • Mission
    • Board
    • Staff
    • Career
Home
Home
Advancing Educational Excellence

Main Navigation

  • National
  • Ohio
  • Charter Authorizing
  • About

National Menu

  • Topics
    • Accountability & Testing
    • Advanced Education
    • Career & Technical Education
    • Charter Schools
    • Curriculum & Instruction
    • ESSA
    • Evidence-Based Learning
    • Facilities
    • Governance
    • Personalized Learning
    • Private School Choice
    • School Finance
    • Standards
    • Teachers & School Leaders
    • Think Again
  • Research
  • Commentary
    • Gadfly Newsletter
    • Flypaper Blog
    • Gadfly Podcast
  • Events
  • Scholars Program

The Education Gadfly Weekly

Sign Up to Receive Fordham Updates

We'll send you quality research, commentary, analysis, and news on the education issues you care about.
Thank you for signing up!
Please check your email to confirm the subscription.

The Education Gadfly Weekly: A rising economic tide + reform + resources = better results for kids

Volume 19, Number 28
7.17.2019
7.17.2019

The Education Gadfly Weekly: A rising economic tide + reform + resources = better results for kids

Volume 19, Number 28
view

A rising economic tide + reform + resources = better results for kids

Much of the academic progress of the NCLB era may have stemmed from dramatically declining child poverty rates. But other things were also happening that deserve credit, like ed reform and more education resources. So it's likely that these three things were a winning combination. The good news is that we’re living in the midst of an economic boom today, and states are opening their wallets again. If policymakers stick with the reform part of this trifecta, it may work as well now as it did twenty years ago.

Michael J. Petrilli 7.17.2019
NationalFlypaper

A rising economic tide + reform + resources = better results for kids

Michael J. Petrilli
7.17.2019
Flypaper

The federal Charter Schools Program: A short, opinionated history, part I

Chester E. Finn, Jr.
7.17.2019
Flypaper

Tell high school students the truth about college readiness

Aaron Churchill
7.17.2019
Flypaper

Scaling up proven charter school models

Amber M. Northern, Ph.D.
7.17.2019
Flypaper

The implementation and impacts of reforms in Louisiana

Jessie McBirney
7.17.2019
Flypaper

The Education Gadfly Show: One small step for man, one giant leap for our schools?

7.17.2019
Podcast
view

The federal Charter Schools Program: A short, opinionated history, part I

Chester E. Finn, Jr. 7.17.2019
Flypaper
view

Tell high school students the truth about college readiness

Aaron Churchill 7.17.2019
Flypaper
view

Scaling up proven charter school models

Amber M. Northern, Ph.D. 7.17.2019
Flypaper
view

The implementation and impacts of reforms in Louisiana

Jessie McBirney 7.17.2019
Flypaper
view

The Education Gadfly Show: One small step for man, one giant leap for our schools?

Michael J. Petrilli, David Griffith, Ph.D., Chester E. Finn, Jr., Amber M. Northern, Ph.D. 7.17.2019
Podcast
view

A rising economic tide + reform + resources = better results for kids

Michael J. Petrilli
7.17.2019
Flypaper

Editor’s note: This is the fifth in a series of posts examining whether the nation’s schools have improved over the past quarter-century or so. The first two posts demonstrated that student outcomes rose significantly for the lowest-performing students and children of color from the mid-1990s until the Great Recession—especially in reading and math, but in other academic subjects, too. The third post argued that this educational progress coincided with dramatically improving conditions for our poorest families. In particular, the “supplemental poverty rate” plummeted for children of color in the 1990s and into the 2000s. The fourth post looked at the potential relationship between the poverty and achievement trends.

Last week I argued that much of the progress of the NCLB era may have stemmed from the dramatically declining child poverty rates of the 1990s.

But much does not mean all.

Other things were happening back then, too, things that deserve at least some of the credit—namely more education reform and more education resources. Let’s look at the evidence for both.

—

Though No Child Left Behind gets all the attention, 1994’s Improving America’s Schools Act put most of the key pieces in place for the “consequential accountability” policies that we now associate with NCLB. It required states to set uniform standards in reading and math; to develop statewide tests to assess students against those standards; and to report the results for all schools. While annual testing, disaggregated data, and a federally-mandated “cascade of sanctions” came later, they came as enhancements, as an evolution. The real revolution began with IASA.

By the mid to late 1990s, some states had the building blocks in place and were starting to put schools on so-called “failing schools” lists. Others jurisdictions, however, didn’t get serious about the standards, testing, and accountability tripod until NCLB burst onto the scene in 2002. This time lag provided researchers with an opportunity to study a natural experiment. Namely, they could compare the early-adopter states to the laggards, and check to see if the former saw greater progress in student achievement than the latter.

It was Eric Hanushek and Macke Raymond who first conducted such an analysis, and their answer was yes: States that embraced accountability in the 1990s made more progress than those that didn’t. Later, Tom Dee and Brian Jacob checked to see what happened once the laggards finally starting doing testing and accountability, too, and found that they also got a bump from accountability—and it bumped them to a new, higher plateau.

We accountability hawks tend to hang our hats on these findings when we argue that standards, tests, and school ratings can raise achievement. But it’s important that we acknowledge some important limitations.

First, both studies found impacts on math but not on reading. This is not unusual in education research. Math achievement appears to be much more amenable to school interventions, perhaps because reading is more connected to family background (e.g., being read to, or not, and the vocabulary you hear in the home), or perhaps because our schools haven’t gotten any better at teaching it.

Second, the size of the accountability impacts, though fairly large, wasn’t nearly enough to explain the huge gains made by the lowest-performing students in the late 1990s and early 2000s.

Third, the progress petered out. Some, like Sandy Kress, believe that’s because we essentially gave up on consequential accountability in the late 2000s, as NCLB grew long in the tooth and Arne Duncan issued waivers that let failing schools slip the law’s chokehold. Others contend that this type of education reform can only carry you so far; in time it plateaus. But then, of course, there was also the Great Recession. (More on that below.)

Fourth, and perhaps most importantly, even if accountability did raise achievement (in math, especially for low-performing students), we don’t really know why. The optimistic story is that the new standards and assessments helped clarify what schools were expected to teach, and they aligned their curricula and pedagogy to these new expectations in ways that helped students learn more. Perhaps schools and districts also responded to NCLB’s subgroup data by doing politically difficult but necessary things to improve outcomes, like assigning the best teachers to the kids who needed the most help or driving additional dollars to schools serving lots of children of color.

The pessimistic—you might say cynical—story is that schools and districts just played games to make their test scores go up. They re-assigned their best teachers to the tested grades. They engaged in endless test-prep. They encouraged low-performing kids to stay home on test day. They reallocated time from social studies and science to reading and math (which is true, though the changes were modest).

It’s probably a mix of all these things, with some schools responding in ways that policymakers hoped while others finagled and cheated in various ways. But something real did happen, for achievement went up, and not just on the state tests that were used for accountability purposes, but also on the no-stakes National Assessment of Educational Progress.

So let’s give accountability some credit—some, but not all.

Did we invest our way to better achievement?

While the policy crowd was busy designing and implementing an array of standards-based reforms, a mostly separate group of advocates was winning school-finance lawsuits from coast to coast, wins that yielded a big increase in spending in the 1990s and especially into the 2000s. (No Child Left Behind actually led to some increased spending, too.)

In today’s dollars, average per-pupil spending went from $9,731 in 1990 to $10,837 in 2000, and all the way to $13,082 by 2010. That means spending went up by 11 percent in the 1990s and an astounding 21 percent in the 2000s.

Several studies show that the increased spending did indeed raise achievement. A recent review of the school finance literature by Kirabo Jackson—some of which focused on the time of this spending surge—led Jackson to conclude that “the question of whether money matters is essentially settled.”

Once again, however, there are limitations to consider, many of which parallel the ones related to accountability. The progress mostly came in math but not reading. The impacts were small, and eventually hit a plateau (possibly because spending itself hit a wall called the Great Recession). And we don’t know much about what schools spent their extra money on that explained their improved results, though higher teacher salaries—which were not the norm in that period—may have helped if and when they were adopted.

—

As I’ve written before, I’d love for some bona fide card-carrying methodologists to dig into the question of how to explain the achievement gains of the late 1990s and 2000s, and the disappointing results since the onset of the Great Recession. How much of the credit or fault goes to changing socioeconomic conditions (especially child poverty), and how much may be connected to reform (especially standards based reform) and spending? Are there other factors that deserve attention, too (the growth in charter schools, the decline in lead poisoning, etc.)? Is the answer different for math versus reading?

Until that time, it appears to me that a rising economic tide, plus reform, plus resources is a winning combination. The good news is that we’re living in the midst of an economic boom today, and states are opening their wallets again. If policymakers stick with the reform part of this new trifecta, it may work as well now as it did twenty years ago.


view

The federal Charter Schools Program: A short, opinionated history, part I

Chester E. Finn, Jr.
7.17.2019
Flypaper

This essay is part of the The Moonshot for Kids project, a joint initiative of the Fordham Institute and the Center for American Progress. It will run in three parts, with the second and third appearing in future issues of the Education Gadfly Weekly.

With four billion dollars of funding over twenty-five years, the federal Charter Schools Program (CSP) has turned out to be one of the larger and (in my view) more successful examples of government-supported R & D in the K–12 realm, with heavy emphasis on the “D,” but in ways that have also fostered considerable innovation. It has, in the words of veteran education analyst Christy Wolfe (now at the National Alliance for Public Charter Schools), “played a critical role in increasing the number of charter schools across the country.” It has assisted schools to come into being that otherwise could not afford to launch. It has facilitated the growth of successful charter networks. And because there are more than 7000 such schools operating today, attended by some 3.2 million youngsters, mostly poor and minority, and staffed by 219,000 teachers, it’s fair to say that this major alteration within American public education isn’t going away, no matter how much the traditional school establishment and a cadre of aspiring politicos would like it to.

In the paragraphs that follow, we see where CSP came from and what it does—and get a peek at why establishmentarians and curmudgeons are now pushing their political pals to curb it. We also see why it can fairly be seen as a model for federal R & D efforts in education—and how it differs from the other big “D” initiative that Washington launched in the early 90s, the New American Schools Development Corporation.

—

Though the concept can be traced back years earlier, 1991 marked America’s first-ever charter law (Minnesota) and 1992 brought the second (California.) Only one of these independently operated public schools of choice had actually opened its doors when Bill Clinton was elected president, but he favored (public) school choice, was a keen supporter of the charter idea, had (as Arkansas governor) chaired the Democratic Leadership Council and its Progressive Policy Institute, which served as key boosters for the charter idea, and in time would declare that he wanted to see 3,000 such schools in the U.S. by the year 2000. (That target was hit a couple of years later.)

Clinton wasn’t alone. Teachers union head Albert Shanker had helped awaken America to the charter concept. Democratic legislators like Ember Reichgott (later Ember R. Junge) in Minnesota and Gary Hart in California, as well as Democratic governors such as Colorado’s Roy Romer were pivotal figures in enacting state laws that allowed charters to come into existence. So, unsurprisingly, were innumerable Republicans, importantly including—as events unfolded—Minnesota Senator Dave Durenberger.

Charter schools, in retrospect, were a bit of a blind man’s elephant, which is to say one could easily associate them with a number of different goals, missions and reform preferences, according to one’s perspective. They were indisputably schools of choice, yet they were public schools—free, open to all, secular, and ultimately accountable to elected officials. They were—and are—a robust form of school choice without vouchers, but they’re also elements of a vibrant education marketplace in which parents, neighborhoods, groups, and communities can launch schools that are largely freed from the bureaucracy and can thus align their operations with their own needs and priorities, making them a sort of half-way house between voucher partisans and district school monopolists. They invite entrepreneurialism, but that includes teachers who want to design and direct their own schools (which explains Shanker’s support). They empower principals. They give exit visas to poor kids trapped in dire inner-city schools. Because they mostly start from scratch, they sidestep the misery of trying to “turn around” a failing school. They can function as laboratories of educational innovation in their own right. And much more.

It’s not surprising that “New Democrat” Clinton wanted to see lots of them—and was game to pursue that goal despite opposition from teacher unions and the rest of the public-school establishment. (Shanker was an education visionary and statesman in this realm, as in many, but here, as in many worthy reforms that he championed, he could not deliver the support of his own AFT.) Unlike many Republicans, who tended to view charters as something that states were doing—and doing in very different ways and at different speeds—Clinton was also game to enlist Uncle Sam to help make more charters happen faster in more places.

He arrived in a Washington that was already abuzz over education reform in the wake of the 1989 Charlottesville “summit” to which President Bush (41) had summoned all the governors, Clinton included, and which gave rise to an exceptionally optimistic and challenging set of “national education goals” for the year 2000. Bush and his education secretary, Lamar Alexander (former Tennessee governor, now senior senator from Tennessee and chair of the education committee), followed up the goal-setting with an ambitious reform strategy dubbed “America 2000.” The parts that required legislation didn’t get very far in a Democratic-majority Congress that was eyeing the 1992 election, but it triggered much discussion of whether and how the federal role might be strengthened so as to push U.S. schools toward stronger achievement—and also brought much discussion of school choice. Indeed, it gave Senators Durenberger and Connecticut Democrat Joe Lieberman an opportunity to moot a federal charter-school assistance program as part of such a strategy—and to get committee chair Ted Kennedy on board with the idea.

Stay tuned for parts II and III.

view

Tell high school students the truth about college readiness

Aaron Churchill
7.17.2019
Flypaper

Proficiency standards may feel like a wonky topic, but they have real-world consequences. When students fail to meet rigorous academic targets but are told they are “proficient”—a word whose dictionary definition is “well advanced in an art, occupation, or branch of knowledge”—they may be misled into believing that they’re on a solid pathway to college. This can exert great costs. Misinformed students could, for example, begin coasting through their coursework when they should be pushing themselves to reach higher academic goals. They might begin planning for admissions to college, only to be feel regrets when they can’t get in. And they might skip opportunities that can prepare them for rewarding careers that don’t require four-year degrees.

Unfortunately, proficiency on many state exams has long had little to do with being “well advanced.” In Ohio, for instance, where debate over the issue is beginning to swirl, 66 percent of students met state proficiency standards in eighth grade reading during the 2017–18 school year, even though just 39 percent were proficient according to the more stringent National Assessment of Educational Progress (NAEP). In fact, Ohio’s standards are so relaxed that the state cautions that meeting this mark doesn’t indicate being on track for college and career success. (Reaching “accelerated”—a level above proficient—does.)

It doesn’t have to be this. Other states with more rigorous standards—like Colorado, Florida, and Massachusetts—report proficiency rates on state tests that are approximately in line with NAEP levels. Yet for states like Ohio, the worrisome harm caused by low proficiency standards, and the resulting misinformation, affects a large number of students.

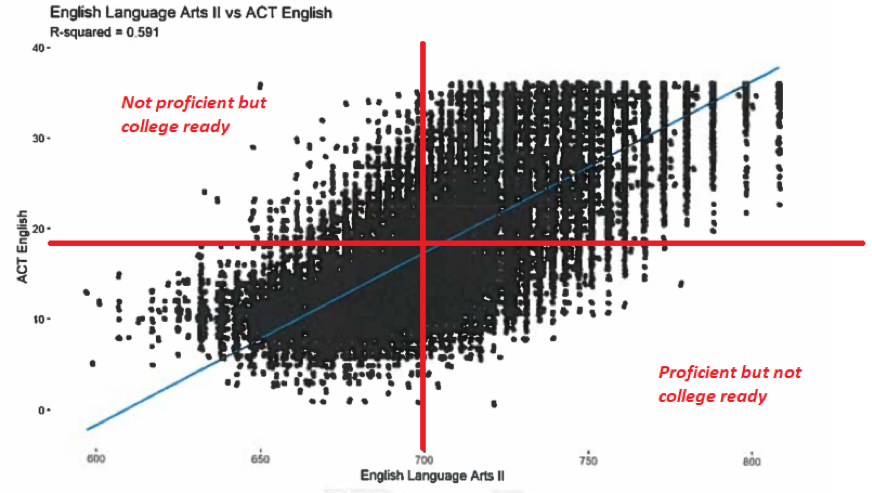
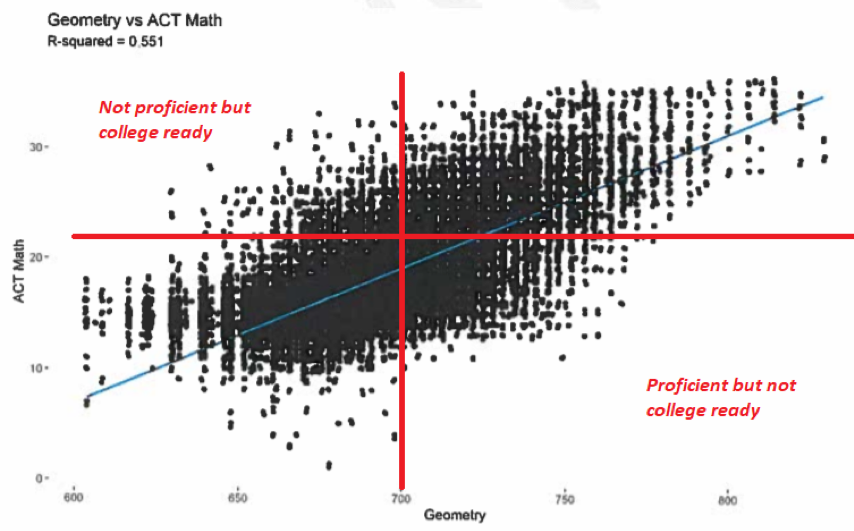
Indeed, a recent, insightful analysis by the Ohio Department of Education (ODE) indicates that such mischief occurs quite often. Consider the following charts, drawn from the agency’s report, that depict the relationship between state end-of-course (EOC) and ACT exam scores. The black dots represent individual student’s scores on the corresponding subject-area tests. Note that these exams were taken by a large majority of students in the class of 2018, the cohort represented in the figures; the EOCs shown here are typically taken during pupils’ sophomore years and the ACT as juniors.

Figure 1: The relationship between Ohio students’ EOC and ACT scores, class of 2018

ac1

ac2

Note: The red lines indicate the scores needed to reach proficient on Ohio’s EOCs, a score of 700 on both exams, and to achieve college remediation-free scores on the ACT, a score of 18 in English and 22 in math.

Three things jump out from these charts:

  • First, we see a positive relationship between the exam scores. As indicated by the upward-sloping blue lines on both charts, students who perform well on state EOCs tend to perform well on the ACT. Though not a perfect, one-to-one correlation, the results remind us that achievement on state exams matters, as they are predictors of performance on college entrance exams.
  • Second, in both subject areas, many high-school students are being deemed proficient who do not reach college remediation-free levels on the ACT. This situation is depicted in the bottom right quadrant of the charts where a heavy concentration of dots exists. While ODE’s report doesn’t provide exact numbers, we can see visually that a substantial number of students are deemed proficient on the high-school EOCs—and likely satisfied with their achievement—who don’t reach ACT scores that predict college-level success.
  • Third, as depicted in the upper-left quadrant, we see that some students fall short of EOC proficiency but achieve college-ready scores on the ACT. In some cases, it’s possible that disappointing state exam results may have been the wake-up call needed for them to achieve higher scores on the ACT. Thus, there may in fact be a benefit to this type of “misclassification,” rather than the substantial risks involved when overidentifying students as proficient. Moreover, there isn’t a negative impact on these students in terms of graduation, as Ohio recognizes remediation-free achievement on college entrance exams if students struggle on EOCs.

States shouldn’t lead students into believing they are on the pathway to college success when they’re not. For states such as Ohio that have low proficiency targets, policymakers should consider raising the bar so that standards more closely align with college-ready benchmarks. This move that would reduce the number of students who are being told they are proficient but not college ready. In pursuing higher standards, policymakers would need to make clear that these more stringent targets aren’t the high school graduation standard—that should be set somewhat lower than college-ready if state exams are used, as is the case in Ohio. They could also stop using straight-up proficiency rates in its school rating system, relying instead on a performance index for accountability purposes.

Many, maybe most, high school students still aspire to attend college. They deserve the truth about whether they’re on pace to achieve their post-secondary goals. Unfortunately, when it comes to state exam results, the signals seem to be getting crossed, as too many students are being told they’re proficient—suggesting “on track” for college or even “well advanced” in their studies—when they aren’t. In communicating state test results to parents and students, honesty remains the best policy.

view

Scaling up proven charter school models

Amber M. Northern, Ph.D.
7.17.2019
Flypaper

The challenge of “scaling up” in education is well documented and the cause of considerable dismay. This NBER working paper asks whether proven charter school models can successfully replicate or scale up and maintain their effectiveness.

Sarah Cohodes (Teachers College) and colleagues examine a policy reform in Massachusetts in 2010 that raised the cap on the fraction of funding dedicated to charter school tuition payments in low-performing districts, the largest among them being Boston Public Schools. Charter operators deemed to be proven providers by the state were allowed to expand existing campuses or open new schools in these low-performing sites. As a result, the number of charters in Boston doubled from sixteen to thirty-two between 2010 and 2014, with most of the new campuses linked to existing “No Excuses” charter school models. The expansion led to dramatic growth in the fraction of sixth graders attending charters, increasing from 15 to 31 percent between 2010 and 2015.

Analysts use records from randomized charter school admission lotteries to study changes in the effectiveness of Boston’s charter middle school sector during these years of rapid expansion. In a nutshell, they compare outcomes of students who received lottery offers to those who do not, which in essence removes selection bias.

They find first that local policymakers did indeed select more effective schools for expansion. These “proven providers” produced larger effects than other charter schools did prior to the policy change. Specifically, they find that one year of attendance at an expansion school increased math scores by 0.32 standard deviation and English language arts scores by 0.23 standard deviation, and these impacts are comparable to estimates for the parent campuses. The Boston middle school charter sector increased its average effectiveness despite its rapid doubling of growth, demonstrating that scaling-up can work if done well. Moreover, expansion charters produced these large effects while enrolling students that were more representative of the general Boston population than students at other charter schools.  

Next, analysts dig into why this may have occurred. They find that the quality of the “fallback” schools for students who lost the lottery does not explain the success of expansion campuses, as they are of average quality and not a key source of variation. However, their value-added models show that charter school teachers consistently deliver effective education, despite the high proportions who are novices and the substantial amount of teacher turnover. Their qualitative data suggest that this may be due to the charter schools’ “centralized management” of teachers and their standardized instructional practices. For instance, all of the principals at expansion campuses were former teachers from the original campus, which appeared to make a real difference, since these leaders were already familiar with core school-level practices.

Analysts close with this: “This paper shows that, in the charter school context, replicating existing charters may be a better option than allowing new providers to enter the sector.” On the one hand, that makes a lot of sense. Yes, let’s encourage brand-name operators to add more “high-quality seats.” On the other hand, if we’re so risk averse as to prevent newcomers from entering the sector, we’ll soon be left with a charter school monopoly—precisely what the charter movement was supposed to break up.

SOURCE: Sarah Cohodes et al., “Can Successful Schools Replicate? Scaling Up Boston’s Charter School Sector,” National Bureau of Economic Research (May 2019).

view

The implementation and impacts of reforms in Louisiana

Jessie McBirney
7.17.2019
Flypaper

Louisiana’s education system has had a rough go, historically. One of the poorest states in the nation, Louisiana sees lower-than-average graduation rates and scores below average on every NAEP test subject. The state has worked hard to reverse these trends since 2012, implementing sweeping and creative changes to state standards, assessments, and teacher resources. A recent report from Julia H. Kaufman, Elizabeth D. Steiner, and Matthew D. Baird at the RAND Corporation seeks to understand the implementation—and more importantly, the impacts—of these myriad policies. The bottom line: Teachers are enthusiastic about the improvements, if not a little overwhelmed at the speed of change, but students haven’t felt much effect just yet.

The authors layer data from several different sources into their exploration of the state’s reforms. To understand Louisiana teacher experiences and compare them to those of teachers nationwide, they draw from RAND’s own American Teacher Panel, a nationally representative survey of educators. They also conducted site visits at four school systems, interviewing office staff, school leaders, and teachers. And to explore how the state’s reforms have actually affected student outcomes, they collect student- and school-level data on math and English language arts achievement from NAEP and the Louisiana Department of Education.

Kaufman and colleagues organized their findings around each of five key policy actions.

  1. Use state standards, assessments, and accountability to define and communicate a high bar for what is expected from schools and students.

The teachers and administrators interviewed were largely supportive of Louisiana’s new math and ELA standards that were adopted in 2017 and replaced the Common Core, and the majority said standards helped guide their instruction. However, they were not as supportive of the statewide assessments.

Teachers worry that the standards are too challenging for many students. Particularly in the early years of implementation, students struggled to meet rigorous standards without an equally rigorous foundation laid in previous grades. As one math teacher opined, “You need to teach fractions in third grade; we need to do fractions every year after that.”

  1. Signal to educators which instructional materials are high quality, and which are not.

The Louisiana Department of Education now offers annotated reviews of commonly used math, ELA, and science curricula for free online, sorting resources into three tiers of quality. RAND found widespread buy-in to this system. At least one administrator at every case study site was aware of which curricula were rated Tier 1 (the highest quality). Moreover, more Louisiana teachers reported using Tier 1 materials than the national average.

The online reviews cover formative and benchmark assessment options as well, though the state education department also offers LEAP360, a standards-aligned, online assessment-building tool. Teachers reported using LEAP360, but rarely other Tier 1 assessment materials. Above all, educators were wary of simply adding to the number of tests students must take each year.

  1. Increase the supply of high-quality, curriculum-specific professional development.

Interviewees across all case study sites recognized the need for intensive professional development to get teachers up to speed on new, highly-rated curricula and its corresponding standards. New teachers in particular said they would like guidance in understanding new standards, as they didn’t learn how to teach to standards in their teacher prep programs (though we at Fordham hardly count this a surprise). Office administrators noted the importance of subject- and curriculum-specific PD and emphasized that teachers must first get familiar with the new standards before “delving deeply” into more specialized development.

RAND found that most districts design their own PD programs. Many of the resources they created centered on Tier 1 curricula, but again, administrators chafed at the speed of change as they worked to keep their PD offerings aligned with the latest standards and curricula.

  1. Incentivize the use of high-quality curricula, professional development, and formative assessments.

Reforms from the state capitol can only go so far without major buy-in at all levels, which is why the education department worked hard on communications plans and incentive structures. Louisiana offered Tier 1 curricula at discounted prices for all schools and further funding for low-income schools. Now a school receiving a “D” or “F” grade on its annual report card must include the use of Tier 1 curricula in its turnaround plan.

Most teachers believed the standards and curricula could improve student outcomes. In fact, interviewees mentioned the new resources themselves more often than the accompanying financial incentives.

  1. Use communication structures to identify champions and gather information.

Most interviewees had at least some knowledge of most state policy changes, RAND authors found, thanks to the state’s many conference calls, webinars, newsletters, and regional meetups. In 2017, about a third of Louisiana teachers regularly used the state education department website, more than double the national rate.

***

So is any of this helping students? Maybe. There is a slight upward trend to LEAP scores overall, but black and Hispanic student scores decreased slightly, thus widening the achievement gap. Biannual NAEP results show similar trends, with a slight upward trend but a widened gap in seven of eight subjects—this while national achievement gaps continue to decrease. ACT scores for Louisiana eleventh graders are also up slightly, but flat for most disadvantaged groups.

These results are, obviously, underwhelming so far. However, Louisiana has long been one of the most challenged states when it comes to education, and one powerful theme in RAND’s interviews was the mismatch between students’ current reading and math levels and new, heightened expectations from the state. Teachers are still struggling to bridge these gaps. With new tools and better standards at their disposal, though, students may finally get the chance to receive quality instruction from their earliest school days.

SOURCE: Julia H. Kaufman, Elizabeth D. Steiner, and Matthew D. Baird, “Raising the Bar for K-12 Academics: Early Signals on How Louisiana’s Education Policy Strategies are Working for Schools, Teachers, and Students,” RAND Corporation (2019).

view

The Education Gadfly Show: One small step for man, one giant leap for our schools?

7.17.2019
Podcast
 

On this week’s podcast, Fordham’s own Checker Finn joins Mike Petrilli and David Griffith to discuss, during the week of Apollo 11’s fiftieth anniversary, how the moon landing related to American education. On the Research Minute, Amber Northern examines how restorative justice affects racial disproportionality in school discipline.

Amber’s Research Minute

Miles Davison et al., “Restorative for All? Racial Disproportionality and School Discipline Under Restorative Justice,” retrieved from Annenberg Institute at Brown University (May 2019).

Fordham Logo

© 2026 The Thomas B. Fordham Institute
Privacy Policy
Usage Agreement

National

P.O. Box 110
Burke, VA 22009

202.223.5452

[email protected]

Ohio

P.O. Box 82291
Columbus, OH 43202

614.223.1580

[email protected]

Sponsorship

130 West Second Street, Suite 410
Dayton, Ohio 45402

937.227.3368

[email protected]