Andrew Camp and Collin Hitt join Mike Petrilli and David Griffith to discuss Moving Target: The Success and Failure of Missouri’s Charter School Funding Surge, a new Fordham report by David, Andrew, and Collin. They examine Missouri’s effort to close the charter funding gap, how schools used the additional money, and why true funding parity remained out of reach. They also discuss the effects on staffing, teacher retention, and student achievement.
Then, on the Research Minute, Amber Northern reviews new research from Ohio on whether the threat of third-grade retention can improve reading achievement by prompting schools to provide struggling students with additional literacy support.
Recommended content:
- Moving Target: The Success and Failure of Missouri’s Charter School Funding Surge —Andrew M. Camp, Collin Hitt, and David Griffith, for the Thomas B. Fordham Institute
- The Impact of Increasing Funding for High-Performing Ohio Charter Schools: The Quality Community School Support Fund, 2019–23 —Stéphane Lavertu, Thomas B. Fordham Institute
- Charter School Funding: Inequity's Next Frontier —Sheree Speakman, Chester E. Finn, Jr., and Bryan C. Hassel, for the Thomas B. Fordham Institute
- Why Ohio’s third-grade retention law worked (until lawmakers killed it) —Vladimir Kogan, Thomas B. Fordham Institute
- The Effect of Retention Threat on Student Learning Gains: Evidence from Ohio —Sarah Souders and Robert Bifulco, EdWorkingPapers (July 2026)
Feedback Welcome: Have ideas for improving our show? We would love to hear them. Send them to [email protected]
Transcript
This transcript was generated with the assistance of AI and lightly edited for clarity and readability.
Introduction
Mike Petrilli [00:00]
Welcome to The Education Gadfly Show.
I’m your host, Mike Petrilli of the Thomas B. Fordham Institute.
This week, we’re joined by Andrew Camp and Collin Hitt, along with my co-host and their fellow co-author, David Griffith, to discuss their new Fordham Institute report, Moving Target: The Success and Failure of Missouri’s Charter School Funding Surge.
Missouri gave charter schools a major funding boost, but did the new money actually close the gap and improve student outcomes?
Then on the Research Minute, Amber Northern reviews new research from Ohio on how third-grade retention policies and targeted literacy interventions may affect students’ achievement.
All that and more this week on The Education Gadfly Show.
Clip [00:44]
This is The Education Gadfly Show.
Oh my God, we’re back to the bubble kids problem again.
What does Gadfly say?
Mike Petrilli [00:53]
Hello, this is your host, Mike Petrilli of the Thomas B. Fordham Institute, here at The Education Gadfly Show and online at FordhamInstitute.org.
Now, please welcome our special guests for this week, Andrew Camp and Collin Hitt. Andrew and Collin, welcome to the show.
Collin Hitt
All right, Mike. Hello.
Mike Petrilli
Hey, hey, hey.
Andrew is Senior Research Associate at the Annenberg Institute, and Collin is Executive Director of the Policy Research in Missouri Education Center at Saint Louis University.
Also joining us, as always, David Griffith.
David Griffith
Hey, guys. Good to see you.
Mike Petrilli
Yeah, well, first of all, excited that Collin is joining from my hometown of St. Louis, Missouri, where I grew up from age three to age eighteen and became, among other things, a big St. Louis Cardinals fan.
We were just chatting. They had an actually surprisingly good start this year, even though they’re a very young team rebuilding. But they have recently been showing more of what people expected, which was mediocrity. But you never know. They do have a tendency to make a run for it every year. So fingers crossed.
Hey, we have you on the show to talk about a study that the three of you co-authored. That’s right. Even David Griffith. So, David, you get to be the interviewee instead of the interviewer.
That study is called Moving Target: The Success and Failure of Missouri’s Charter School Funding Surge. Let’s talk about it on Ed Reform Update.
Ed Reform Update: Missouri’s charter school funding surge
Mike Petrilli [02:27]
Okay, guys, first of all, congratulations. Great study. And it turned out to be a more challenging study, perhaps, than we thought it would be.
We will talk about the twist. There’s a plot twist in a moment.
Tell us, first of all, about the law that we’re talking about. A few years ago, Missouri passed a bill that basically the notion was to dramatically boost spending for charter schools, right, and try to aim toward greater parity with traditional public schools.
Before this, I believe Missouri had some of the biggest gaps in spending between charter schools and district schools. So tell us about that law.
Collin Hitt [03:06]
So, by way of history, Missouri’s charter school law was designed really to allow for charter schools, which are almost entirely located either within Kansas City or St. Louis City School District limits.
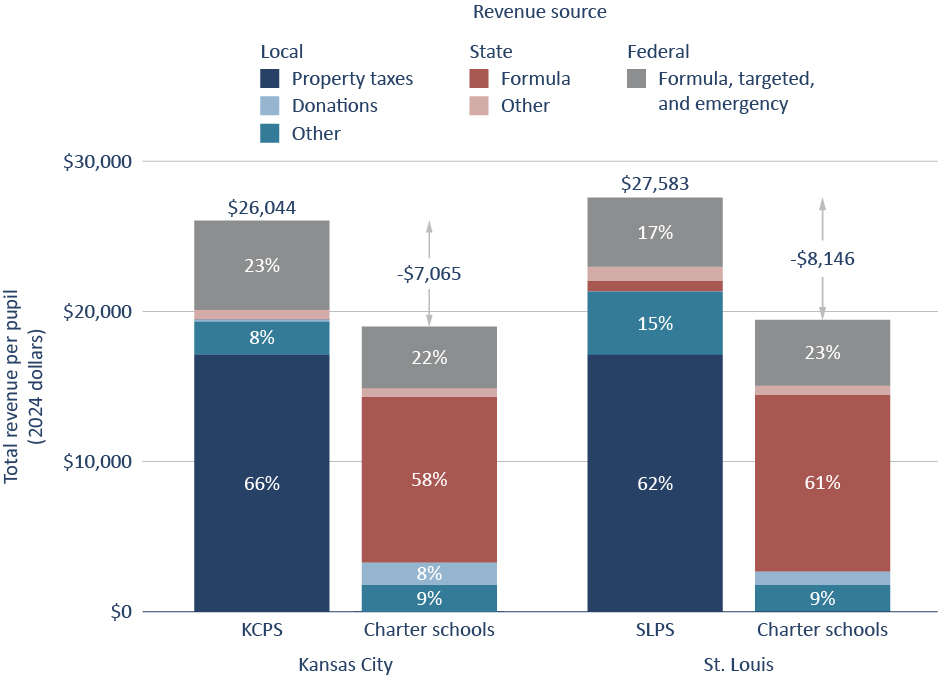
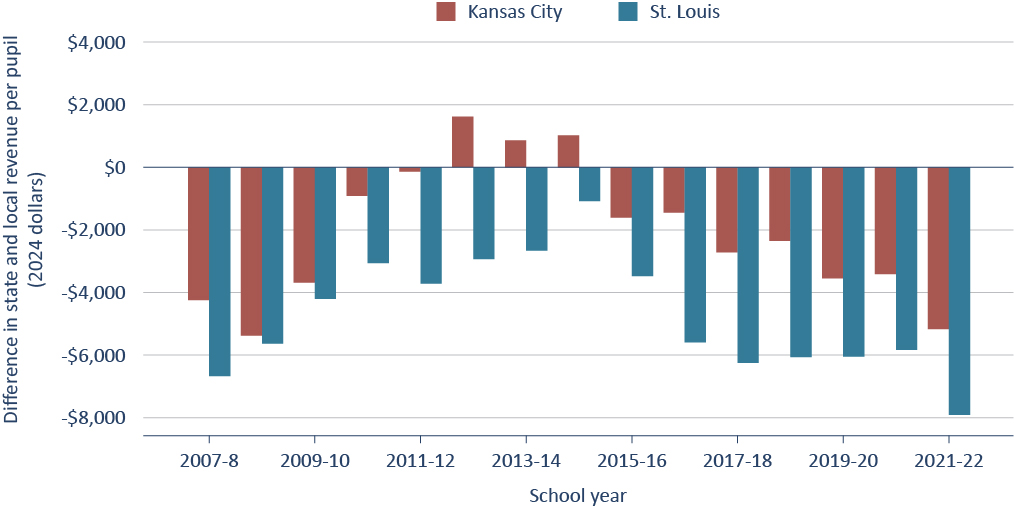
But the law was designed to provide charter schools with the same amount of local and state combined funding as schools in the area districts. And for years, that more or less worked.
But then about ten years ago, you start to see a gap emerge, a lot like what you see in other states, where surrounding traditional public schools were working with more per pupil than were otherwise comparable charter schools.
And that gap was continuing to widen every year. I’m sure we’re going to get into the mechanics of why that was the case, but this had become apparent. And there was no real optimism, however, that a legislative fix was ever going to come. And that was really going to be the only opportunity to fix this and to bring charter schools back on par with traditional public schools in St. Louis and Kansas City.
And then, sort of against all odds, very late in the legislative session in 2022, a piece of legislation called House Bill 1552 passed in order to make charter schools whole.
And the mechanism that state lawmakers came up with is they said the state will pick up the tab. Rather than trying to divert more local money from area public schools to charter schools to put everybody on par, the state will just cut an extra check to make everybody whole.
The law passed in May, signed into law in June. Checks start to arrive in August, literally out of nowhere. It was a funding shock, which, as researchers, we like to study school finance. We like to study all kinds of things that vary, but rarely do we have any natural experiment, some money that just comes out of nowhere where we can really isolate the impact of a funding increase.
But that’s what we had in Missouri.
One of the things that we found, as you’ll see later, is that funding shock was way larger than anybody was anticipating at the time, which just turns this into an even cooler public policy development to research.
Mike Petrilli
How much money are we talking about here for the charter schools, extra money per pupil?
Collin Hitt
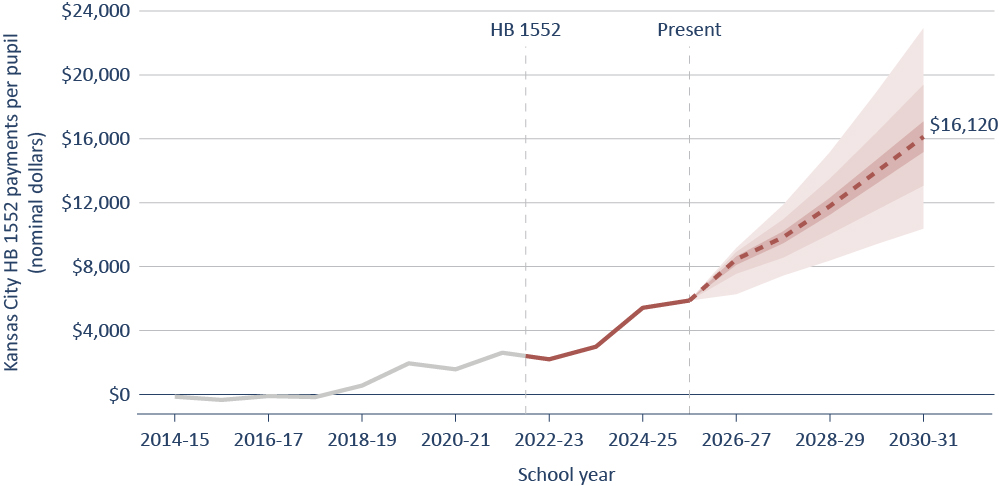
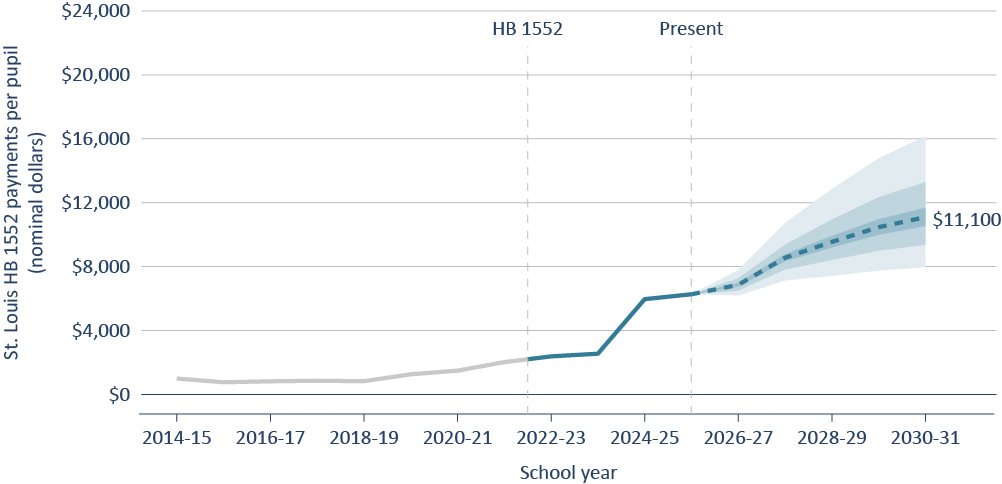
Well, the original projections were somewhere in the range of $2,400 to $2,700 per pupil, which would not have been enough to entirely close the gap between charter schools and surrounding public schools.
But over a twenty-student classroom, you’re talking about $50,000 a year or more per year in permanent revenue that, again, nobody was expecting. And you can see this when you go and look at charter schools’ budgets. They weren’t projecting this revenue. They weren’t anticipating it.
Part of our research is, do we see any terms of anticipatory effects? Are people spending the money before it arrived? No, is the answer to that.
And that alone looked like something that was going to be really interesting to study. That’s a lot of money. What we’re finding over time is that the increase is much larger, maybe two times as big as that, and perhaps on pace to be even larger yet, which I’m sure we’ll talk about.
What the funding shock was expected to do
Mike Petrilli [06:16]
Well, look, this means that it perhaps is the biggest funding shock for charter schools in history, in terms of a big upside coming in.
We studied a somewhat similar shock in Ohio a few years ago. I guess the theory here, and we’ve talked about this, David, on the show, is that in school finance reform in general, you do expect, all else being equal, that if you put a bunch of new money into the schools, you should get some kind of impact.
And there’s no reason to believe that that wouldn’t happen in the charter school sector.
And this is always tricky, right? There was a time way back when at the beginning of the charter school movement when some of us would say, well, maybe they don’t need as much money because they’re not going to have to deal with the union, and they’re going to maybe be able to find innovative ways to save money.
And maybe on the margins, that’s true. The problem is, if you have a huge funding gap, then, for example, it’s impossible to compete on salary, on pay and benefits, with the districts around you. And then if that’s the case, you struggle every year to try to recruit and retain good teachers.
So, Andrew, David, am I saying that right in terms of what the hypothesis would be here? That you would expect with this kind of funding shock to see outcomes improve for charter schools?
Andrew Camp [07:45]
Yeah, I think that that’s right.
I think one thing to note is that the evaluations of Missouri’s charter sector prior to this bill being passed and the new dollars going to charters, they already were quite effective at moving student outcomes.
Certainly as a researcher, the first thing that popped into my head is, does the marginal dollar go further in charter schools than it does in traditional public schools? If we do this study, how is this going to benchmark against the existing school finance reform literature?
Mike Petrilli
Okay. All right. And that literature, again, there have been debates over the years. Does money matter? Does it not matter? But it’s so hard to isolate sometimes the impact of money alone.
And so it’s why these shocks are really interesting, because you can say, okay, it’s all else being equal. What happens when you increase money?
Which is not to say that if you just keep increasing money forever, and let’s say you get to the point like in New York City where you’re spending $30,000 a year, that you’re going to continue to get positive returns on that. But maybe, especially at lower levels, a big bump might make it a lot better.
Again, David, am I saying this right? I feel like you hold me honest here. Is this fair?
David Griffith
No, that’s completely fair.
And as always, I think it’s more complicated than the bumper sticker version. I think, like you said, it makes sense that returns would diminish. So if you’re already spending $30,000, you probably will see a smaller return than if you’re spending $10,000.
And we tend to think that money matters more for kids who are learning less at home, who are more reliant on school for the basics. And so we think it might matter more for poor schools than non-poor schools.
But I think the big picture, honestly, is that it’s actually quite hard to isolate the effect of spending, whatever it is. As you know, we went decades basically struggling to figure out if it was having an impact.
And to be honest, I think we still struggle a little bit, right? Because the money just doesn’t sit still. It’s fungible. It trickles from one year to the next. Even when you can see it, there are things that it purchases that don’t necessarily have immediate impacts, like a new teacher.
So it’s still, I think, challenging to really nail it to the wall.
Where the money went
Mike Petrilli [10:20]
All right. And now for the big twist. Collin, you end up doing this study. And again, you’re trying to compare the spending in charter schools to the spending in traditional public schools, and then the outcomes in each sector as well. And lo and behold, what happens in the district sector?
Collin Hitt
Well, it’s comparable to the district sector.
So the research design that we did effectively used other traditional public schools in Missouri as your control group and looked at trajectories in hiring and spending and all sorts of things in those schools, and then kind of constructed, in a way, a trajectory similar to what we were seeing in charters.
And basically, do we see a change in charter schools relative to any change that we see at traditional schools at the same time?
So really, our first question all along here was, where did the money go?
And one of the cool things here is, if you don’t mind, Mike, I’d love to give props to Andrew, who is a phenomenal methodologist, a great writer, and just a great co-author.
But also, one of the things we like to say at the PRiME Center is one of the most important skills in research is detective work. And he’s one of the best people at detective work I’ve ever seen.
So we’re all used to the school finance datasets that we’re used to working with that normally we think of as rich, but we know that they’re not nearly as detailed as, say, a district or a charter LEA’s actual full financials that you would see if, say, you were a board member.
Turns out you can pull those financials from a specific portal in Missouri on a one-by-one basis. Almost nobody has exploited or even known this data exists. Andrew found it and then built what is without a doubt the most comprehensive and detailed school finance dataset in the history of the state, the most impressive one I’ve ever seen in any state.
And that alone has come out of this project. And because of that, we were able to look at some super detailed, fine-grained outcomes.
So first of all, where did the money go? Per 100 students, charter schools increased the number of full-time equivalent teachers they had. They were able to increase more support staff. And then what does that mean? They were also able to pay that staff more.
And over time, whether this be through increased retention or through recruiting more experienced teachers, we saw the average experience of the typical charter school teacher in the classroom increase, even in this short window of time.
That’s largely where the money went.
Mike Petrilli
Okay. And I think I did a poor job setting this up because I was going for a different twist in the story.
That’s great and that’s important, that we’ve got greater teacher retention. So I’ll just say it, though. The twist is that it turned out that the districts, St. Louis and Kansas City, ended up getting way more money also at the same time. Right?
We kind of expected going in that this shock is going to be a big upside increase in spending for the charter schools. And it turns out they did get that boost. But this is because of a weird quirk in Missouri’s law, right? Andrew, do you want to explain this?
The plot twist: District revenue kept rising too
Andrew Camp [13:53]
First off, Missouri’s funding law is one of the weirdest I’ve seen.
The local effort calculation uses assessed values from 2005 instead of just updating every year. So the state is sort of blind to how much property tax revenue, at least in their funding calculations, districts are bringing in.
But the twist that you’re referencing is this continued increase in revenue for Kansas City Public Schools and St. Louis Public Schools. And a lot of that is driven by the reality that those districts keep the property tax revenue that they take based off the current year assessments. They’re updating every year just like anywhere else.
But as their enrollments decline, the amount of revenue per student grows quite quickly, right? You’re splitting a pot among fewer and fewer students. So the per pupil dollars that the district has available to spend grows.
What we’ve seen, especially following Covid with district enrollment declines and some growth in the property tax revenue, is that these districts are receiving quite a bit more even than before the law was passed.
That is unrelated to the law itself. It would have happened either way, likely. But that’s why the gap has not quite closed, is that districts are still seeing this pretty sizable growth in per pupil revenues.
Mike Petrilli
Yeah, really, really interesting. And something, again, we have talked about on the show about what happens with enrollment declines.
Often in the media, it’s depicted as this budgetary emergency. You’re going to lose kids and you’re losing money. But actually, it turns out you lose kids, but you end up keeping a lot of the money because the local money just keeps coming.
And in a time when housing prices are going up, even in the Midwest, where maybe it’s not as much as on the coasts, it still makes a difference, right? Commercial property values, other things go up, then the money keeps coming in.
So, David, then what can we say? Charter schools get this huge increase. The district schools also get a big increase. Can we see any impact then on student achievement between the two sectors or other outcomes?
David Griffith [16:02]
Yeah. So I feel like Andrew should probably speak to this one as well. But we see some impact in math, and it’s sort of tentative, I think. I think the jury is probably mostly out, but certainly outcomes didn’t go down. And we don’t see much in English language arts.
Mike Petrilli
And again, we’re comparing, just to be clear, the charter sectors in St. Louis and Kansas City to the district schools in Kansas City and St. Louis? Or we’re comparing them to all schools in Missouri?
David Griffith
We’re comparing them to other schools in Missouri.
Mike Petrilli
Okay.
Andrew Camp
So if I can just chime in there, because I think the achievement, ultimately, that’s what I care the most about.
It’s important to note that the measures of student growth and achievement that we have for this study are the school-level value-added estimates. And so this is a measure of how much students learn each year. It’s not a good outcome for the cumulative effect of this.
But what we’re finding is about three percent of a standard deviation increase in student value-added growth. That’s kind of like knowing how fast you’re accelerating, but not knowing how fast you’re going.
And so part two of this study is looking, we have the student-level data now, to actually estimate the impact on students in a way that’s comparable to these other school finance reform studies.
Now, that three percent of a standard deviation, that’s a per-year figure. So I would note that if you multiply that by the number of years a student might be in a tested grade, you get to fifteen to eighteen percent of a standard deviation increase in math scores.
That’s a moderate to large effect, and on par with what you would expect with this amount of spending based on some other studies.
Mike Petrilli
Yeah, interesting. And again, of course, if districts hadn’t gotten this big windfall of money too, you never know how this plays out, right?
Part of what’s happening here is you’re trying to get the charter schools to be able to compete to recruit and retain great teachers. And the districts keep being able to spend, maybe outspend them or outpay them on that side as well.
Right, Collin? I mean, is that part of what makes it so complicated?
Collin Hitt [18:13]
It is complicated, and we go into detail in this in the paper.
But part of the reason was how the state fixed this, so to speak. Rather than just having a line item in the budget and saying, here’s an extra $67 million, which is what they projected the original amount cost to be, come back again, we’ll put another line item, they didn’t do that.
They wrote it into the formula.
So they said, for example, whatever St. Louis Public Schools has this year, we’ll try to make sure that charter schools have that same amount next year.
And it’s written in the formula. So as that first number, for example, in St. Louis, continues to go up because local revenues are going up and enrollment continues to stay flat or slightly decline, that per pupil number that SLPS is spending is going up.
And so by law, in formula, state spending is chasing that. And that’s why it’s larger than what we thought.
And nobody else in the state, the other 515 school districts in the state, including ones that are literally one foot away from where these charters are operating, has the same funding arrangement. So that becomes a sort of control group there.
So if you look at how charter schools compare to their host district, which is St. Louis Public Schools or Kansas City Public Schools, the law is designed to chase them. But they’re competing, of course, you know St. Louis well, you know Kansas City well, for resources, for teachers, for attention, for everything else.
Their real competition is every bit as much all of those other districts who are just completely unaffected by the law, which makes them a good control group. And in that respect is where you see charter schools increasing hiring, able to increase teacher pay, relatively speaking, and some early evidence of increasing math achievement with the use of those resources.
David Griffith [20:02]
Mike, if I can just jump in really quickly.
I think the broader lesson here, at least for me, is that if you don’t share local revenues with charter schools, eventually fiscal mayhem will ensue.
Basically, you have a choice. You can either tolerate an increasingly inequitable system where half of the kids just don’t get the kind of dollars that they deserve to get an education, or you can cut a giant check and allow them to keep up with traditional public schools as funding spirals upwards and effectively ask the rest of the state to bear the burden.
Or you can bite the bullet and do the obvious thing and just let local dollars follow local students wherever they go.
And so I think for the past twenty years, we’ve been sort of allowing one of the first two stories to play out because it’s politically convenient and it sort of keeps everybody happy.
But I think we’re maybe approaching a tipping point where we’re going to have to start making some tough decisions and planning for the long term.
Mike Petrilli
All right. I think we’re going to have to leave it there, gang.
But again, amazing work. Collin, Andrew, David, appreciate you coming on, talking about the study again for folks at home.
It’s called Moving Target: The Success and Failure of Missouri’s Charter School Funding Surge. Check it out, guys.
And now it’s time for everyone’s favorite, Amber’s Research Minute.
Research Minute: Third-grade retention threats and reading achievement
Mike Petrilli [21:40]
Amber, welcome back to the show.
Amber Northern
Thanks, Mike.
Mike Petrilli
So, you know, sometimes we end up talking about Virginia and Maryland because of where we live. But this week’s show is about the Midwest.
We were just talking about Missouri and a little bit about Ohio, with both states having recently boosted charter school funding. And now we’re going to talk about Fordham’s home state of Ohio yet again.
Amber Northern
Again, I realized for our Ohio readers and listeners, our Ohio team also covered this. But I’m like, it’s important. It has had national implications in my view. So our podcast listeners are going to get a dose of the same study.
So anyhow, you ready for me?
Mike Petrilli
Let’s do it.
Amber Northern
All right, let’s do it.
We are looking at students who were held back. All these states are trying to figure out, do we want to do this third-grade reading guarantee? Do we not? And we’ve got some new evidence.
This time out of our home state of Ohio, they’re not just looking at kids who were retained. They’re looking at the threat of retention. And I’ve covered some sort of earlier studies on this, but this one’s a more rigorous study and it’s further along. So it’s important.
It looks at Ohio’s Read to Succeed law, which again had the third-grade reading guarantee in it. It required students below a state-set proficiency threshold on their grade three ELA exam to basically risk being held back.
When we look at the data, we’ll find that only 1 percent of at-risk kids were actually retained during 2014 through 2017.
So this study says, okay, we had 1 percent retained, but there is probably a much larger group that was exposed to the threat. And did that make a difference?
And so they’ve got a neat design here where they’re able to separate out the threat. They take advantage of this natural experiment that’s built into Ohio’s testing schedule. Basically, third graders who took this ELA state test at least twice, so once in the fall, once again in the spring, their highest score determines whether they are ultimately retained, at least on paper.
So they focus on what happened after that fall test. They compare students who scored just enough to be safe from retention, regardless of how much they might learn later in the year, with students who fell just short of that bar and hence continued to face the threat of retention.
They have 500,000 first-time grade three students across these four cohorts, 2014 to 2017. Again, this is a regression discontinuity design examining kids above and below that threshold, so it doesn’t generalize to kids outside that range.
All that said, key finding: The threat works. I think that’s basically the bottom line.
Students who remained exposed to possible retention after the fall test score did significantly better by the end of third grade than students who had scored just high enough in the fall to avoid that threat. Not only in language arts, which was the interesting part, but also in math.
And so they say this math effect is kind of important because it shows that these gains aren’t merely test prep for the ELA test.
And they did look into the fading, because now we always look into fading. And it did fade modestly over time, but it still remains statistically significant through the seventh grade, which is not too shabby.
The authors estimate a spring grade three ELA gain of .077 standard deviations, with effects still detectable again through grade seven. At grade seven, it was about .03 standard deviations.
And then the threatened students, I feel bad saying the threatened students, but you know what I mean, they’re about 6.5 percentage points more likely to be assigned to some form of literacy program.
So this is where we actually think this instructional time, the small group tutoring, all these things are the mechanism for the improved achievement that we see.
And it also appears that this threat of retention changed how schools respond, with effects largest, and this is important, largest in higher spending districts and in schools serving more at-risk kids, even when those kids aren’t much more likely to be assigned to literacy programs.
So that again kind of shows us that the threat of retention and the school-level pressure that we’re seeing could be sort of complementary forces, where they’re kind of working together in different ways.
The students under retention threat are also less likely to be absent, so that’s another contributing factor.
And effects jumped notably in 2016 when Ohio first began reporting retention data and adding these financial incentives tied to outcomes. I’m not sure what they were, but that wasn’t discussed in the paper too much. But the bottom line was this reporting and incentives also mattered.
And then the bad news, the depressing news, is that Ohio lawmakers actually weakened their retention requirements in 2023. Basically, if we think that some of the effects that I just told you about came from the threat, and now we do, not holding back a small percentage of kids is not what’s moving the needle here.
It could be that now that they’ve watered down this requirement, which they have, we may not see the impact on this larger number of students that we saw just by this threat.
So there’s, I don’t know, maybe no more. I’m not sure exactly how it was watered down.
Anyway, that was kind of long, but that’s what I’ve got.
The good news and the bubble kids problem
Mike Petrilli [27:46]
Well, I can fill in a little bit about this bad news part.
First of all, the good news. It is great. And it’s more evidence that states absolutely should have retention policies like these. I think there’s a good argument for trying to maybe do them earlier than third grade. Nothing magical about third grade necessarily.
But there is some bad news. The first one, as you say, Ohio got rid of it. I mean, this is classic Ohio. I hate to say it. When the going gets tough, the Ohio lawmakers give up.
There was political pressure. You know, “Oh, we don’t like holding back kids. The kids feel bad.” And so now they basically have a loophole that you could drive a bus through that says if the parents don’t want their kid retained, they don’t have to be retained.
So basically, districts just go to the parents and say, “Hey, the state wants us to retain your kid, but if you tell us to, we’ll just pass them along to fourth grade anyways.” And guess what? Almost everybody gets passed along.
So that basically killed the retention policy.
The other bad news here, though, and I think it was David that pointed this out to me first, was that, oh my God, we’re back to the bubble kids problem again. What the study is showing is that the kids that are closest to the cut scores, closest to the proficiency line, the on-track line, get the attention.
And the kids that are above that line do not any longer get the attention. Ah, this is terrible.
As much as there are good things happening in Ohio, at least Ohio has a big focus on K–3 reading. There’s a piece in their state report card for judging schools based on how much progress they’re making on this. It’s not done in a value-added way. So we’re back to this bad thing with proficiency, where the bubble kids get the attention.
I mean, is that fair to say, David? Is that the right way to say it?
David Griffith [29:47]
I mean, I think there’s something to that.
The study has sort of all of the good sides and bad sides of accountability rolled into one, right?
I mean, it’s pretty unambiguous. Accountability works, whatever it is that you’re pushing on, right? That you’re sort of being mean about. You dig into the data and you see that, in fact, we’re moving the reading scores of these kids who can’t read very well, and that’s a huge deal.
But yeah, you make a good point, right? Which is, okay, relative to the kids who are just above the cut score. And this is what folks on the other side of the accountability debate will say: “Okay, but you are what you measure,” right?
And you know, kind of look at the leakage here, look at the leakage there. And so it’s really important to think carefully about the incentives. You can probably apply some sort of discount to whatever gains we’re claiming.
And then there’s the other point that you made about the politics, right? It’s got to be sustainable.
I don’t know. We’ll probably keep beating the drum no matter what happens, right? But it is demoralizing to see things that are working essentially just undone, despite the fact that you can point to the data and say the kids are benefiting.
So yeah, I don’t disagree with you, but I don’t think we should look past the good news here as well, even if it’s short-lived.
Mike Petrilli
And maybe the way to balance it is you still have some kind of third-grade or second-grade retention policy that you actually enforce, but then you also figure out a way to measure student achievement in those early grades and have some kind of value-added accountability system, right?
This is the craziness of saying, for school accountability, we don’t start measuring outcomes until the end of the third grade. And so that creates all kinds of strange, perverse incentives as well.
If you were actually holding schools accountable for helping all kids make progress K–3, really K–5, if you’re in elementary school, then maybe that balances out some of those other weird incentives with the grade retention.
Amber Northern
Yes.
I wonder, too, whether the threat of telling a parent, like, your child could be held back, I mean, because we know under the other program they weren’t really getting held back anyway. So it does make me wonder how we define threat.
And it’ll be interesting to see whether just informing a parent, even if they say no, functions in the same way an actual threat would, even though it didn’t really work that way, if that makes any sense.
Mike Petrilli
Yeah, no, that’s interesting. What is it that the school people are afraid of?
I think that a lot of educators, they sincerely feel bad. They feel bad for this kid having to be held back. And so this really maybe seems to motivate them to do whatever it takes to add resources, to maybe reach out more, get the kid in school, all the things we want to have happen in an accountability system, because they view it as such a bad thing.
But I think you’re right, Amber. It’s got to also get the attention of the parent. Like, what? My kid’s going to be, you know, we know from all the Learning Heroes data and other stuff that most parents think their kids are doing fine, right?
And this has got to come as a shock to a lot of parents and just saying, what do you mean? My kid can’t read, and you might hold them back.
David Griffith
Yeah, and there are a bunch of confounds here, right?
One of them is that I think the stuff that really matters is happening before we can really feel like we can apply the pressure through tests. And so, I don’t know. I’m not sure exactly how else to get parents and teachers to take this seriously other than to push on third-grade test scores under our current system.
But you can make the case that, honestly, what the data seem to be telling us about kids is more important in these years than, frankly, any other years. This is reading in the years when kids have to learn how to read.
And so I don’t know of a way around it, right? I think we have to push on these data. I think we have to insist that people are honest about this.
I don’t know. I agree. I think it’s a great question, like, what are they afraid of exactly, right? I don’t know that fear is quite the right word for it.
I think it brings focus in an area where people are inclined to not want to believe the bad news. And I think that probably includes teachers as well as parents. But I think we’re not allowing them to discount the bad news if we adopt a policy like this.
Mike Petrilli
All right, gang, I think we will need to leave it there.
Great stuff, Amber. Thanks for bringing it to us.
Amber Northern
You got it.
Mike Petrilli
Love that it’s from Ohio. Wish that Ohio would go back to its old policy.
All right. That is all the time we’ve got for this week. So until next week.
David Griffith
I’m David Griffith.
Mike Petrilli
And I’m Mike Petrilli of the Thomas B. Fordham Institute, signing off.
The Education Gadfly Show is a production of the Thomas B. Fordham Institute, located in Washington, D.C. For more information, visit us online at FordhamInstitute.org.