In 2022, the state of Missouri made a concerted effort to eliminate its charter school funding gap. But how much progress has it actually made? And what have charters done with the additional funds?
To find out, researchers Andrew Camp, Ph.D., Collin Hitt, Ph.D., and David Griffith, Ph.D., analyzed nearly two decades of data on revenues and expenditures in charter and traditional public schools.
The biggest takeaway: while the gap between districts and local charters has narrowed, true funding equity remains a moving target.
Download the full report or read it below.
Foreword
By Amber M. Northern and Michael J. Petrilli
For those of us who have long pushed for charter schools to receive fair funding, progress has been slow, uneven, and hard-won. That’s why we at the Thomas B. Fordham Institute have spent decades documenting where the gaps remain largest.
More than twenty years ago, we published a landmark study, Charter School Funding: Inequity’s Next Frontier, which was then the most comprehensive state-by-state analysis of how public charter schools are funded and how their revenues compare with those of district-run schools. The gaps were striking: At the time, in the average state, the shortfall was $1,801, meaning charters got 78 cents on the dollar compared to similar district schools. The gap was largest in Missouri, where charters received $3,638 less per student.
In the years since, the Show Me State has preserved its reputation as one of the country’s worst offenders. So, we took notice when, in 2022, Missouri lawmakers surprised many observers by enacting a bill aimed at eliminating the longstanding funding gap between the state’s charter and traditional public schools.
On its face, HB 1552 looked like the largest funding shock in the history of the charter school movement. After all, by 2024–25, it had increased the total state and local revenues of Missouri charter schools—all of them located in Kansas City or St. Louis[1]—by nearly $4,000 per pupil. That’s enough to offset most of the roughly 25 percent funding gap they faced before the law took effect. Understandably, its passage was hailed by Missouri choice advocates as a “great relief for charter school students.”
Naturally, we at Fordham wanted to understand its effects on charter spending and achievement, so we turned to three scholars steeped in charter finance research: Andrew Camp, senior research associate at the Annenberg Institute; Collin Hitt, executive director of the Policy Research in Education Center at St. Louis University; and David Griffith, national research director at Fordham.
Because of the number of moving pieces in recent years, including the addition of Elementary and Secondary School Emergency Relief (ESSER) funds, we weren’t sure what to expect. But the real-world story turned out to be more complicated than we imagined.
To be sure, HB 1552 seems to have made a difference for Missouri charters, with much of the new money devoted to additional teachers, more support staff, and/or raises for existing staff (in part resulting from improved teacher retention). And there is preliminary evidence that these additional resources have boosted charter students’ achievement in math (though not in English language arts).
But what complicates the narrative is that even the enormous infusion of new dollars provided by HB 1552 hasn’t led to funding parity because the underlying formula keeps recreating the very gap it’s meant to close.
As always, we encourage interested parties—in Missouri and beyond—to consult the full report for the gory details. But for those in a hurry, we urge attention to three points.
First, prior to HB 1552, Missouri charter schools received almost 30 percent less in total revenues per pupil than traditional public schools in the same city.
Kansas City charters received $7,065 (27 percent) less per pupil in 2021–22 while St. Louis charters received $8,146 (30 percent) less (Figure F-1). As discussed in the report, neither excluding federal funding nor adjusting for student demographics has much effect on these figures, which are remarkably similar to the findings of our 2005 study.[2]
Figure F-1. Prior to HB 1552, Missouri charter schools received almost 30 percent less revenue per pupil than traditional public schools in the same city.
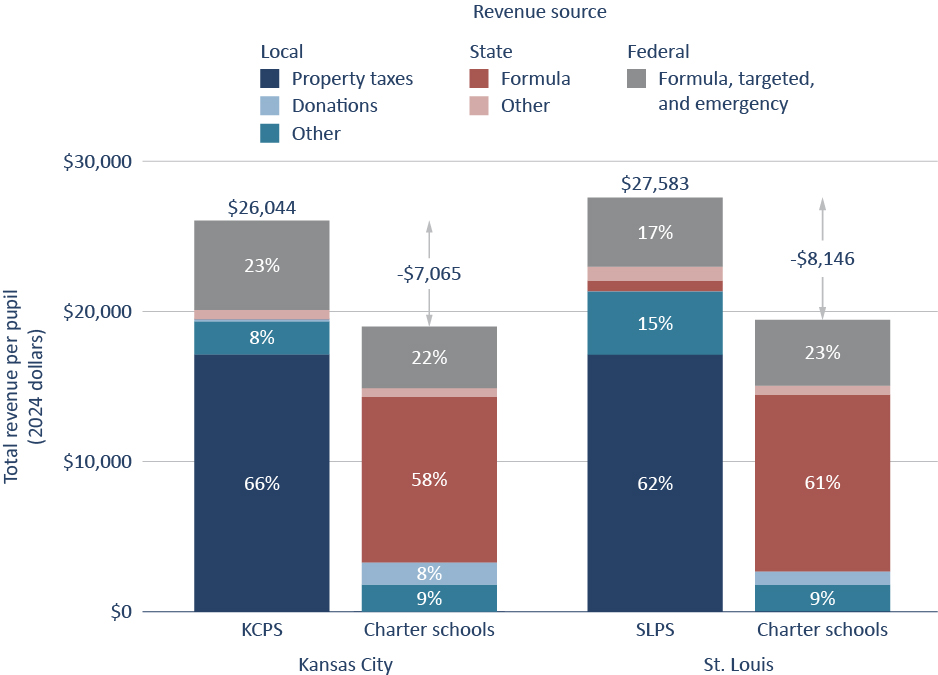
Note: This figure shows per pupil revenues for charter and traditional public schools in St. Louis and Kansas City by source for the 2021–22 school year. Federal revenues include Elementary and Secondary School Emergency Relief (ESSER) dollars in addition to formula grants. “Other state” revenues include funding for transportation, early childhood special education, and adult literacy. “Other local” revenues include monies from the School District Trust Fund (Prop C), the M&M surtax, and the city sales tax (in the case of St. Louis). County revenues that function as property taxes (e.g., state-assessed taxes on railroads and utilities) are included as property taxes while county revenues from fines and penalties are included in “other local.”
Second, despite providing charters with a large fiscal windfall, HB 1552 has mostly failed to close the district-charter funding gap.
A year after HB 1552 kicked in, its effects on its primary target—the gaps in state and local funding per pupil in Kansas City and St. Louis—were nearly invisible (Figure F-2). As discussed in the report, that’s largely because district schools have been allowed to keep nearly all the local dollars they receive despite educating ever fewer students—plus the law creates a two-year lag, leaving charter funding perpetually chasing district funding rather than catching up to it.
While this might seem like a win-win—more money for all public schools in Kansas City and St. Louis!—it means that charters will continue to struggle to compete with traditional public schools with respect to teacher pay and other inputs. Plus, it’s surely not a win for taxpayers.
Figure F-2. HB 1552 has mostly failed to close Missouri’s district-charter funding gap.
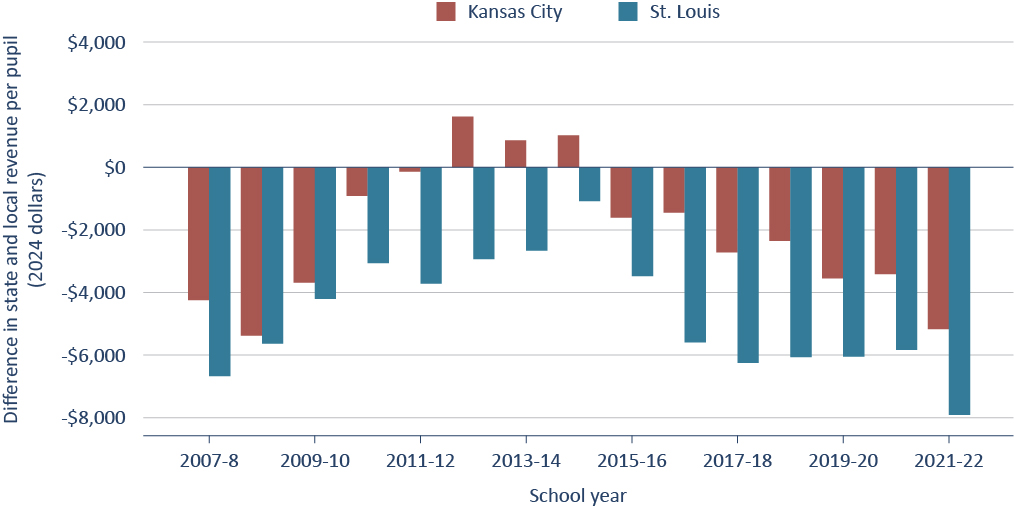
Note: Figure shows the unadjusted differences in combined state and local revenue per pupil between charter schools and traditional public schools in Kansas City (red) and St. Louis (blue). Each bar represents the charter–district funding gap in a given school year. Negative values indicate that charter schools received less state and local revenue per pupil than traditional public schools in the same city. The uneven pattern in the middle years reflects year-to-year changes in local revenues, enrollment, a series of large donations to Kansas City area charters, and the two-year lag built into HB 1552’s charter payment formula, which means charter funding adjusts after district revenues have already changed.
Third, to no one’s surprise, HB 1552 is likely unsustainable in its current form.
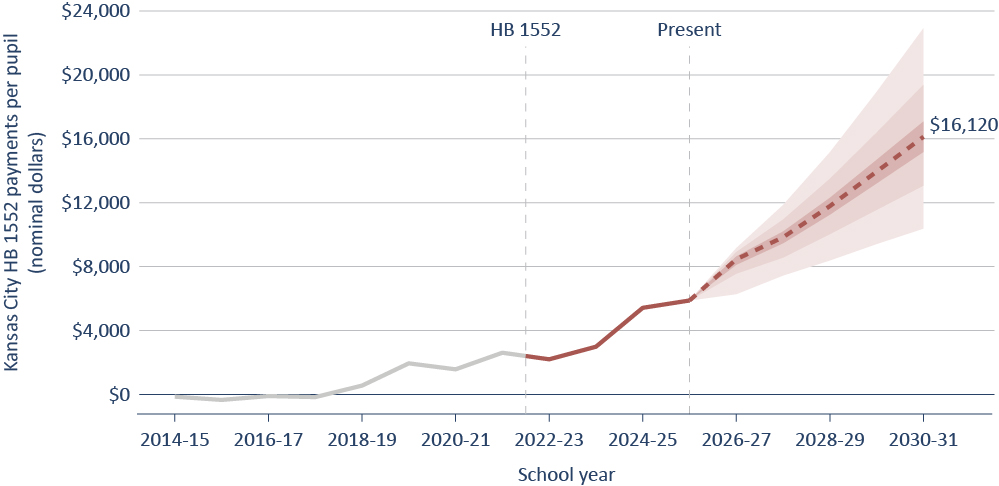
In the authors’ median forecast—the midpoint of their projected outcomes—HB 1552 payments to Kansas City charters will increase from about $6,000 per pupil in 2025–26 to about $16,000 per pupil by 2030–31, a roughly 170 percent increase (Figure F-3). Similarly, payments to St. Louis charters will increase from a little over $6,000 per pupil to roughly $11,000 per pupil.
Figure F-3. HB 1552 payments per pupil are likely to keep growing, particularly in Kansas City.
Panel A: Forecasts of HB 1552 revenue for Kansas City
Panel B: Forecasts of HB 1552 revenue for St. Louis
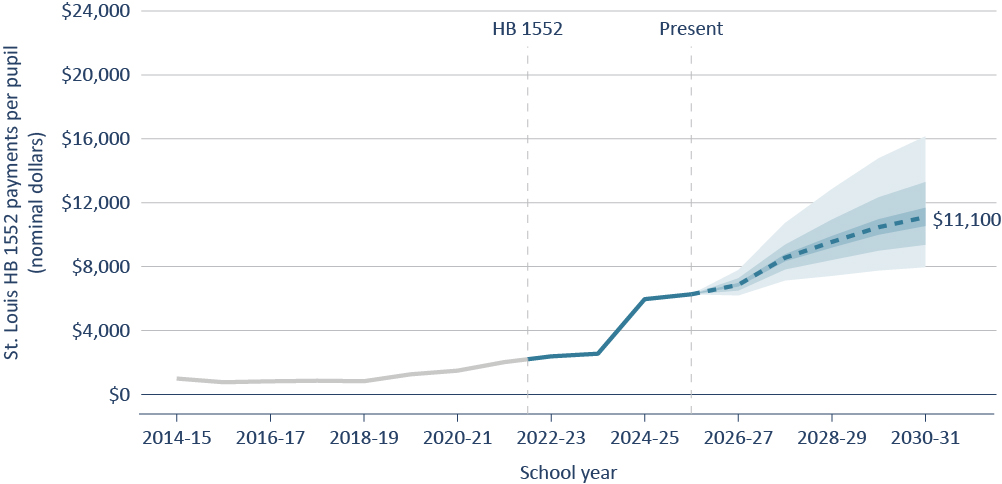
Note: This figure shows the projected growth in HB 1552 payments per pupil for Kansas City and St. Louis if current policies and trends persist. Quantities that exhibit year-to-year variation, such as district and charter enrollment (measured in formula-weighted average daily attendance) and total local tax revenue are modeled stochastically using vector autoregression, which captures both the persistence of each series over time and the dynamic interdependencies among them. Probabilistic forecasts are generated via Monte Carlo simulation.
If you think about it, this makes sense. After all, when district enrollment falls but local revenues don’t, district funding per pupil rises. And the design of HB 1552 leaves the state responsible for making up the gap between what districts and charters receive without requiring districts to pitch in.
In the end, the state must make ever-larger payments to charters just to keep pace, creating an upward spiral that effectively subsidizes all public schools in just two charter-heavy cities while leaving taxpayers and students elsewhere in Missouri to bear more of the cost.
Yes, some of this was foreseeable, though the pace at which it’s occurring is a little surprising. No, Missouri isn’t the only jurisdiction with some version of this problem, though HB 1552’s design makes it easier to see.
So, what is to be done?
If you’re into prediction markets, the smart wager might be that Missouri will respond with yet another Rube Goldberg fix—one that trims the cost of HB 1552 while continuing to hold district schools harmless. But the forecasts above show where that sort of contraption-minded thinking leads.
So, before that becomes the new normal, policymakers in Missouri and other charter-heavy jurisdictions should do the obvious thing, which is also the fair thing: Ensure that local funding follows students to the public schools they actually attend, whether charter schools or district-operated schools. Otherwise, policymakers and charter schools will forever be chasing a moving target.
Introduction
Since their introduction in the early 1990s, public charter schools have become a mainstay of the urban education landscape.[3] Research using admissions lotteries—which allow for the rigorous identification of charter school effects—has found that charters have the potential to improve students’ academic achievement and long-term outcomes such as postsecondary matriculation and civic participation.[4] Most studies that match charter school students to observably similar students in traditional public schools also find positive effects.[5]
These impacts are especially notable given the evidence that charters’ total revenues’ per pupil are, on average, approximately $7,000 lower than those of local traditional public schools in raw terms and about $1,700 lower after controlling for differences in student poverty, English learner status, and special education identification.[6] After all, evidence suggests that increasing school funding can increase student achievement when the money is well spent.[7] So, it stands to reason that equalizing funding between charter and traditional public schools could have significant positive impacts on achievement and other outcomes.
A recent reform to Missouri’s funding formula, known to locals as HB 1552,[8] provides a rare opportunity to test that hypothesis by directing substantial amounts of new revenue to the Show Me State’s historically underfunded charter schools starting in 2022–23. On a per-pupil basis, the law was projected to deliver an additional $2,704 per year to charter schools in St. Louis and an additional $2,419 per year to charters in Kansas City, making it the largest universal funding increase in the history of the charter school movement—that is, the largest funding increase that specifically targeted charters and significantly affected all of a state’s charter schools.
The intent of HB 1552 was to equalize per-pupil state and local revenue between charter and traditional public schools operating in the same city and compensate for structural features of Missouri’s funding formula that had created an expanding revenue gap. Accordingly, this study addresses the following research questions:
1.
How large were district-charter revenue disparities pre-HB 1552? And what explains them?
2.
How much additional revenue did HB 1552 generate for charters? Did it equalize funding?
3.
How much did charters’ expenditures per pupil increase because of HB 1552? And what did they purchase with these dollars?
4.
How has the law affected charter school students’ year-to-year academic growth in English language arts and math?
5.
What are the long-run fiscal implications of HB 1552? Is it sustainable?
To our knowledge, this is only the second study to examine the effects of a discrete funding increase for charter schools specifically (the first, which focused on changes to Ohio charter schools’ funding, was the subject of a 2024 Fordham report by Stephane Lavertu).[9] The present study is also the first to examine the causal effects of a universal funding increase for charters—that is, a funding increase that affected all of a particular jurisdiction’s charter schools.
Background
In 1998, Missouri became the twenty-seventh state to enable the formation of charter schools with the passage of SB 781,[10] which allowed charters to operate within the geographic boundaries of Kansas City Public Schools and St. Louis Public Schools. While subsequent legislation has expanded charters’ footprint to include a handful of smaller districts, the vast majority of the state’s charter schools are still in its two largest cities. The law also allows multiple types of authorizers, including a state entity, universities, and school districts.
Since 1999, when the first Missouri charter school opened in Kansas City, charters in both locations have gradually expanded their enrollments, even as the school-aged populations of Kansas City and St. Louis have shrunk (Figure 1). Consequently, charters now enroll about 51 percent of Kansas City’s public school students and approximately 41 percent of St. Louis’s public school students, giving these two cities some of the country’s highest levels of charter school market share.
Figure 1. Enrollment in Kansas City and St. Louis’s traditional public schools has declined as charter school enrollment has increased.
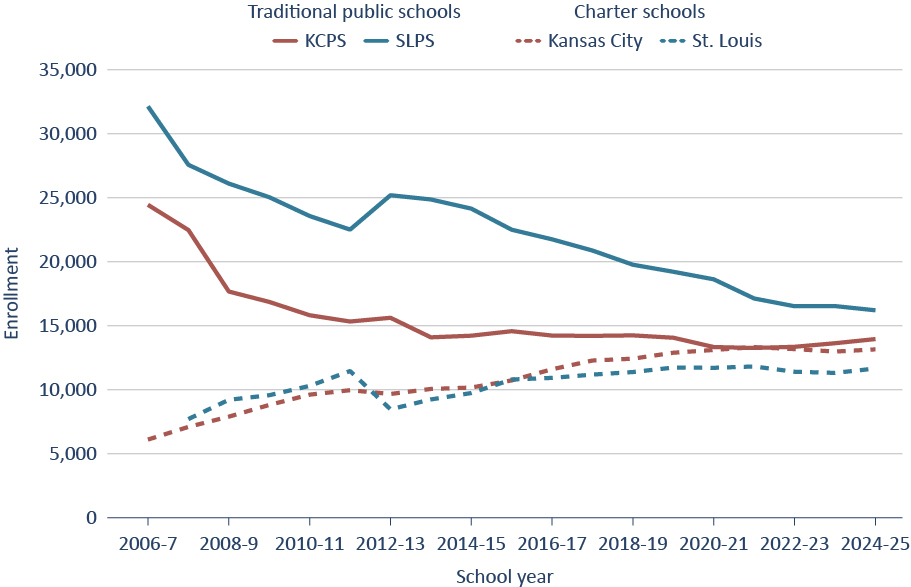
Note: This figure shows trends in total preK-12 enrollment for St. Louis Public Schools, Kansas City Public Schools, St. Louis Charter schools and Kansas City charter schools.
Evaluations of Kansas City and St. Louis charters indicate that they provide promising educational opportunities to the students they serve. For example, a 2023 study found that Missouri charters produced some of the highest levels of academic growth of any charter sector in the country.[11] Similarly, a 2024 study from Mathematica found substantial evidence that attending a Kansas City charter school increased students’ probability of enrolling in a four-year college by “enough to close over 80 percent of the gap in rates of enrollment in four-year college for Black high school seniors.”[12] Reports that use the school-level value-added measures constructed as part of the state’s accountability system often find that both Kansas City and St. Louis area charters are among the highest-performing schools in the state.[13]
Funding Missouri’s Charter Schools
Since 2005, Missouri has funded most of its district K-12 schools with a student-weighted formula,[14] meaning dollars are allocated based on the number and characteristics of enrolled students as opposed to staffing formulas or historical budgets. This formula begins with the state adequacy target—a baseline per-pupil cost assumed sufficient for educating a typical student—which is then multiplied by a regional cost-of-living adjustment (the dollar-value multiplier) and a district’s weighted average daily attendance (FWADA) to arrive at the district’s estimated total funding need. Putative differences in the cost of educating students from specific subgroups—such as multilingual learners and students from high-poverty backgrounds—are incorporated into the FWADA calculation, effectively awarding more state dollars per pupil to districts serving higher concentrations of these students. Finally, a dollar amount known as “local effort”—calculated from assessed property values and intended to reflect each community’s capacity to fund its own schools—is subtracted from a district’s estimated total funding need to yield its state formula payment.
Figure 2 shows the wide range of formula payments (per pupil) that Missouri districts received during the 2024–25 school year. While the average district received $4,571 per pupil, a quarter of districts received less than $3,661 in formula aid and a quarter of districts received payments above $5,259. Five districts, including Kansas City and St. Louis Public Schools, received less than $100 per pupil from the state formula. This wide distribution reflects several idiosyncratic wrinkles in the formula that are also relevant to how the state funds its charter schools.
Figure 2. Missouri’s funding formula accounts for local property wealth, resulting in a wide range of formula payments to traditional public schools.
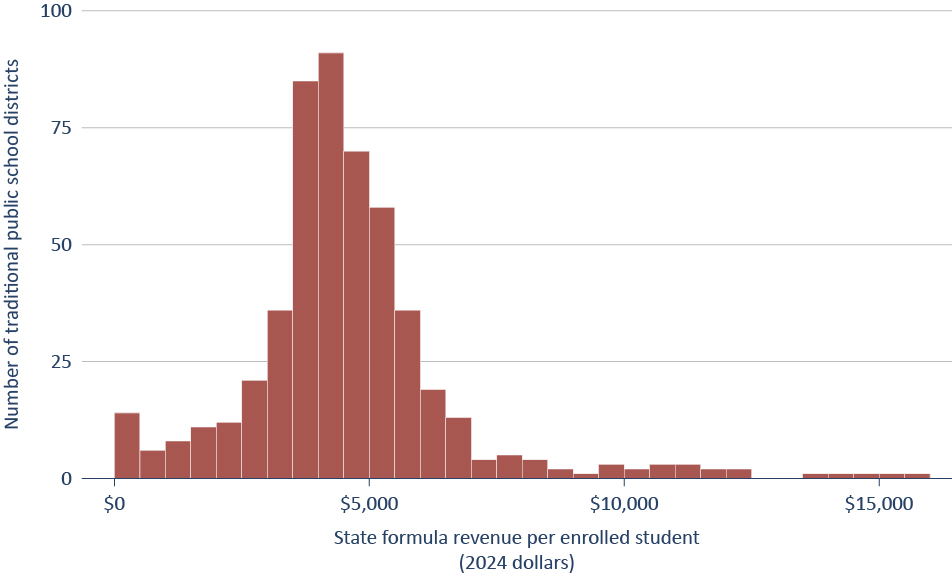
Note: This figure shows the number of traditional public school districts in Missouri that receive state formula revenue per student within specific dollar ranges in 2024. Enrolled students include all students in grades preK-12. Ranges are expressed in 2024 dollars.
First, due to a quirk in Missouri law, local effort is calculated by multiplying a district’s 2005 assessed values by a 34.3 base millage rate (less assessor fees and a few other minor revenue sources)[15] and is thus effectively unchanged from year to year, even as actual property tax collections grow substantially.[16]
Second, a permanent “hold-harmless” provision guarantees that a district’s state revenues will never fall below 2004–05 or 2005–06 levels (whichever is greater).[17] Consequently, nearly a third of Missouri’s districts are effectively “off formula” and thus largely insulated from formula changes that affect most other districts.[18]
Finally, because this funding system was introduced before most of Missouri’s charters became their own local education agencies (LEAs), ensuring equitable funding for charters wasn’t a primary consideration of those responsible for its design. Prior to 2007, the basic mechanisms by which most charters and traditional public schools were funded were effectively the same (though that didn’t necessarily mean that charters were funded equitably). However, once most charters became their own districts, their lack of taxing authority put them at a structural disadvantage relative to traditional public schools, which faced no obligation to share their local revenues.
To address this challenge, the Missouri Department of Elementary and Secondary Education (DESE) attempted to adjust its payments to charters to account for the local revenue they would have received had their host districts distributed a proportional share of the revenues from local property taxes, as required by Missouri law.[19] However, in practice this “pass-through” mechanism underestimated the revenue that traditional public-school districts received because it relied heavily on 2005 property values, which became increasingly divorced from actual property values (Figure 3).[20] As a result, Missouri’s funding formula failed to equalize district and charter schools’ total state and local revenue per pupil.
Figure 3. Assessed property values in Kansas City and St. Louis have increased dramatically since 2005.
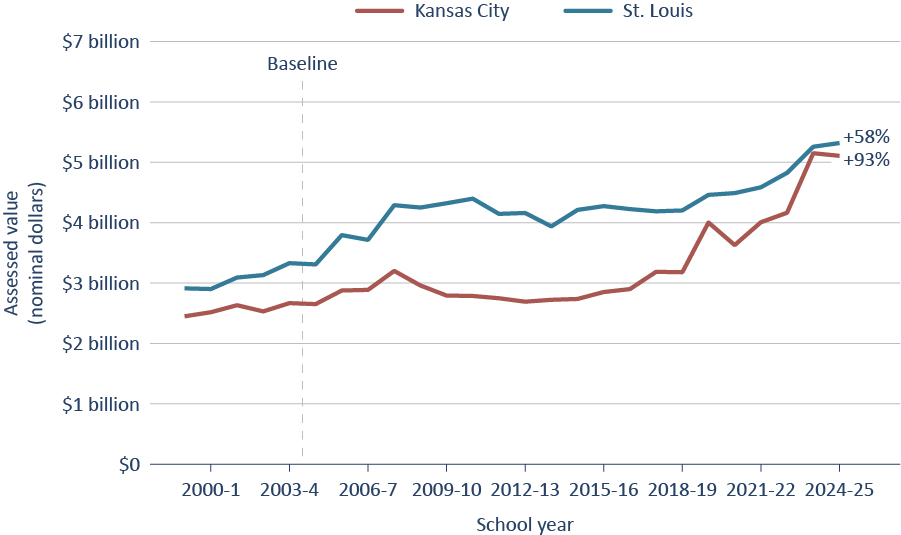
Note: This figure shows trends in the total assessed values of properties in St. Louis and Kansas City. State formula revenues are based on property values in 2005 (the dashed line). The nominal increases in these values that have occurred since that time are shown in parentheses.
HB 1552’s Equalization Effort
In the spring of 2022, to address the funding gaps created by charters’ de facto exclusion from local revenues and the state funding formula’s idiosyncratic reliance on 2005 property values, the Missouri legislature passed HB 1552 over the objection of the state’s teacher unions, responding to the charter sector’s longstanding calls for more equitable funding. However, rather than address the issues with local revenue directly (which would have had far-reaching implications for school funding across the state), lawmakers created a new payment component to be added to the charter school funding formula starting in the 2022–23 school year.
The design of this new component was straightforward: first calculate the total state formula aid and local revenue[21] per pupil that a host district received using the most recent data available, then make up the difference between this amount and what charter schools received under the old funding formula. Yet even this seemingly straightforward approach had an underappreciated complication: because of the timelines for financial reporting and auditing, in practice the state was obliged to use district data from two years prior to the year in which charters received their payments, thus creating a structural lag in how those payments respond to changes in local revenue per pupil.
In plain English, HB 1552 requires the state of Missouri to ensure that charters’ total revenues per pupil equal those of local traditional public schools from two years ago rather than the current school year.
Data and Methods
Data for this report come from several publicly available sources described in detail in Appendix A. Missouri’s Annual Secretary of the Board Reports (ASBRs), which profile traditional public and charter LEAs annually and contain detailed information on revenue sources and expenditures, enable the partial decomposition of aggregate revenues and expenditures for Missouri charter and traditional public schools. Additional information comes from payment transmittals—monthly records that accompany payments from DESE to LEAs, and that include information about how payments for each program were calculated and offer direct insights into the mechanics of HB 1552 and other funding sources. Finally, data on district enrollments, both for all students and for specific subgroups, are available through DESE’s website.
To estimate the causal effect of HB 1552 on charter revenues and expenditures, we use a difference-in-differences design that compares changes in revenue for charter schools to changes in revenue for those traditional public school districts that operated under the standard funding formula. For a detailed explanation of our methods, see Appendix B.
Findings
Finding 1 Prior to HB 1552, Missouri charter schools received about 25–30 percent less in revenues per pupil than traditional public schools in the same city.
Per Figure 4, immediately prior to HB 1552’s passage, Kansas City Public Schools (KCPS) received $26,044 in total revenues per pupil, while charters in the same city received $7,065 (27 percent) less per pupil. Similarly, St. Louis Public Schools (SLPS) received $27,583 while charters in that city received $8,146 (30 percent) less per pupil.
Figure 4. Prior to HB 1552, Missouri charter schools received almost 30 percent less revenue per pupil than traditional public schools in the same city.
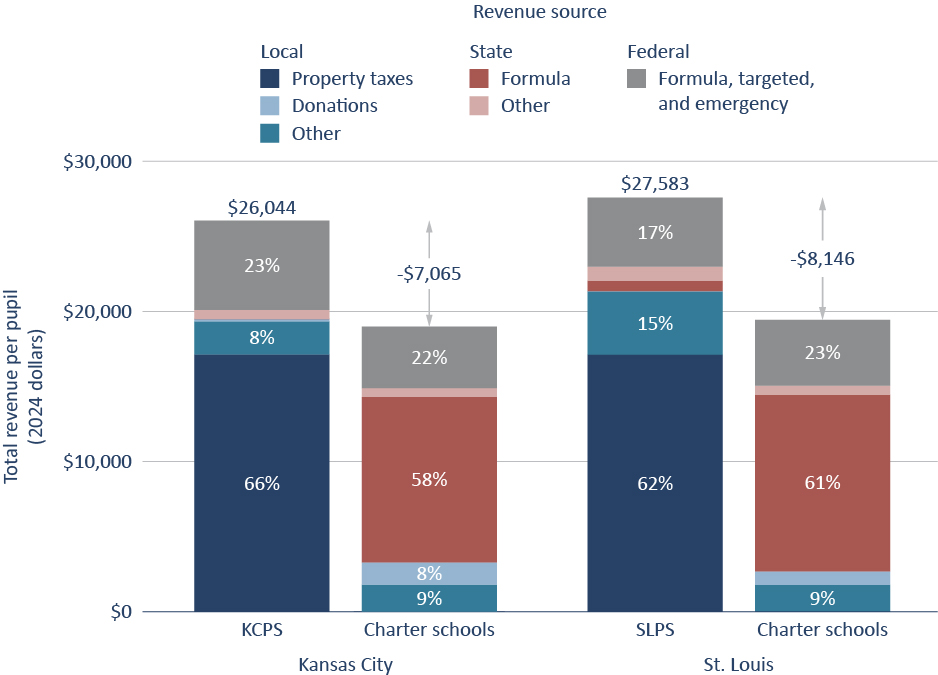
Note: This figure shows per pupil revenues for charter and traditional public schools in St. Louis and Kansas City by source for the 2021–22 school year. Federal revenues include Elementary and Secondary School Emergency Relief (ESSER) dollars in addition to formula grants. “Other state” revenues include funding for transportation, early childhood special education, and adult literacy. “Other local” revenues include monies from the School District Trust Fund (Prop C), the M&M surtax, and the city sales tax (in the case of St. Louis). County revenues that function as property taxes (e.g., state-assessed taxes on railroads and utilities) are included as property taxes while county revenues from fines and penalties are included in “other local.”
Unsurprisingly, given the design of Missouri’s funding formula, there were major sectoral differences in the sources of this revenue. For example, local property taxes accounted for 66 percent of KCPS revenues and 62 percent of SLPS revenues, but charters were effectively excluded from these funds. Other local revenue sources (including at the county level),[22] stem largely from miscellaneous taxes, and appear to favor SLPS over St. Louis charters, but are more equitable in Kansas City. Conversely, the state funding formula accounted for just 0.1 percent of KCPS revenues and 2.5 percent of SLPS revenues. Yet it accounted for 58 percent of Kansas City charters’ revenues and 61 percent of St. Louis charters’ revenues.
Other sectoral differences are also notable, if more modest. For example, donations, which are nearly absent from traditional public school revenues, comprise 8 percent of Kansas City charter revenue and 5 percent of St. Louis charter revenue. Federal revenues, which include ESSER funding, accounted for 23 percent of KCPS revenues and 22 percent of Kansas City charter schools’ revenues, as well as 17 percent of SLPS revenues and 23 percent of St. Louis charter schools’ revenues. However, the gaps shown in Figure 4 are not explained by ESSER or other COVID-19-related relief funds, which were distributed similarly (in per pupil terms) to charters and traditional public schools in both cities. Excluding ESSER funds, the total revenue gap in Kansas City shrinks by approximately $200 per pupil but grows by nearly $900 per pupil in St. Louis.
Accounting for all federal revenues, as well as revenues from the sale of bonds and other financial transactions, does reduce the magnitude of funding gaps, especially in Kansas City. Importantly, this decline is not driven by differences in Title I funding, though these do play a minor role. Rather, charter schools tend to receive less money from various sources, including federally funded ones like Head Start, IDEA, Perkins, and health programs.[23] Still, even if these differences in federal and county revenues are justified, excluding these revenue sources does not eliminate the district-charter funding gaps that existed prior to HB 1552, which were largely attributable to the state’s failure to adequately compensate charters for their exclusion from local revenues.
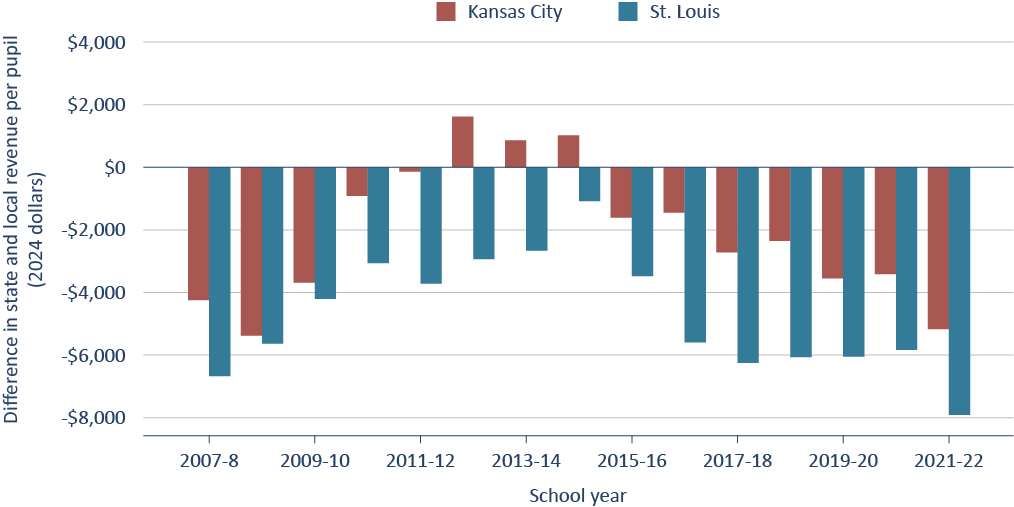
Per Figure 5, by the 2021–22 school year, the absolute gaps between traditional public schools’ total state and local revenue per pupil and that of local charter schools had grown to $5,169 in Kansas City and $7,910 in St. Louis (Panel A). Adjusting for the number of students from low-income families, multilingual learners, and special education students narrows these gaps, especially in St. Louis. However, even this demographically adjusted gap had reached $4,770 in Kansas City and $5,901 in St. Louis (Panel B).
Immediately prior to HB 1552’s passage, Kansas City Public Schools received $20,067 in state and local funding per pupil, while St. Louis Public Schools received $22,963. In other words, even after excluding both federal and financing revenues and accounting for differences in observable student characteristics typically associated with funding differences, charters in Kansas City faced a funding gap of at least 24 percent, while those in St. Louis faced a gap of at least 26 percent. Since local revenues include private donations (which tend to favor charters), even this adjusted comparison arguably understates the magnitude of the district-charter funding gap.
Figure 5. Prior to HB 1552, Missouri charter schools received less state and local revenue per pupil than traditional public schools in the same city.
Panel A: Unadjusted Revenue Gap
Panel B: Adjusted Revenue Gap
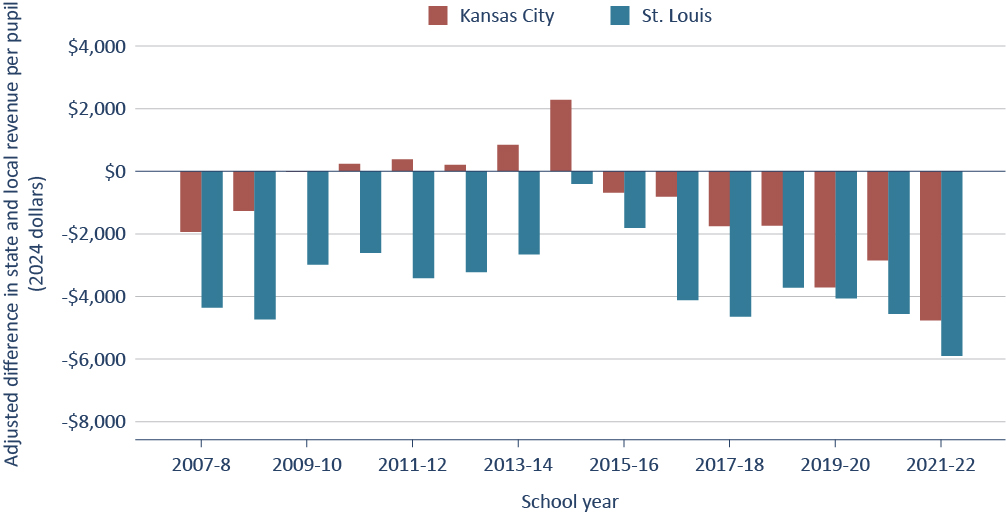
Note: Panel A shows the unadjusted differences in combined state and local revenue per pupil between charter schools and traditional public schools in St. Louis and Kansas City. Panel B shows the differences after adjusting for differences in student characteristics across sectors, including eligibility for free or reduced-price lunch, English learner status, and special education status. All differences are expressed in 2024 dollars.
Finding 2 Despite providing charter schools with an unexpectedly large windfall, HB 1552 has mostly failed to close the district-charter funding gap.
When HB 1552 passed, the analysis conducted by the Missouri legislature indicated that charters would receive between $1,900 and $2,200 per student in additional revenues during the first year of the funding change (i.e., in 2022–23), with modest growth through the 2024–25 school year. However, as Figure 6 illustrates, the law’s actual effects in the most recent year were more than twice as large as initially projected, thanks to the stark growth in HB 1552 revenues between 2022–23 ($1,822) and 2024–25 ($4,696), which an analysis of payment records from the 2025–26 school year suggests is likely to continue. The substantial increase in HB 1552 payments is driven largely by the expiration of a pandemic-era hold-harmless provision, which resulted in an abrupt correction to the formula-student component of the funding formula.
Figure 6. HB 1552 increased Missouri charter schools’ state formula revenues per pupil.
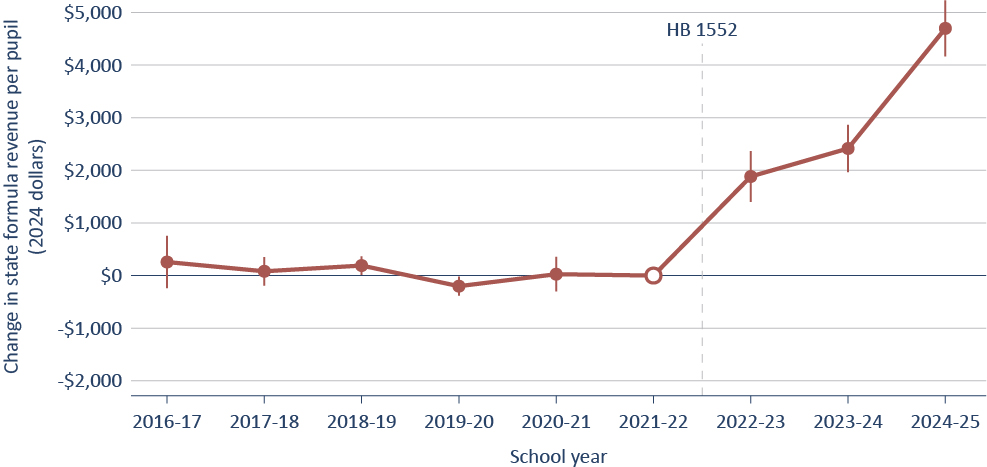
Note: Estimates were generated using an event study difference-in-differences model. Control group consists of Missouri districts that are not subject to the permanent hold-harmless provision established under SB 287, which guarantees that approximately one-third of Missouri districts receive funding based on 2004–05 or 2005–06 levels rather than current formula calculations. Standard errors are clustered at the LEA level to account for serial correlation within units.
Interestingly, although HB 1552 works through the state funding formula, the bill also led to an $864 decline in charters’ local revenues per pupil, much of which is explained by a $447 per pupil decline in local donations to charters. Still, state formula gains far outpaced the decline in local revenues, and charters’ total state and local revenues rose by nearly $4,000 per pupil by 2024–25 (Figure 7).
Figure 7. HB 1552 increased Missouri charter schools’ total state and local revenues per pupil.
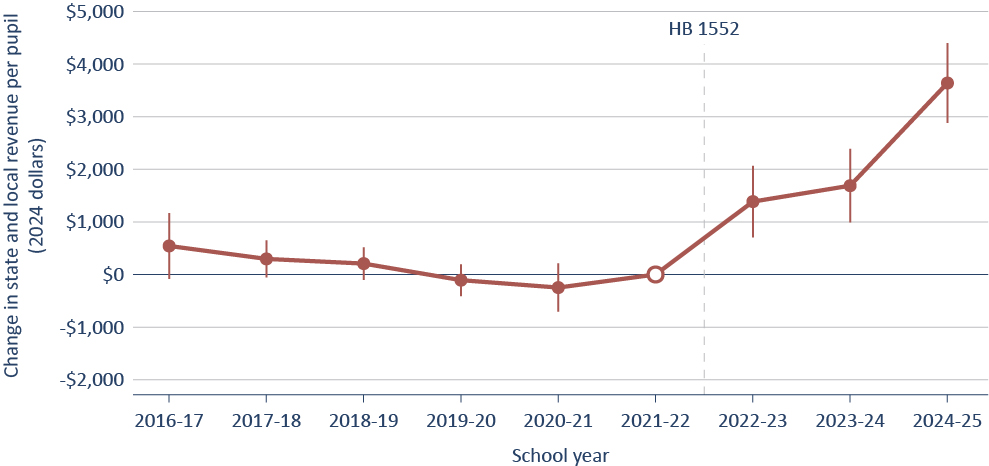
Note: Estimates were generated using an event study difference-in-differences model. Control group consists of Missouri districts that are not subject to the permanent hold-harmless provision established under SB 287, which guarantees that approximately one-third of Missouri districts receive funding based on 2004–05 or 2005–06 levels rather than current formula calculations. Standard errors are clustered at the LEA level to account for serial correlation within units.
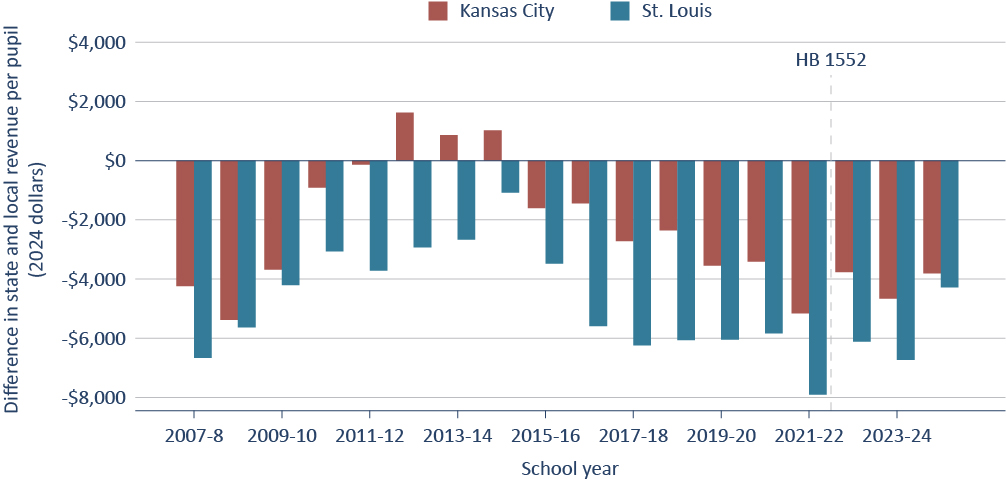
Given the magnitude of this increase, one might expect HB 1552 to have achieved its intended effect—equalizing charter school funding, if not in absolute terms, then at least after adjusting for student demographics. However, as Figure 8 illustrates, that has not been the case. Without adjusting for student demographics, the difference in combined state and local revenues decreased from $5,169 to $3,815 in Kansas City and from $7,910 to $4,289 in St. Louis. Adjusting for student demographics, the combined funding gap in Kansas City grew from $4,770 to $5,189 while shrinking from $5,901 to $4,277 in St. Louis. While these gaps would have been substantially larger had HB 1552 not been passed, the limited progress on funding equity indicates that HB 1552 has not achieved its goals.
Figure 8. HB 1552 has mostly failed to close Missouri’s district-charter funding gap.
Panel A: Unadjusted Revenue Gap
Panel B: Revenue Gap Adjusted for Student Demographics
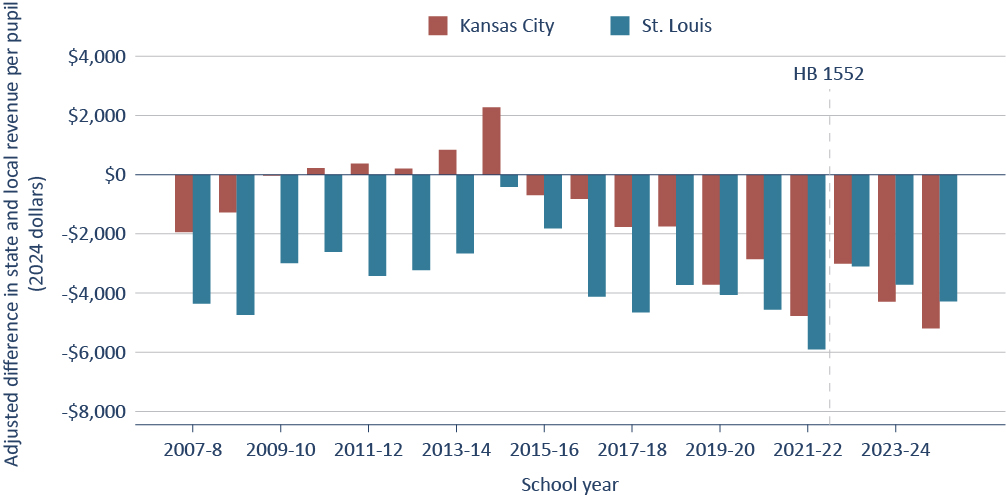
Note: Panel A shows the unadjusted differences in combined state and local revenue per pupil between charter schools and traditional public schools in St. Louis and Kansas City. Panel B shows the differences after adjusting for differences in student characteristics across sectors, including eligibility for free or reduced-price lunch, English learner status, and special education status. All differences are expressed in 2024 dollars.
The failure of HB 1552 to equalize funding stems from several factors. First, long-standing and continued enrollment declines in traditional public school districts, alongside increases in property tax revenues, mean that HB 1552 payment amounts—as specified by the law—will forever be chasing a moving target. Each student who leaves the traditional public school system (to a charter or otherwise) raises that district’s per-pupil revenue because the district retains nearly all local property tax revenues. Enrollment declines in traditional public schools lead to increased per-pupil funding for both the traditional public school and, through HB 1552’s payment calculation, charter schools. Figure 9 shows this continued growth in per-pupil local revenues, which is largely due to increasing per-pupil property tax revenue.
Figure 9. Local revenues per pupil for KCPS and SLPS increased rapidly as HB 1552 went into effect.
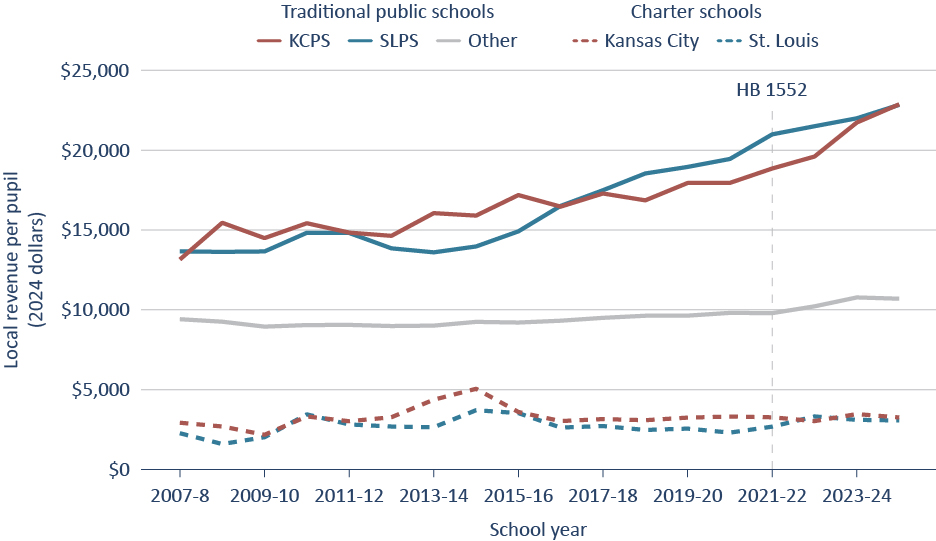
Note: This figure shows trends in local revenues per pupil for St. Louis Public Schools, Kansas City Public Schools, other traditional school districts in Missouri, St. Louis charter schools, and Kansas City charter schools.
Second, the weighted enrollment figure used to calculate HB 1552 payments (FWADA) does not reflect actual student enrollments in that same year. Not only do data reporting timelines limit the state to using FWADA figures from two prior years, but FWADA itself experiences a structural lag. While FWADA is constructed from several factors, the largest factor is weighted student enrollment from the current year or either of the two previous years. As a result, a “structural lag” of up to four years is built into the HB 1552 payment calculation. The effects of the structural lag are especially pronounced in 2024–25 when a temporary pandemic-era hold-harmless provision expired.
When this provision expired, the FWADA figures used in determining per-pupil district revenues (i.e., the target that HB 1552 was intended to match) decreased by 6.5 percent in Kansas City and 20.1 percent in St. Louis, leading to HB 1552 payments increasing substantially, as shown in Figures 6 and 7. Though future changes are likely to be less dramatic, the structural lag in HB 1552 payment calculations will persist so long as enrollment declines in Kansas City and St. Louis Public Schools continue alongside the all-but-guaranteed increase in property wealth.
Consequently, despite the larger-than-expected infusion of state dollars, as of 2024–25 charter schools in Kansas City and St. Louis still received about 20 percent less in total revenues per pupil than traditional public schools in each city—a significant improvement over the nearly 30 percent gap that existed before HB 1552, but not the funding equity that state legislators intended (Figure 10).
Figure 10. Despite the passage of HB 1552, charter schools still receive about 20 percent less revenue per pupil than traditional public schools in the same city.
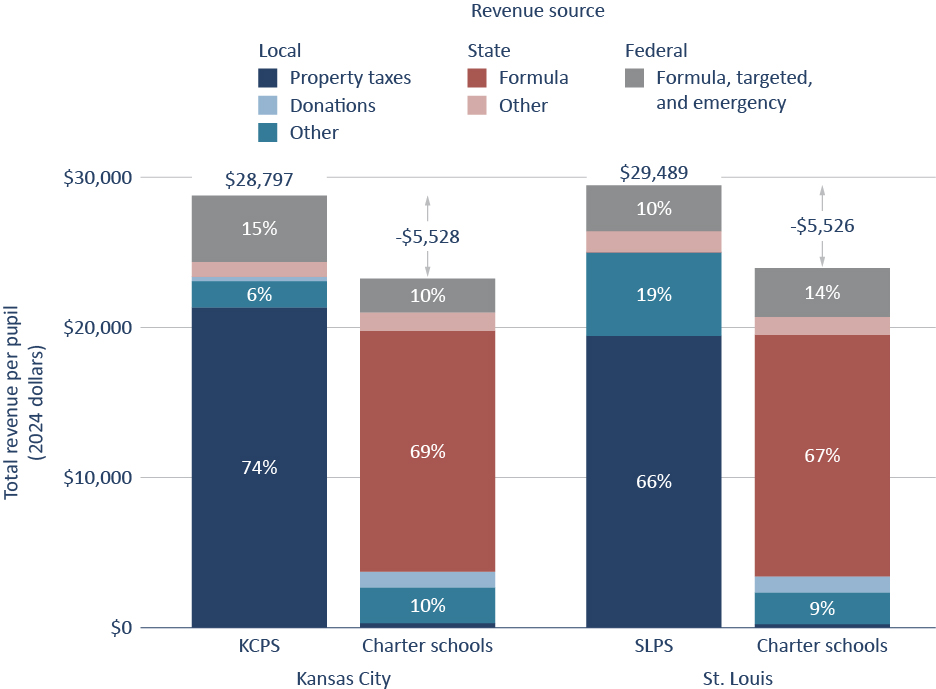
Note: Figure shows per pupil revenues for charter and traditional public schools in St. Louis and Kansas City by source for the 2024–25 school year. Federal revenues include Elementary and Secondary School Emergency Relief (ESSER) dollars in addition to formula grants. “Other state” revenues include funding for transportation, early childhood special education, and adult literacy. “Other local” revenues include monies from the School District Trust Fund (Prop C), the M&M surtax, and the city sales tax (in the case of St. Louis). County revenues that function as property taxes (e.g., state-assessed taxes on railroads and utilities) are included as property taxes while county revenues from fines and penalties are included in “other local.”
In short, despite providing charters with a larger-than-expected windfall, HB 1552 has not overcome the structural inequities of Missouri’s funding formula, which continue to channel rapidly rising per-pupil local revenues exclusively to the state’s traditional public schools.
Finding 3 Charters have used their HB 1552 funds for various purposes, including hiring additional teachers and support staff.
On average, Missouri charter schools’ total expenditures[24] per pupil increased by $2,429 relative to those of traditional public schools in the three years after the passage of HB 1552—roughly matching the $2,239 increase in revenues per pupil that charters experienced across those same years. In other words, the data show that charters have translated the bulk of their HB 1552 revenue gains into increased spending rather than accumulating reserves.
Per Figure 11, this money was put to various uses. Specifically, about 36 percent went to instruction (e.g., hiring new teachers or raising salaries for existing ones), another 25 percent to services that support students and teachers (counselors, nurses, psychologists, social workers, instructional coaches, curriculum development, library services), and about 39 percent to administration and operations (network and/or building administrators, transportation, security, food, business services, and other non-instructional spending).
Figure 11. Charter schools used most of their HB 1552 funds for salaries and benefits.
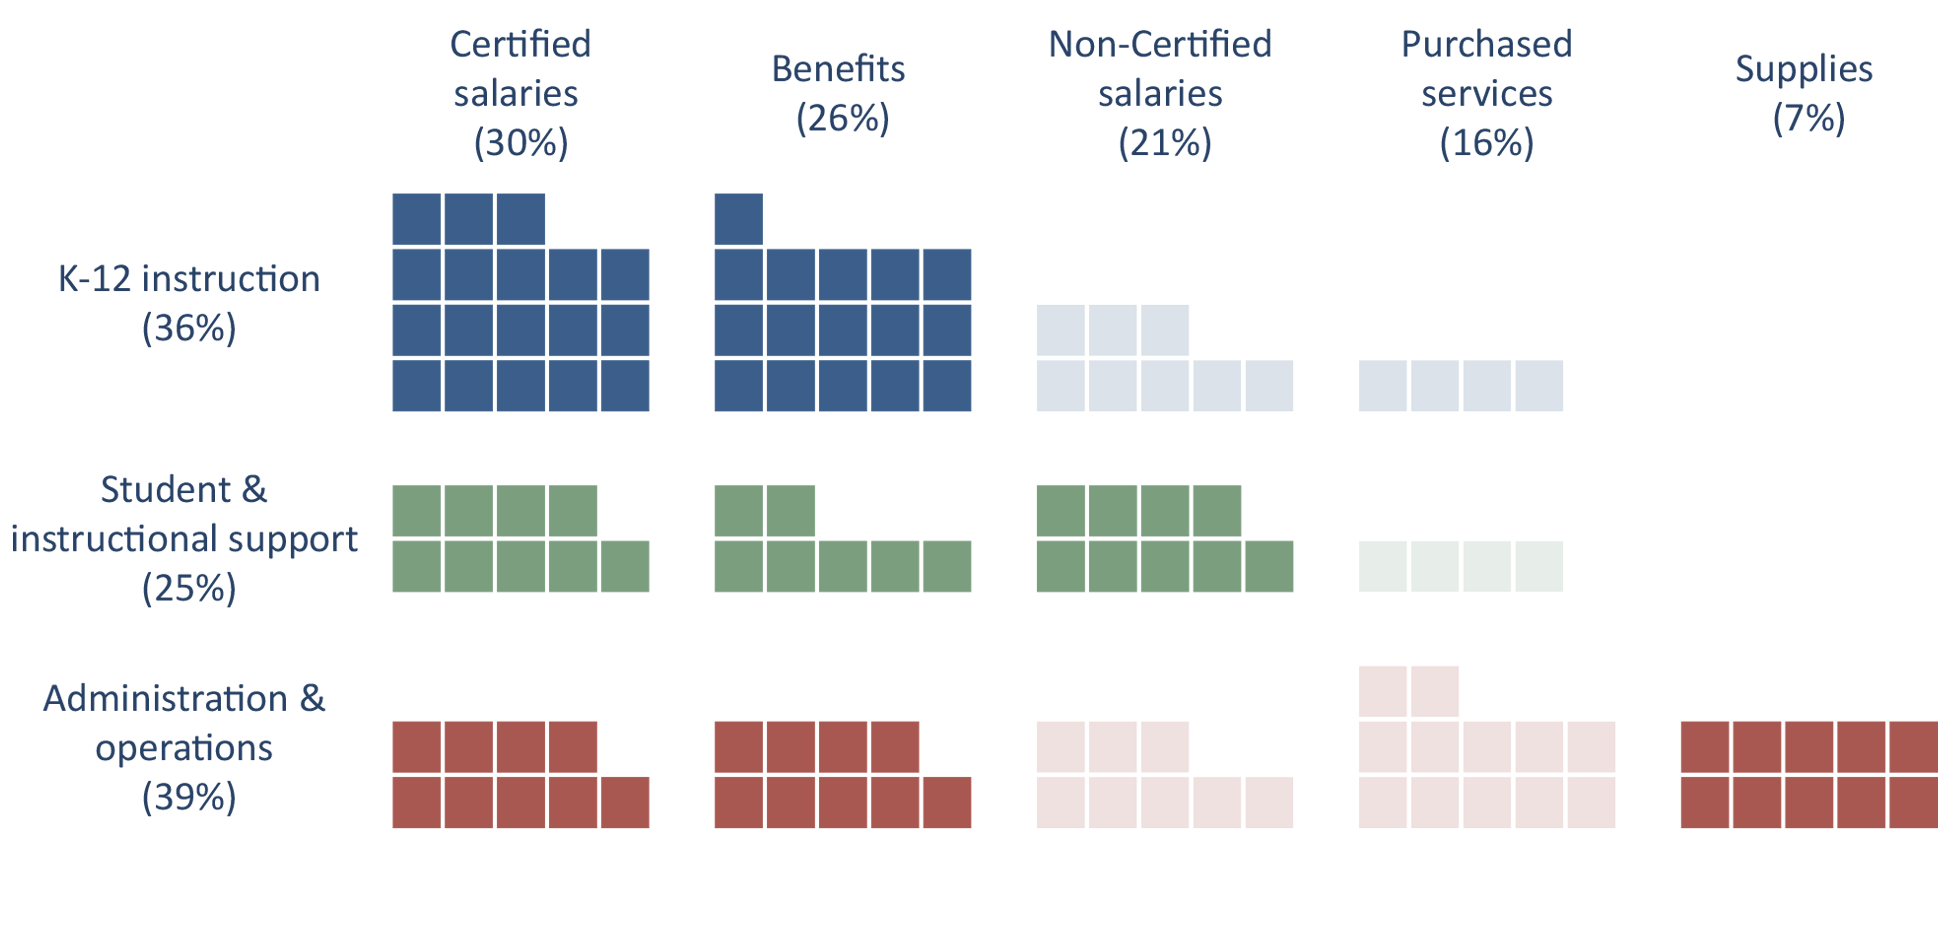
Note: This figure shows the estimated effects of HB 1552 on Missouri charter schools’ net current expenditures, excluding debt service and capital outlay. Each square represents $20 per pupil of the estimated HB 1552 effect. Solid tiles indicate effects significant at the 90% confidence level. Blank cells indicate near-zero and statistically insignificant changes. Estimates were generated using a difference-in-differences model that controls for differences in districts’ exposure to concurrent ESSER funding shocks. Standard errors are clustered at the LEA level to account for serial correlation within units.
Across all three categories, about three-quarters of additional spending went to personnel—certified salaries, non-certified salaries, and benefits—as opposed to goods and services. Specifically, certified salaries increased by $726 per pupil, non-certified salaries increased by $504 per pupil, and benefits increased by $637 per pupil.
Notably, while salaries and benefits accounted for 95 percent of the increase in instructional spending and 86 percent of the increase in spending on support services, they accounted for just 54 percent of the increase in administrative and operational spending. In other words, about 20 percent of the additional funding that charters received was devoted to hiring or better compensating individuals in administration and/or operations such as superintendents and assistant superintendents, principals and assistant principals, program directors and coordinators, and secretaries, while about 20 percent went to administrative and/or operational items that weren’t directly tied to salaries or benefits such as transportation, building services, and food services.
To assess whether the increased expenditures in K-12 Instruction and Student & Instructional Support categories are explained by new hires or increasing salaries for existing staff, we examine changes in the number of full-time equivalent (FTE) staff per 100 students (Figure 12). On average, charters hired about one new teacher and roughly 0.75 new non-teachers per 100 students. However, there was no significant increase in administrative FTEs or student support services FTEs (though the latter did experience a temporary increase).
Figure 12. As a result of HB 1552, Missouri charter schools have added approximately one new teacher for every one hundred students.
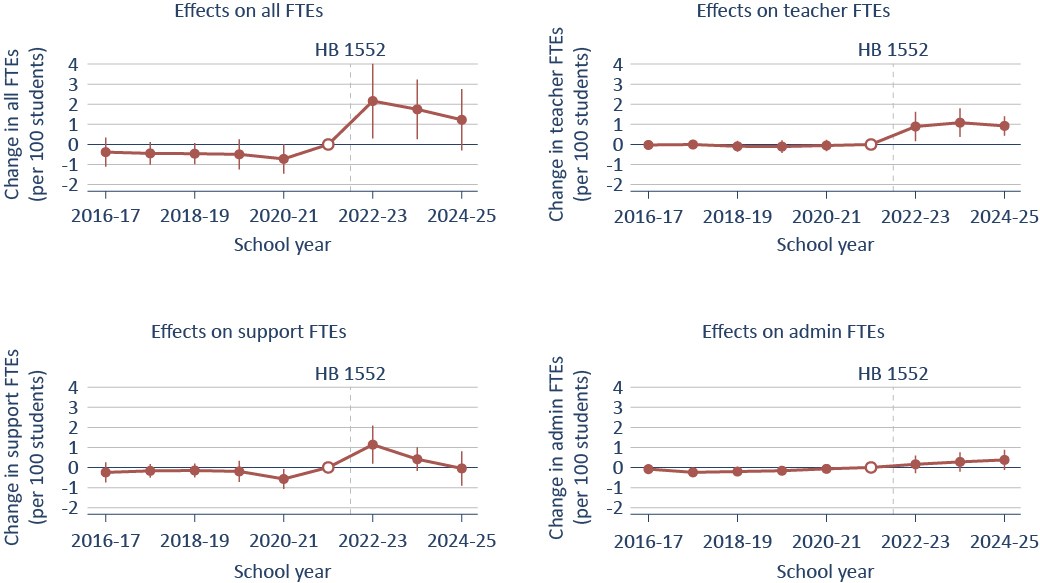
Note: This figure shows the estimated effects of HB 1552 on the number of full time-equivalent workers employed by Missouri charter schools per 100 students. Estimates were generated using an event study difference-in-differences model. Standard errors are clustered at the LEA level to account for serial correlation within units.
Given an expenditure increase of $687 per pupil for certified salaries and benefits and an average charter teacher salary of $54,998 (in constant 2024 dollars), back-of-the-envelope math suggests that the increase of approximately one teacher FTE per 100 students explains about 78 percent of the increase in instructional expenditures, with the remaining 22 percent explained by raises for existing staff (e.g., approximately $1,500 per teacher).
Consistent with this pattern, other publicly reported data show that the average teacher salary in charter schools has increased by approximately $2,366 since HB 1552 was passed (Figure 13), while average teacher experience has increased by approximately one year (Figure 14). In other words, in addition to allowing charter schools to hire additional teachers, HB 1552 has increased salaries for charter school teachers and reduced teacher turnover in the charter sector.
Figure 13. Salaries of Missouri charter school teachers have increased because of HB 1552.
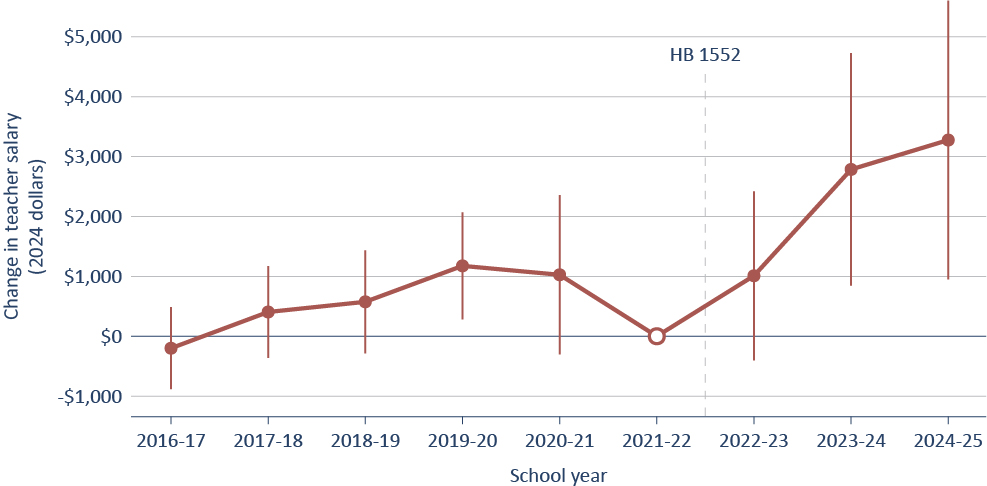
Figure 14. As a result of HB 1552, the average Missouri charter school teacher has approximately one more year of teaching experience.
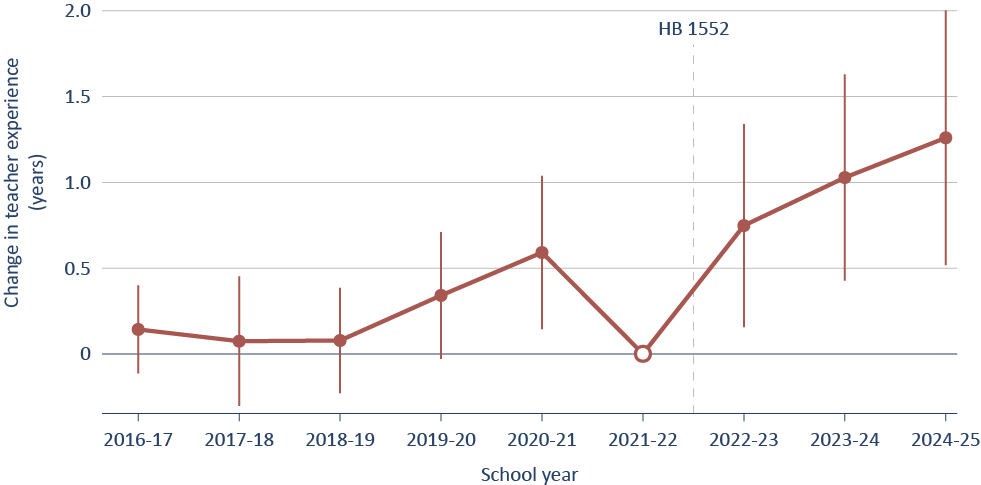
Note: Figures 13 and 14 show the estimated effects of HB 1552 on the average salary and experience of teachers in Missouri charter schools. Estimates were generated using an event study difference-in-differences model. Standard errors are clustered at the LEA level to account for serial correlation within units.
Notably, the estimated increase in charter school teachers’ pay ($2,366) is larger than the typical pay increase that a Missouri charter school teacher might expect to receive for gaining one year of experience, implying that the increase in average teacher salary may be driven by a combination of increased retention and increased compensation for teachers with a given level of experience.
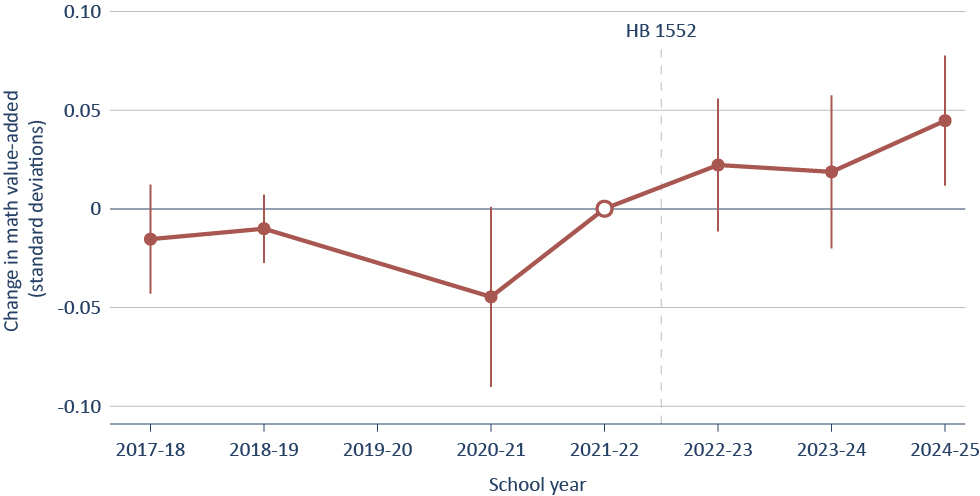
Finding 4 The additional funding provided by HB 1552 has boosted charter schools’ math value-added but not their ELA value-added.
Per Figure 15, by the end of the 2024–25 school year, HB 1552 had increased school-level value-added in mathematics by approximately 0.03 standard deviation units per year (Panel A). Roughly speaking, this effect is equivalent to moving a school at the 50th percentile of mathematics instruction quality to the 59th percentile, a potentially meaningful gain. In contrast, there was no statistically significant effect on ELA value-added during the study period (Panel B).
Figure 15. The additional funding provided by HB 1552 has boosted charter schools’ math value-added but not their English language arts value-added.
Panel A: Effects on math value-added
Panel B: Effects on English language arts value-added
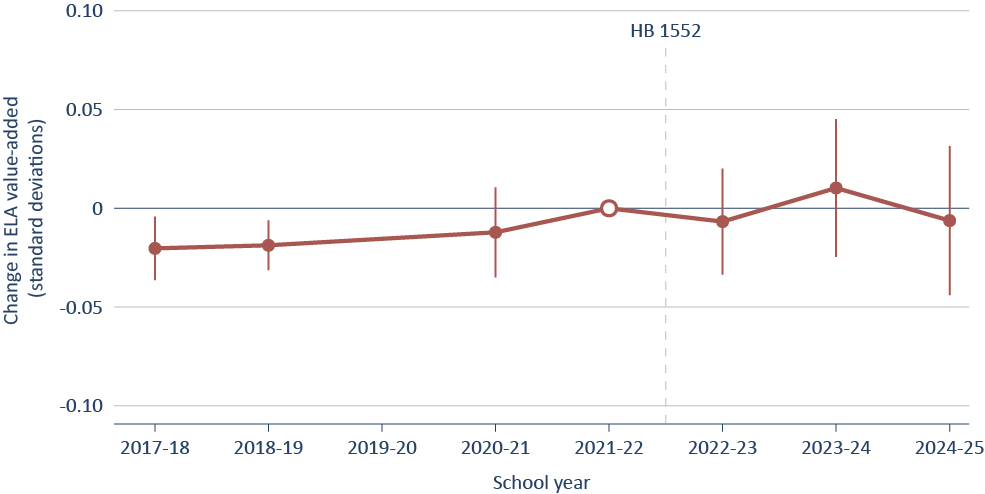
Note: This figure shows the estimated effects of HB 1552 on the average math and ELA value-added of Missouri charter schools. Estimates were generated using an event study difference-in-differences model. School value-added unavailable for 2019–20 due to pandemic testing cancellations. Standard errors are clustered at the LEA level to account for serial correlation within units.
Finding 5 As currently designed, HB 1552 is likely fiscally unsustainable.
The larger-than-projected size of HB 1552 payments and their continued upward trajectory raise urgent questions about HB 1552’s fiscal sustainability. And because HB 1552 specifies exactly how payments are calculated, it is possible to forecast future payment amounts as a function of a few key quantities, such as local revenues and district and charter school enrollment.
The forecasts presented here assume that the current funding system in Missouri will remain unchanged through the end of our prediction period (2030–31). And of course, it is impossible to predict housing prices and student enrollment precisely. Accordingly, we adopt a simulation approach that produces payment estimates across a range of plausible scenarios (for more details, see Appendix B).
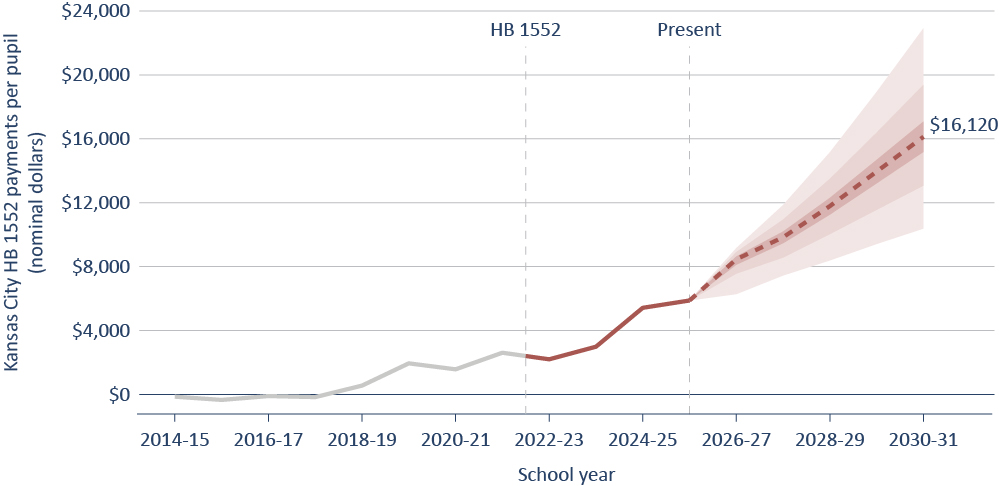
Figure 16 displays the results of this exercise for Kansas City (Panel A) and St. Louis (Panel B). For each location, the dashed line represents the median forecast, while the shaded areas represent the middle 20, 60, and 90 percent of simulated scenarios. Importantly, the gray line to the left of HB 1552 implementation shows what payments would have been had the law been enacted earlier—not what they actually were—making the trends in the law’s effects more transparent and difficult to dispute.
Per the figures, HB 1552 payments per pupil are on an upward trajectory, particularly in Kansas City, where they increase from about $6,000 per pupil in 2025–26 to about $16,000 per pupil by 2030–31 in the median forecast—an increase of roughly 170 percent. In St. Louis, payments increase from a little over $6,000 per pupil to roughly $11,000 per pupil by 2030–31 in the median forecast—an 80 percent increase.
Figure 16. HB 1552 payments per pupil are likely to keep growing, particularly in Kansas City.
Panel A: Forecasts of HB 1552 revenue for Kansas City
Panel B: Forecasts of HB 1552 revenue for St. Louis
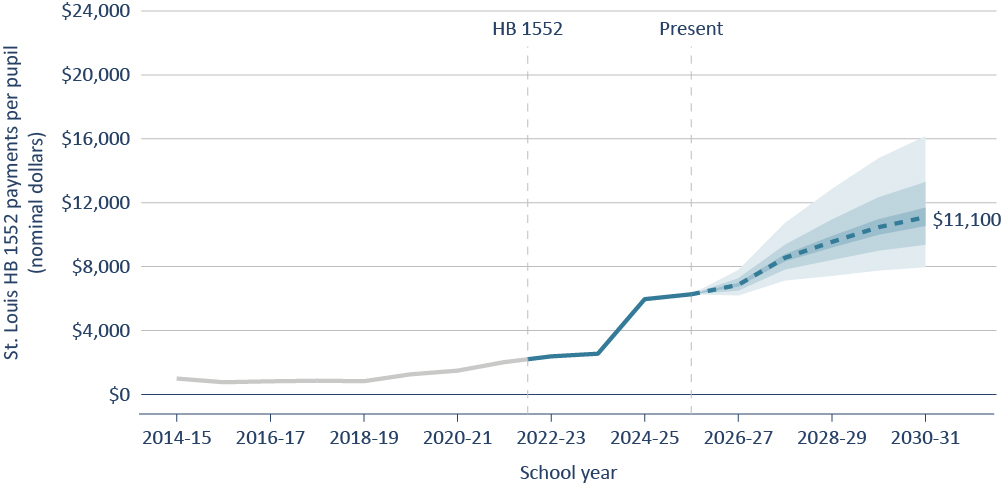
Note: This figure shows the projected growth in HB 1552 payments per pupil for Kansas City and St. Louis if current policies and trends persist. Quantities that exhibit year-to-year variation, such as district and charter enrollment (measured in formula-weighted average daily attendance) and total local tax revenue are modeled stochastically using vector autoregression, which captures both the persistence of each series over time and the dynamic interdependencies among them. Probabilistic forecasts are generated via Monte Carlo simulation.
Unsurprisingly, the primary driver of this growth is the relentless increase in host districts’ local revenues per pupil (Figure 17). After all, so long as property tax revenues continue to increase and district enrollment continues to decline, the amount of local dollars per student will increase, mechanically widening the district-charter funding gap that HB 1552 payments are intended to close. Indeed, even if revenues from property taxes plateau, simple arithmetic implies that both Kansas City Public Schools and St. Louis Public Schools will experience increasingly large gains in local revenue per pupil due to long-standing trends in enrollment if they are permitted to keep all their local revenues as the number of enrolled students dwindles. In the median forecast, local revenues per student grow more quickly in Kansas City Public Schools than in St. Louis Public Schools because the former experiences both a faster increase in local revenues and a somewhat steeper decline in expected enrollment. Collectively, the projections raise serious concerns about the fiscal sustainability of HB 1552 in its current form.
Figure 17. KCPS and SLPS local revenue per pupil is likely to keep growing.
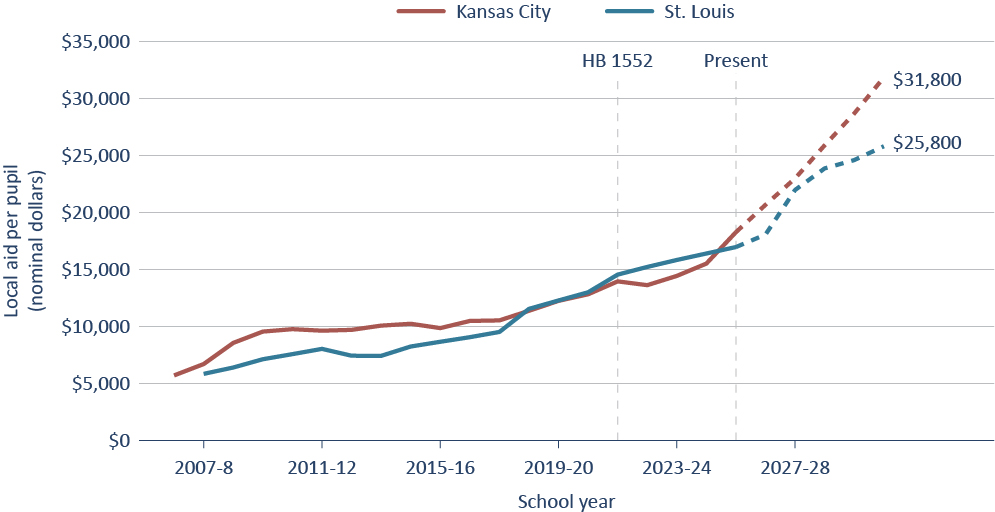
Note: This figure shows the historical and projected local aid per pupil for the Kansas City and St. Louis school districts if current policies and trends remain in place. Projections are generated using vector autoregression and Monte Carlo simulation. For readability, only the median of the simulated forecast for each city is shown (dashed lines). Solid lines show observed history. Per-pupil amounts are computed within each simulation draw by dividing total local revenue by district enrollment.
Discussion
Despite the fact that charter schools now educate about half of the students in Kansas City and St. Louis, nearly all local revenues in both cities still flow to traditional public schools, where total per-pupil revenues now approach $30,000, exceeding those of nearly every other LEA in the state. Consequently, now that the state is required to equalize funding for district and charter schools, allowing traditional school districts in these cities to retain full control over nearly all local dollars means that per-pupil spending in both district and charter schools will continue to rise—as will the state’s equalization costs.
To address this challenge, the state has three options:
- allow districts to retain all local funding even if large increases in per-pupil revenue will follow, meaning that state payments to charters will consume an increasing share of state education appropriations;
- cap state payments in ways that would widen the funding disparities HB 1552 was designed to eliminate; or
- require districts to pool their local and state revenues with charter schools on an equitable basis.
Of these three options, the third seems the most sensible. Instead of responding to this report with another complex and potentially expensive patch-job, the state should simply require county collectors to set aside a proportional amount of property tax receipts for the districts and charters. Exceptions could be made for revenue already raised via bond elections and other technical details, but this simple change would obviate the need for any “clawback” mechanisms and put both the state and its two biggest localities on a more sustainable and equitable path moving forward.[25]
*****
Missouri’s experience with HB 1552 offers a cautionary lesson for states seeking to make charter school funding more equitable: temporary fixes can deliver large and welcome funding increases, but they cannot fully resolve inequities rooted in flawed school finance systems. In Kansas City and St. Louis, HB 1552 has provided substantially more funding than expected, helped charter schools hire and retain teachers, and boosted math achievement. Yet it has not achieved true funding parity, and its costs are likely to keep rising as district enrollment declines and local property tax revenues grow. The path forward is not another temporary workaround, but a simpler and more durable approach that treats students equitably regardless of the public school they attend—by ensuring that local as well as state dollars follow them on a fair basis.
Appendices
Data for this report come from several publicly available sources. The first is Missouri’s Annual Secretary of the Board Reports, which traditional public and charter LEAs submit annually and which contain detailed information on revenue sources and expenditures. We supplement these data with payment transmittals—monthly records that accompany payments from the Missouri Department of Elementary and Secondary Education to LEAs and that include information about how payments for each program were calculated and offer direct insights into the mechanics of HB 1552 and other funding sources. Below, we provide additional information on each of these data sources.
Annual Secretary of the Board Reports
Annual Secretary of the Board Reports (ASBRs) constitute the majority of data used in our analyses. These reports are both statutorily required and routinely audited under Missouri Revised Statutes § 162.821. ASBRs are publicly available through a web portal and provide detailed information about a district’s revenues, expenditures, and fund balances/transfers by year for nearly all Missouri LEAs from the 2000–01 through 2024–25 school years. The format of these reports closely mirrors that proposed by the National Center for Education Statistics' Financial Accounting for Local and State School Systems handbook and organizes revenues and expenditures across several dimensions: fund (i.e., restrictions on the use of the money), source (where the money originated, e.g., 5311 – basic formula), function (activity being performed, e.g., 2133 – dental services for students), object (what is being purchased; e.g., 6100 – salaries), and project (specific grant or initiative).
While ASBRs are available upon request as district-by-year files, DESE does not publish a consolidated data file. So, to build an analytic dataset, we used automated web-scraping techniques to download and process 13,144 district-by-year reports. We verified data accuracy by comparing aggregated amounts from our compiled ASBR files against figures reported independently on DESE’s website (e.g., assessed valuation, total revenue, total expenditures).
From these compiled ASBRs, we directly observe districts’ revenues across multiple years and nearly 200 separate revenue source codes. However, for the purposes of this project, we specifically focus on revenue sources likely to be impacted by HB 1552, such as the subtotal for all state revenue sources as well as for the basic formula (i.e., the path by which HB 1552 payments are made). We additionally observe district-by-year expenditures across approximately 250 separate function codes and seven object codes (certified salaries, non-certified salaries, employee benefits, purchased services, supplies, capital outlay, and other objects).
Payment Transmittals
As noted, payment transmittals are publicly available records that accompany disbursements from the Missouri Department of Elementary and Secondary Education to individual LEAs. Each transmittal is marked with a revenue code (corresponding to revenue codes in the ASBRs), deposit date, and EFT transaction number. We focus our analysis of these transmittals on those for the basic formula (revenue code 5311). To highlight the structure of these records as well as how we use them in understanding HB 1552 payments, we reproduce a portion of the basic formula payment transmittal from June 21, 2023 for a St. Louis area charter in Table A1. The red box highlights calculations relevant to charter school funding (lines 18-32).
Table A1. Sample Payment Transmittal
KIPP St. Louis – June 2023 Payment Transmittal
Basic Formula – State Monies
| … | ||
| Charter Schools Calculation | ||
| 18 | Local Effort per Weighted ADA < 3.43 (Line 6 / Line 1) | $3,829.43 |
| 19 | Local Tax Revenues > 3.43 per Weighted ADA | $1,786.51 |
| 20 | Debt Payment Amount per Weighted ADA | $0.00 |
| 21 | Total Basic Formula Payment per Weighted ADA (adjusted line 17 / Line 1) | $3,717.06 |
| 22 | Local Effort Deduction for District | $3,250.56 |
| 23 | DISTRICT Amount per WADA (Line 21 - Line 22) | $466.50 |
| 24 | Charter Amount per WADA (Line 21 + Line 18 + Line 19 - 20) | $9,333.00 |
| 25 | FWADA for the District | 22,403.13 |
| 26 | FWADA for the Charters | 12,717.03 |
| 27 | Local Aid for the District | $251,558,366.93 |
| 28 | Local Aid per FWADA for the District (Line 27 / Line 25) | $11,228.71 |
| 29 | Local Aid Passed to Charters ((Line 18 + Line 19) x (Line 26)) | $71,418,155.20 |
| 30 | Total Local Aid and Basic Formula Paid to the District | $262,009,489.80 |
| 31 | District Amount per WADA (Line 21 - Line 22) | $466.50 |
| 32 | Charter Payment per FWADA | $11,695.22 |
| Charter Detail: | ||
| 33 | Annualized Amount (2,756.1380 * Line 32) | $32,233,640.26 |
| 34 | Less Sponsor Payment | $168,014.69 |
| 35 | Net Charter | $32,065,626.00 |
| … |
Prior to HB 1552, the charter portion of these transmittals ended at line 24 (charter amount per WADA). Following the implementation of HB 1552, lines 25-32 were added. The calculations here mirror those in an October 2022 memo from DESE and highlight the mechanisms by which HB 1552 payments are calculated. Note that the difference between lines 32 and 24 ($2,362.22) mirrors almost exactly the amount, per FWADA, that DESE anticipated adding to St. Louis charters’ basic formula payment at the beginning of the year. The difference of $184.18 is entirely attributable to St. Louis charters reporting a lower total FWADA in June of 2023 than in October of 2022.[26] The highlighted section of this transmittal is the same for all charters in St. Louis during the 2022–23 school year, matching our earlier note that HB 1552 payments are uniform within city and year.
An advantage of using these transmittals over ASBRs to understand HB 1552 payments is that the amount of additional revenue attributable to the reform is directly stated and does not need to be estimated. Another advantage is that these transmittals are available in real time. For example, at the time of writing, payment transmittals through June 2026 were available. This allowed us to monitor the financial impacts of HB 1552 in near real time for the 2025–26 school year, as well as directly observe the magnitude of these payments for the past three years. Table A2 documents our calculations of HB 1552 payments by city for the 2022–23 through 2025–26 school years.
Table A2. HB 1552 Calculated Payments from Payment Transmittals
| Year | Total per FWADA | Local effort and formula per FWADA | Difference (HB 1552) |
District FWADA | Charter FWADA | HB 1552 Payments to Charters |
|---|---|---|---|---|---|---|
| Kansas City | ||||||
| 2022–23 | $10,491.98 | $8,299.44 | $2,192.54 | 17,407.40 | 16,197.17 | $35,512,943.11 |
| 2023–24 | $11,308.38 | $8,327.17 | $2,981.21 | 17,346.34 | 16,303.25 | $48,603,411.93 |
| 2024–25 | $13,356.99 | $7,940.80 | $5,416.19 | 16,216.71 | 16,511.75 | $89,430,775.23 |
| 2025–26 | $14,628.30 | $8,751.21 | $5,877.09 | 17,691.72 | 16,994.91 | $99,880,615.61 |
| St. Louis | ||||||
| 2022–23 | $11,695.22 | $9,333.00 | $2,363.22 | 22,403.13 | 12,717.03 | $30,040,422.61 |
| 2023–24 | $11,993.96 | $9,445.08 | $2,548.88 | 22,634.58 | 12,986.49 | $33,101,004.63 |
| 2024–25 | $14,699.44 | $8,735.37 | $5,964.07 | 18,083.49 | 13,288.12 | $79,251,277.85 |
| 2025–26 | $14,850.31 | $8,567.47 | $6,282.84 | 18,517.68 | 14,125.41 | $88,747,690.96 |
Per the table, HB 1552 payments appear to have risen far beyond the estimates in the fiscal note that accompanied the bill. Indeed, the payments for either St. Louis or Kansas City alone exceed the fiscal note’s estimates for the total cost of the program. The cost of HB 1552 payments for Kansas City and St. Louis charters in 2025–26 was approximately three times the bill’s original estimates. These large increases are explained partially by increases in charter enrollment but also by substantial decreases in district enrollment, particularly in 2024–25, when district FWADA in St. Louis and Kansas City decreased by 6.5 percent and 20.1 percent, respectively. These do not reflect true mass disenrollments (at least not in one year), but rather the expiration of a pandemic-era provision that allows traditional public schools, but not charter schools, to calculate the largest component of FWADA based on their highest year from 2019–20 onwards. The large increases in HB 1552 payments we report in Table A2 are then the result of district disenrollments.
Other Data Sources
For some analyses, we combine additional data sources with the previously discussed ASBR and payment transmittal data. We obtain district enrollments, both overall and for specific subgroups, through the Department of Elementary and Secondary Education’s website. Although many aspects of HB 1552 payments are calculated using formula weighted average daily attendance (FWADA), we report many of our figures in per-pupil terms (i.e., per enrolled student). This decision was made for two primary reasons. First, districts may, but do not necessarily, need to use enrollments and ADA from prior years in calculating their FWADA payments, meaning FWADA figures (though pertinent to formula calculations) may misrepresent the actual number of students enrolled in a district during a given school year. Second, the FWADA figures that districts chose to report for aid calculations are not readily available for all years of data.
In preliminary analyses, we examine HB 1552’s impacts on two outcomes. The first is a measure of school value-added reported as part of Missouri’s accountability system. We obtain these measures through a combination of public reports and data requests to the Missouri Department of Elementary and Secondary Education. We transform these school value-added measures to be interpretable in terms of standard deviations of student achievement. For example, a value-added of 0.05 would indicate that students at that school grew 0.05 standard deviations more than expected, conditional on background characteristics. The second set of outcomes we examine is the effect of HB 1552 on school staffing and teacher compensation. We obtain counts of individuals employed across one of several roles as well as average teacher compensation through publicly available reports on DESE’s website.
Our empirical approach proceeds in several stages. First, we conduct descriptive analyses and data visualizations to understand differences in how Missouri’s funding formula treats different schools. Next, we estimate difference-in-differences models to identify the causal effect of HB 1552 on charter revenues. Following this, we augment this framework with controls for concurrent federal COVID relief funding to isolate charter expenditure responses to HB 1552. Finally, we conduct a forecasting exercise to estimate how HB 1552 payments may evolve in St. Louis and Kansas City over the next five years.
Estimating Effects on Revenues
To estimate the causal effect of HB 1552 on charter revenues and complement the accounting-based analysis described in Appendix A, we employ a difference-in-differences design comparing changes in revenue for charter schools (treated) to changes for traditional public school districts operating under the standard funding formula (comparison). Our control group consists of Missouri districts that are not subject to the permanent hold-harmless provision established under SB 287, which guarantees that approximately one-third of Missouri districts receive funding based on 2004–05 or 2005–06 levels rather than current formula calculations. This restriction is consistent with our identifying assumption that charter and traditional public school revenues would have evolved in parallel absent HB 1552. Excluded districts operate outside the funding formula and, as a result, the evolution of their outcomes will, by definition, not be parallel. Because districts can opt in or out of the permanent hold-harmless provision each year, we identify excluded districts as any that were held harmless between 2007–08 and 2021–22.
Because treatment effects may evolve over time—HB 1552 payments increased substantially between their introduction in 2022–23 and the 2024–25 school year—standard two-way fixed effects estimation may produce biased estimates, even given the simultaneous treatment timing in this setting.[27] We address this concern using the two-stage difference-in-differences estimator proposed by Gardner et al. This approach first estimates unit and time fixed effects using only untreated observations (i.e., control units in all periods and treated units only in pre-treatment periods), then residualizes outcomes for all observations before finally estimating treatment effects by regressing these residualized outcomes on treatment indicators. This procedure removes the mechanical contamination of unit fixed effects by dynamic treatment effects. To assess the credibility of our identification strategy, we additionally estimate the event-study analog as specified by Equation (1).
As in specifications for our estimates of overall effects, we include district fixed effects αi to account for time-invariant differences between LEAs alongside time fixed effects λt to account for common revenue shocks. Yit is a measure of per-pupil revenue for LEA i in year t. In the event study specification shown above, τk captures the difference in revenue between charters and comparison districts in year k relative to the omitted year (k = −1, corresponding to 2021–22). The coefficients τk for k < 0 test the parallel trends assumption; under the identifying assumption these should be indistinguishable from zero. Coefficients for k ≥ 0 (2022–23 onwards) estimate the causal effect of HB 1552 in each post-reform year.
We estimate Equation (1), and the static analog to it, separately for each revenue outcome. Examining multiple revenue components allows us to trace the direct effects of HB 1552 (which disperses funds through the basic formula) as well as potential crowd-out of other revenue sources. Standard errors are clustered at the LEA level to account for serial correlation within units.
Estimating Effects on Expenditures
Identifying the effect of HB 1552 on charter expenditures is complicated by the concurrent influx of federal COVID relief funds. Both funding shocks arrived during overlapping periods and affected charter school budgets simultaneously. If federal COVID relief funds were disproportionately concentrated among charter schools (or conversely among traditional public schools), extending Equation (1) to expenditure outcomes would conflate HB 1552 effects with ESSER-driven responses. We address this identification challenge by augmenting the difference-in-differences framework to account for ESSER exposure, exploiting variation in COVID relief funding across LEAs to separate HB 1552 effects from concurrent responses to federal pandemic aid. This is possible because ESSER allocations were strongly correlated with student poverty, generating substantial variation in per-pupil COVID relief funding both across and within sectors.
Equation (2) formalizes this identification strategy.
Here, we define ESSERi as the total COVID relief funds received by LEA i divided by cumulative enrollment from 2019–20 through 2024–25, expressed in thousands of dollars per-pupil-year and transformed to have a mean zero within the charter subsample. This demeaning ensures that the coefficient β1 is interpretable as the HB 1552 effect with typical ESSER exposure, rather than at the extrapolated value of zero ESSER funding. Postt equals one for years 2022–23 and later while β1 estimates the effect of HB 1552 on charter expenditures at mean ESSER exposure, purged of differential ESSER-driven expenditure responses. The coefficient β2 captures how expenditures changed post-2022 as a function of ESSER exposure for traditional public schools, while β3 captures whether charters’ ESSER-expenditure relationship differed from that of traditional public schools.
The identifying assumption is that, conditional on ESSER exposure, charter and traditional public school expenditures would have followed parallel trajectories absent HB 1552. Our expenditure outcomes focus on net current expenditures, excluding debt service and capital outlay. This restriction reflects both practical and conceptual considerations. Capital expenditures are lumpy and infrequent—a school may report zero capital spending for several years followed by a large spike for a construction project—creating substantial noise that could obscure responses to HB 1552 over our relatively short post-treatment window. Debt service payments, meanwhile, are determined by historical borrowing decisions and fixed amortization schedules rather than current revenue; they cannot respond to HB 1552 in the short run. More fundamentally, HB 1552 provides recurring operating revenue, which schools would reasonably allocate to recurring expenses such as salaries, benefits, and instructional supplies rather than to capital projects that require long-term planning and typically rely on separate financing mechanisms. Focusing on current expenditures thus captures the margin on which we expect schools to respond.
Unlike our analyses of revenue effects, we do not exclude held-harmless districts in order to improve precision; however, results are qualitatively similar if these districts are excluded. We estimate Equation (2) and its event study analog using the Gardner et al. (2024) two-stage procedure to address potential bias from dynamic treatment effects. In the first stage, estimated on untreated observations only, we include the ESSERi × Postt interaction to absorb ESSER-driven expenditure changes in the counterfactual. The Charteri × Postt and Charteri × Postt × ESSERi terms enter the second stage; we report only the former as it captures the HB 1552 effect of primary substantive interest. Standard errors are clustered at the LEA level.
Finally, we estimate the effect of HB 1552 on school value-added in mathematics and English language arts. These measures are reported by the Missouri Department of Elementary and Secondary Education as part of the state's school accountability system and are expressed in standard deviations of student achievement. We estimate effects on value-added using the same difference-in-differences design applied to our staffing and teacher-composition outcomes, with standard errors clustered at the LEA level.
Projecting HB 1552 Payments
The enrollment-dependent structure of HB 1552 payments creates inherent fiscal uncertainty for both the state and charter schools. Payments depend upon the interaction of multiple quantities—district and charter enrollment as well as local tax revenue, each of which evolves according to distinct dynamics and is subject to different sources of variation. To characterize the fiscal sustainability implications of this payment structure, we develop probabilistic forecasts of HB 1552 payment distributions over a five-year horizon (i.e., for the 2026–27 through 2030–31 school years). Our approach combines fixed policy parameters (e.g., the state adequacy target) with stochastic simulation of student enrollments and future tax revenues. This hybrid framework reflects the reality that some determinants of HB 1552 payments are set through administrative policy and change only through deliberate action, while others fluctuate with demographic shifts, market conditions, and state budget decisions. By modeling these components separately and appropriately, we can generate credible forecasts that quantify both the expected trajectory of payments and volatility around that trajectory.
Forecasting future HB 1552 payments relies on the fact that these amounts are calculated as a function of the per-pupil revenue gap between charter schools and their host districts, multiplied by charter enrollment. The per-pupil gap, in turn, depends on district local revenue capacity (tax collections above the statutory floor) and state estimates of local aid allocations. To forecast payments, we must project each of these underlying quantities. We classify the inputs to the payment formula into two categories based on their appropriate treatment in a forecasting exercise. The first category includes parameters that are fixed by statute or administrative determination and that only change through explicit policy action. These include the state adequacy target, categorical funding weights, and the 34.3 mills minimum tax levy below which local revenue does not enter the gap calculation. We hold these parameters constant at their current, or in the case of state adequacy target pre-determined, values throughout the forecast horizon, reflecting the assumption that the existing policy framework remains in place.
The second category includes quantities that vary over time in response to demographic, economic, and budgetary forces outside the direct control of the funding formula. District and charter enrollment (measured in formula-weighted average daily attendance), per-pupil tax revenue in excess of 34.3 mills, and total local tax revenue all fall into this category. These quantities exhibit year-to-year variation driven by population movements, property value changes, state appropriations decisions, and other unobservable factors. We model these quantities stochastically to capture the range of plausible futures and the uncertainty inherent in projecting them forward.
This classification reflects a deliberate judgment about the appropriate counterfactual for policy analysis. Forecasting under the assumption of fixed policy parameters answers the question: given the current structure of HB 1552 and the state’s funding formula, what payment distributions should we expect? Alternative assumptions—such as modeling potential policy changes—would answer different questions and are beyond the scope of this analysis. Most financial instruments come with a disclaimer that “past performance is not indicative of future results,” and the same is true here. The forecasts that we develop do not guarantee what HB 1552 payments will look like in the future but rather are useful tools for understanding the range of potential scenarios under a stringent set of assumptions which are unlikely to hold exactly.
While our assumptions about policy parameters are likely considered reasonable, any specific point estimate is unlikely to be correct. Despite these limitations, we believe that efforts to forecast future HB 1552 payments are informative in two dimensions. First, these forecasts highlight potential unforeseen consequences of HB 1552 payment calculations. Second, these forecasts offer insight into the stability, or rather instability, that Missouri charters might expect from HB 1552 in the near future.
We model the stochastic components using vector autoregression (VAR) which captures both the persistence of each series over time and the dynamic interdependencies among them. Rather than estimating a single VAR encompassing all four variables, we specify separate models for the enrollment block (i.e., district and charter FWADA) and the fiscal block (i.e., revenues above the 34.3 base millage and total local tax revenue). This separation reflects substantive differences in the data-generating process underlying these two sets of variables. Enrollment dynamics are driven primarily by demographic factors (e.g., birth rates, migration patterns, and household location decisions) that operate on relatively long horizons and exhibit substantial inertia. Fiscal variables respond to different forces: property tax revenue depends on assessment cycles and millage rates, while other forms of revenue reflect state budget conditions, macroeconomic trends, and legislative priorities. Although enrollment and fiscal variables are not entirely independent—growing districts may see rising property values, for instance—the primary sources of variation differ sufficiently so that separate models better capture the relevant dynamics.
Empirically, the separation also improves forecasting performance by reducing the parameter burden in each model and allowing lag structures tailored to the persistence characteristics of each block. This decision is even more important given that we estimate VARs separately for Kansas City and St. Louis to allow enrollment and local tax dynamics in these cities to evolve separately.
Time series forecasting requires appropriate treatment of non-stationarity. We assess each series for unit roots using augmented Dickey-Fuller tests and find evidence of non-stationarity for most variables. This is intuitive—enrollments in district schools have steadily declined while enrollments in charters have increased, for example. Accordingly, we estimate VAR models on first-differenced data, which captures year-over-year changes rather than levels. Forecasting in differences requires reconstructing levels from the simulated changes. We initialize each simulation at the final observed values in our sample and propagate the projected differences forward. This approach preserves the level of each series at the forecast origin while allowing the simulated trajectories to diverge as uncertainty accumulates over the forecast horizon.
Our estimation sample covers the 2000–01 through 2024–25 school years. However, we omit the 2024–25 observation from model estimation because it reflects a one-time policy adjustment that is not representative of normal year-to-year variation (i.e., a pandemic-era hold-harmless provision expired, resulting in a sharp adjustment to reported FWADA). Including this observation would contaminate our estimates of typical volatility and could bias forecasts toward expecting similarly large discrete changes in future years. The exclusion decision involves a tradeoff between sample size and the integrity of the estimated dynamics. Given that our goal is to characterize the range of outcomes under routine operation of the funding formula, we judge that excluding this anomalous observation produces more credible forecasts than treating it as informative about normal variation.
We generate probabilistic forecasts through Monte Carlo simulation using residual bootstrap resampling. This approach proceeds in three steps. First, we estimate the VAR models on the historical sample and extract the fitted values and residuals for each period. Second, for each simulation draw, we construct a sequence of future shocks by sampling with replacement from the historical residual vectors. Third, we iterate the estimated VAR forward using these resampled shocks to generate a simulated path for each variable. An important feature of this procedure is that we resample residual vectors jointly rather than drawing residuals independently for each variable. This preserves the contemporaneous correlation structure observed in historical data. If, for example, years with unexpectedly strong charter enrollment growth also tend to feature above-average increases in local tax revenue, independent resampling would destroy this relationship and understate the joint probability of certain payment outcomes. By resampling entire residual vectors, we maintain these cross-variable dependencies in our simulated futures.
In total, we generate 100,000 simulation draws for each city, providing sufficient precision to characterize the tails of the payment distribution as well as the central tendency. We impose several notable restrictions on these simulated draws. Unconstrained VAR simulations can occasionally produce trajectories that, while statistically consistent with the estimated model, are implausible from a policy standpoint. For example, enrollment cannot fall below zero and per-pupil revenue cannot grow at rates sustained only during unusual historical episodes; charter market share cannot exceed reasonable bounds. To ensure that our forecasts represent credible scenarios, we impose constraints reflecting these realities.
For enrollment variables, we cap year-over-year percent changes at the maximum and minimum values observed in the historical record, excluding the anomalous 2024–25 observations. For fiscal variables, we apply analogous bounds calibrated to historical variation. Simulated paths that violate these constraints are adjusted to the boundary values rather than discarded, preserving the full set of draws while preventing extreme outliers from distorting the distribution. These constraints are conservative in the sense that they permit any combination of changes observed historically, merely prohibiting extrapolation beyond the range of experience. They do not impose views about likely future trends—only about the limits of plausible annual variation.
We estimate and simulate the forecasting models separately for Kansas City and St. Louis. Although both cities operate under identical HB 1552 provisions, their underlying enrollment and fiscal dynamics differ in substantial ways. Pooling the cities would obscure these differences and could produce forecasts that fit neither city well. The most consequential difference between cities concerns local aid trajectories. Historical growth rates of per-pupil local aid differ markedly, and these differences propagate through the payment formula to produce divergent projected payment paths. Kansas City has experienced faster local aid growth, which narrows the per-pupil gap between charters and the district and exacerbates payment increases even as charter enrollment expands. St. Louis exhibits slower local aid growth, moderating the enrollment-driven component of payments. We report results separately by city throughout, allowing readers to assess the distinct fiscal implications of HB 1552 in each context.
Table C1. Effect of HB 1552 on Per-Pupil Revenue (ATT)
| State Formula | State Total | Donations | Local Total | State & Local | |
|---|---|---|---|---|---|
| HB 1552 | $2,999.79** | $3,102.29** | −$447.12** | −$863.76** | $2,238.54** |
| ($216.82) | ($245.13) | ($151.81) | ($187.93) | ($319.87) | |
| Observations | 2,647 | 2,647 | 2,647 | 2,647 | 2,647 |
| LEA FEs | 297 | 297 | 297 | 297 | 297 |
| School Year FEs | 9 | 9 | 9 | 9 | 9 |
| Pre-treatment mean | $11,926.97 | $12,549.35 | $1,309.27 | $2,931.93 | $15,481.28 |
| Note: + p < 0.1, * p < 0.05, ** p < 0.01. All regressions weighted by student enrollment. Outcomes are real per-pupil revenue in constant 2024 dollars. Standard errors clustered at the LEA-level. | |||||
Table C2: Effect of HB 1552 on School Value-Added (ATT)
| ELA School Value-Added | Math School Value-Added | |
|---|---|---|
| HB 1552 | 0.00 | 0.03* |
| (0.01) | (0.01) | |
| Observations (LEA-years) | 11,753 | 11,753 |
| LEA FEs | 562 | 562 |
| School Year FEs | 7 | 7 |
| Pre-treatment mean | 0.03 | 0.01 |
| Note: + p < 0.1, * p < 0.05, ** p < 0.01. All regressions weighted by student enrollment. Outcomes are LEA-level value-added measures (z-scored growth). Standard errors clustered at the LEA-level. | ||
Table C3. Effect of HB 1552 on Staffing
| Student-Teacher Ratio | All FTEs / 100 Students | Teacher FTEs / 100 Students | Support FTEs / 100 Students | Admin FTEs / 100 Students | |
|---|---|---|---|---|---|
| HB 1552 | −1.24* | 1.71* | 0.97** | 0.50 | 0.27 |
| (0.51) | (0.77) | (0.29) | (0.36) | (0.22) | |
| Observations (LEA-years) | 8,510 | 8,510 | 8,510 | 8,510 | 8,510 |
| LEA FEs | 595 | 595 | 595 | 595 | 595 |
| School Year FEs | 15 | 15 | 15 | 15 | 15 |
| Pre-treatment mean | 13.38 | 11.61 | 7.75 | 2.40 | 1.46 |
| Note: + p < 0.1, * p < 0.05, ** p < 0.01. All regressions weighted by student enrollment. Outcomes are LEA-year staffing rates derived from the NCES Common Core of Data. Standard errors clustered at the LEA-level. | |||||
Table C4. Effect of HB 1552 on Teacher Compensation and Composition
| Avg. Teacher Salary | Avg. Years of Experience | Master's-Degree Share | |
|---|---|---|---|
| HB 1552 | $2,366.01* | 1.01** | 0.03 |
| ($940.10) | (0.31) | (0.03) | |
| Observations (LEA-years) | 8,510 | 8,510 | 8,510 |
| LEA FEs | 595 | 595 | 595 |
| School Year FEs | 15 | 15 | 15 |
| Pre-treatment mean | $57,370 | 7.31 | 0.39 |
| Note: + p < 0.1, * p < 0.05, ** p < 0.01. All regressions weighted by teacher FTE. Outcomes are LEA-year teacher-population characteristics derived from the DESE District Faculty Information file. Teacher salary in constant 2024 dollars. Standard errors clustered at the LEA-level. | |||
Table C5. Effect of HB 1552 on Per-Pupil Current Expenditures
| Panel A: K-12 Instruction | ||||||
| Cert. Salaries | Non-Cert. Salaries | Benefits | Purch. Services | Supplies | Total | |
|---|---|---|---|---|---|---|
| HB 1552 | $364.80+ | $153.35 | $322.34** | $79.71 | −$33.53 | $886.67** |
| ($189.63) | ($111.28) | ($53.72) | ($192.82) | ($43.69) | ($272.97) | |
| Pre-treatment mean | $4,691.18 | $639.13 | $1,580.91 | $1,070.22 | $550.44 | $8,531.88 |
| Panel B: Student & Instructional Support | ||||||
| Cert. Salaries | Non-Cert. Salaries | Benefits | Purch. Services | Supplies | Total | |
| HB 1552 | $187.27** | $187.25** | $143.81** | $79.48 | −$0.76 | $597.05** |
| ($68.30) | ($64.61) | ($23.32) | ($53.91) | ($11.27) | ($113.10) | |
| Pre-treatment mean | $363.28 | $386.16 | $217.53 | $273.63 | $59.24 | $1,299.84 |
| Panel C: Administration & Operations | ||||||
| Cert. Salaries | Non-Cert. Salaries | Benefits | Purch. Services | Supplies | Total | |
| HB 1552 | $174.24+ | $162.95 | $171.03** | $231.75 | $206.39** | $946.37** |
| ($91.58) | ($107.59) | ($56.85) | ($243.63) | ($58.02) | ($251.97) | |
| Pre-treatment mean | $771.94 | $1,236.61 | $591.76 | $3,966.67 | $619.95 | $7,186.93 |
| Panel D: Total All Functions | ||||||
| Cert. Salaries | Non-Cert. Salaries | Benefits | Purch. Services | Supplies | Total | |
| HB 1552 | $725.59** | $503.37* | $636.92** | $390.80 | $171.83* | $2,428.52** |
| ($254.13) | ($195.55) | ($99.05) | ($323.24) | ($85.79) | ($426.63) | |
| Pre-treatment mean | $5,826.40 | $2,261.90 | $2,390.20 | $5,310.52 | $1,229.64 | $17,018.65 |
| Observations (LEA-years) | 4,922 | 4,922 | 4,922 | 4,922 | 4,922 | 4,922 |
| LEA FEs | 297 | 297 | 297 | 297 | 297 | 297 |
| School Year FEs | 17 | 17 | 17 | 17 | 17 | 17 |
| Note: + p < 0.1, * p < 0.05, ** p < 0.01. All regressions weighted by student enrollment. Outcomes are real per-pupil current expenditures in constant 2024 dollars. Standard errors clustered at the LEA-level. | ||||||
Table C6. Forecasted HB 1552 Inputs and Payments—Kansas City
| Panel A: District FWADA | |||||
| %tile | 2026–27 | 2027–28 | 2028–29 | 2029–30 | 2030–31 |
|---|---|---|---|---|---|
| 5% | 17,403 | 17,555 | 17,288 | 16,869 | 16,587 |
| 25% | 17,953 | 18,153 | 18,202 | 18,127 | 18,124 |
| 50% | 18,112 | 18,608 | 18,888 | 19,058 | 19,264 |
| 75% | 18,464 | 19,006 | 19,598 | 20,028 | 20,439 |
| 95% | 18,913 | 19,527 | 20,625 | 21,416 | 22,117 |
| Panel B: Charter FWADA | |||||
| %tile | 2026–27 | 2027–28 | 2028–29 | 2029–30 | 2030–31 |
| 5% | 16,180 | 16,437 | 16,539 | 16,662 | 16,923 |
| 25% | 17,053 | 17,399 | 17,659 | 17,982 | 18,335 |
| 50% | 17,333 | 18,022 | 18,450 | 18,842 | 19,248 |
| 75% | 17,627 | 18,442 | 19,059 | 19,590 | 20,081 |
| 95% | 18,098 | 18,989 | 19,762 | 20,456 | 21,071 |
| Panel C: Per-pupil Tax Rev > $3.43 | |||||
| %tile | 2026–27 | 2027–28 | 2028–29 | 2029–30 | 2030–31 |
| 5% | $656 | $572 | $439 | $221 | $54 |
| 25% | $910 | $792 | $739 | $596 | $504 |
| 50% | $932 | $991 | $996 | $925 | $888 |
| 75% | $1,095 | $1,274 | $1,386 | $1,400 | $1,441 |
| 95% | $2,191 | $2,148 | $2,222 | $2,336 | $2,447 |
| Panel D: Local Aid | |||||
| %tile | 2026–27 | 2027–28 | 2028–29 | 2029–30 | 2030–31 |
| 5% | $278.7M | $302.5M | $328.3M | $352.0M | $375.3M |
| 25% | $288.0M | $315.8M | $350.2M | $383.1M | $417.6M |
| 50% | $293.7M | $326.7M | $366.3M | $406.3M | $449.1M |
| 75% | $297.1M | $334.8M | $383.0M | $432.4M | $486.7M |
| 95% | $322.8M | $372.0M | $435.8M | $500.3M | $570.2M |
| Panel E: HB 1552 Payments per FWADA | |||||
| %tile | 2026–27 | 2027–28 | 2028–29 | 2029–30 | 2030–31 |
| 5% | $6,274 | $7,440 | $8,385 | $9,414 | $10,376 |
| 25% | $7,659 | $8,817 | $10,381 | $12,027 | $13,655 |
| 50% | $8,457 | $9,833 | $11,785 | $13,946 | $16,121 |
| 75% | $8,845 | $10,757 | $13,159 | $15,893 | $18,697 |
| 95% | $9,156 | $11,852 | $15,153 | $18,936 | $22,917 |
| Note: Percentiles computed across 100,000 simulation iterations. Per-city VARs fit on differenced FWADA and fiscal series with 2 lags. Year-over-year changes constrained to ±100% of the current level. Payments displayed in nominal dollars. | |||||
Table C7. Forecasted HB 1552 Inputs and Payments—St. Louis
| Panel A: District FWADA | |||||
| %tile | 2026–27 | 2027–28 | 2028–29 | 2029–30 | 2030–31 |
|---|---|---|---|---|---|
| 5% | 16,441 | 14,539 | 13,304 | 12,447 | 11,976 |
| 25% | 17,298 | 15,911 | 14,872 | 14,101 | 13,727 |
| 50% | 17,634 | 16,316 | 15,607 | 15,035 | 14,792 |
| 75% | 17,838 | 16,788 | 16,301 | 15,897 | 15,758 |
| 95% | 18,272 | 17,630 | 17,362 | 17,146 | 17,139 |
| Panel B: Charter FWADA | |||||
| %tile | 2026–27 | 2027–28 | 2028–29 | 2029–30 | 2030–31 |
| 5% | 12,191 | 13,975 | 13,537 | 13,038 | 13,075 |
| 25% | 13,467 | 15,274 | 14,895 | 14,492 | 14,644 |
| 50% | 14,054 | 15,818 | 15,745 | 15,512 | 15,747 |
| 75% | 14,701 | 16,564 | 16,742 | 16,623 | 16,897 |
| 95% | 15,714 | 17,577 | 18,128 | 18,220 | 18,607 |
| Panel C: Per-pupil Tax Rev > $3.43 | |||||
| %tile | 2026–27 | 2027–28 | 2028–29 | 2029–30 | 2030–31 |
| 5% | $738 | $761 | $768 | $781 | $818 |
| 25% | $868 | $951 | $995 | $1,078 | $1,167 |
| 50% | $978 | $1,074 | $1,174 | $1,305 | $1,436 |
| 75% | $1,064 | $1,210 | $1,401 | $1,573 | $1,725 |
| 95% | $1,600 | $1,598 | $1,784 | $1,990 | $2,182 |
| Panel D: Local Aid | |||||
| %tile | 2026–27 | 2027–28 | 2028–29 | 2029–30 | 2030–31 |
| 5% | $271.4M | $276.5M | $278.6M | $282.7M | $286.4M |
| 25% | $274.5M | $281.0M | $285.2M | $290.3M | $295.1M |
| 50% | $278.2M | $285.4M | $290.5M | $296.7M | $302.7M |
| 75% | $282.6M | $290.3M | $297.6M | $307.0M | $315.0M |
| 95% | $302.3M | $309.7M | $315.7M | $324.3M | $333.0M |
| Panel E: HB 1552 Payments per FWADA | |||||
| %tile | 2026–27 | 2027–28 | 2028–29 | 2029–30 | 2030–31 |
| 5% | $6,199 | $7,135 | $7,424 | $7,759 | $7,967 |
| 25% | $6,581 | $7,974 | $8,635 | $9,273 | $9,693 |
| 50% | $6,857 | $8,555 | $9,546 | $10,468 | $11,097 |
| 75% | $7,182 | $9,176 | $10,618 | $11,906 | $12,804 |
| 95% | $7,782 | $10,727 | $12,853 | $14,782 | $16,155 |
| Note: Percentiles computed across 100,000 simulation iterations. Per-city VARs fit on differenced FWADA and fiscal series with 2 lags. Year-over-year changes constrained to ±100% of the current level. Payments displayed in nominal dollars. | |||||
Endnotes
[1] In 2024, the Missouri General Assembly passed a law allowing charter schools to operate in Boone County, despite opposition from Columbia Public Schools. The district later sued the state and its education board, alleging the law is unconstitutional. See Rudi Keller, “Columbia Schools Sue to Block Law Expanding Reach of Missouri Charter Schools,” Missouri Independent, December 15, 2025, https://missouriindependent.com/2025/12/15/columbia-schools-sue-to-block-law-expanding-reach-of-missouri-charter-schools/.
[2] Compared with the 2005 report, those percentage gaps are remarkably similar to today’s figures (27–30 percent), but the dollar gaps have roughly doubled in nominal terms—from roughly $3,500–$3,800 to $7,000–$8,100.
[3] CREDO, National Charter School Study (Stanford, CA: Center for Research on Education Outcomes, Stanford University, 2013), https://credo.stanford.edu/wp-content/uploads/2021/08/ncss_2013_final_draft.pdf; CREDO, Urban Charter School Study Report on 41 Regions (Stanford, CA: Center for Research on Education Outcomes, Stanford University, 2015), https://urbancharters.stanford.edu/download/Urban%20Charter%20School%20Study%20Report%20on%2041%20Regions.pdf; CREDO, As a Matter of Fact: The National Charter School Study III (Stanford, CA: Center for Research on Education Outcomes, Stanford University, 2023), https://credo.stanford.edu/reports/item/national-charter-school-study-iii/.
[4] Sarah Cohodes and Susha Roy, “Thirty Years of Charter Schools: What Does Lottery-Based Research Tell Us?” Journal of School Choice 19, no. 1 (2025): 8–49, https://doi.org/10.1080/15582159.2024.2379644.
[5] CREDO, As a Matter of Fact: The National Charter School Study III (Stanford, CA: Center for Research on Education Outcomes, Stanford University, 2023), https://credo.stanford.edu/reports/item/national-charter-school-study-iii/.
[6] Alison Heape Johnson, Josh B. McGee, Patrick J. Wolf, Jay F. May, and Larry D. Maloney, Charter School Funding: Little Progress Towards Equity in the City (Fayetteville, AR: School Choice Demonstration Project, University of Arkansas, 2023), https://bpb-us-e1.wpmucdn.com/wordpressua.uark.edu/dist/9/544/files/2023/12/charter-school-funding-little-progress-towards-equity-in-the-city.pdf.
[7] Barbara Biasi, Julien Lafortune, and David Schönholzer, “What Works and for Whom? Effectiveness and Efficiency of School Capital Investments across the U.S.,” Quarterly Journal of Economics 140, no. 3 (2025): 2329–2379, https://doi.org/10.1093/qje/qjaf013; C. Kirabo Jackson and Claire L. Mackevicius, “What Impacts Can We Expect from School Spending Policy? Evidence from Evaluations in the United States,” American Economic Journal: Applied Economics 16, no. 1 (2024): 412–46, https://doi.org/10.1257/app.20220279.
[8] Missouri General Assembly, House Bill 1552 (Enrolled): Changes Provisions Related to Funding for Charter Schools, 2022 Regular Session, accessed July 8, 2026, https://house.mo.gov/billtracking/bills221/hlrbillspdf/3565S.11T.pdf.
[9] Stéphane Lavertu, The Impact of Increasing Funding for High-Performing Ohio Charter Schools: The Quality Community School Support Fund, 2019–23 (Columbus, OH: Thomas B. Fordham Institute, October 2024), https://fordhaminstitute.org/ohio/research/impact-increasing-funding-high-performing-ohio-charter-schools-quality-community.
[10] Missouri General Assembly, Senate Bill 781 (Truly Agreed to and Finally Passed): Revises Provisions Relating to School Desegregation, School Funding, and Urban Schools, 89th General Assembly, Second Regular Session (1998), https://www.senate.mo.gov/98info/bills/SB781.htm.
[11] CREDO, As a Matter of Fact: The National Charter School Study III (Stanford, CA: Center for Research on Education Outcomes, Stanford University, 2023), https://credo.stanford.edu/reports/item/national-charter-school-study-iii/.
[12] Alicia Demers, Jessica Drescher, and Matthew Johnson, Ewing Marion Kauffman School Year 10 and 11 Impacts (Princeton, NJ: Mathematica, 2024), https://www.mathematica.org/publications/ewing-marion-kauffman-school-year-10-and-11-impacts.
[13] Andrew M. Camp, Courtney Vahle, and Collin Hitt, PRiME Growth Report: Special Edition (St. Louis, MO: Policy Research in Missouri Education Center, Saint Louis University, 2025), https://www.primecenter.org/growth-reports-database/3-year-growth.
[14] Missouri General Assembly, Senate Bill 287 (Truly Agreed to and Finally Passed): Transitions the State Away from a Tax-Rate Driven Education Funding Formula to a Student-Needs Based Education Funding Formula, 93rd General Assembly, First Regular Session (2005), https://www.senate.mo.gov/05info/BTS_Web/BillText.aspx?BillID=10668&SessionType=R.
[15] The largest of these other minor revenue sources are dollars collected through Missouri’s Proposition C, a one-cent statewide sales and use tax introduced in the 1980s.
[16] RSMo 163.011(10) calculates local effort using equalized assessed valuation from calendar year 2004 multiplied by the performance levy of $3.43 per $100 assessed valuation, plus specified fiscal year 2005 revenue sources. Because this base is frozen, local effort does not update to reflect growth in actual property tax collections.
[17] RSMo 163.031(2) establishes this hold harmless provision, structured differently by enrollment size. For districts with average daily attendance above 350, state revenue per weighted ADA cannot fall below the 2005–06 per-pupil baseline. For districts with average daily attendance of 350 or fewer, total state revenue cannot fall below the greater of 2004–05 or 2005–06 levels.
[18] Susan Pendergrass, Equalizing Opportunity for Missouri’s Children: Creating a Targeted and Timely Approach to Funding Public Education (St. Louis, MO: Show-Me Institute, 2025), https://showmeinstitute.org/wp-content/uploads/2025/02/20250121-Funding-Formula-Pendergrass.pdf.
[19] RSMo 160.415(2)(1) specifies that charters are entitled to a portion of local revenues in excess of the required base millage rate. Section (4) specifies the pass-through mechanism but does not spell out how the dollar amount is calculated.
[20] Per the figure, this trend accelerated starting in 2019 due to pressure from the state tax commission, which found that assessors in several counties (notably Jackson County, where most of Kansas City is located) were assigning property tax values at less than 90 percent of market value. These changes to assessed values were perhaps the single biggest reason for the increase in total revenue for SLPS and KCPS.
[21] For HB 1552 calculations, local aid included current and delinquent taxes, a financial institution tax, city sales tax, state-assessed utilities, payments in lieu of tax, and property tax on commercial real estate (M&M surtax).
[22] We consider county revenues to be local revenues, though results are qualitatively similar when excluding these sources from the definition of local revenues.
[23] In some cases, these differences may be legitimate—charters that don’t offer pre-K shouldn’t receive dollars for pre-K programs. However, in some cases, there is no clear justification for treating the two sectors differently. For example, KCPS received a total of $606 in county revenues per pupil in 2021–22, thanks to payments from “State Assessed Utilities” and the “County Stock Insurance Fund,” while Kansas City charters received just $15 in county revenues per pupil.
[24] We explain our methodology for estimating these effects on district revenues, including how we account for contemporaneous ESSER and COVID-19 relief funds, in Appendix B.
[25] Although they aren’t the primary focus of this analysis, it’s worth noting that Missouri’s funding formula also creates other inequalities, in addition to those that exist between charters and their host districts. For example, the permanent hold-harmless provision and the formula’s reliance on assessed values from 2005 mean that important parameters of the funding formula are held artificially low, even as some districts collect substantial state and local revenues to serve relatively few students.
[26] FWADA for charters frequently changes over the course of the school year to a minor extent. Differences in the annualized amount owed to charters under the basic formula payment are made through a year-to-date correction that is calculated each month. In this example, St. Louis-area charters overestimated the FWADA at the beginning of the year, meaning that later payments were reduced so that the annualized amount of basic formula payments equaled what would have been calculated using June 2023 FWADA. Except where otherwise noted, we use end-of-year FWADA for analyses of payment transmittals so that these corrections are incorporated into the figures we present.
[27] Clément de Chaisemartin and Xavier D’Haultfœuille, “Two-Way Fixed Effects Estimators with Heterogeneous Treatment Effects,” American Economic Review 110, no. 9 (2020): 2964–96, https://doi.org/10.1257/aer.20181169; John Gardner, Neil Thakral, Linh T. Tô, and Luther Yap, “Two-Stage Differences in Differences,” working paper, 2024; Liyang Sun and Sarah Abraham, “Estimating Dynamic Treatment Effects in Event Studies with Heterogeneous Treatment Effects,” Journal of Econometrics 225, no. 2 (2021): 175–99, https://doi.org/10.1016/j.jeconom.2020.09.006.
About this Study
This report was made possible through funding from the MIT Blueprint Labs Charter Collaborative and our sister organization, the Thomas B. Fordham Foundation. The views expressed in this report are those of the authors alone and do not necessarily reflect those of the organizations that supported this work.
We are grateful to authors Andrew Camp, Collin Hitt, and David Griffith for their thoughtful work and commitment to the project, and to external adviser Cory Koedel for providing feedback on the draft report. We also thank Martin Lueken and Deanna Childress for sharing additional insights, as well as Dave Williams for designing the report's figures. Here at Fordham, we thank Chester E. Finn, Jr., Michael J. Petrilli, and Amber M. Northern for reviewing multiple drafts; Stephanie Distler for managing report production and design; and Victoria McDougald for overseeing dissemination and media relations.