Mobile Navigation

  • National
    • Policy
      • High Expectations
      • Quality Choices
      • Personalized Pathways
    • Research
    • Commentary
      • Gadfly Newsletter
      • Flypaper Blog
    • Events
    • Scholars Program
  • Ohio
    • Policy
      • Priorities
      • Media & Testimony
    • Research
    • Commentary
      • Ohio Education Gadfly Biweekly
      • Ohio Gadfly Daily
  • Charter Authorizing
    • Application
    • Sponsored Schools
    • Resources
  • About
    • Mission
    • Board
    • Staff
    • Career
Home
Home
Advancing Educational Excellence

Main Navigation

  • National
  • Ohio
  • Charter Authorizing
  • About

National Menu

  • Topics
    • Accountability & Testing
    • Advanced Education
    • Career & Technical Education
    • Charter Schools
    • Curriculum & Instruction
    • ESSA
    • Evidence-Based Learning
    • Facilities
    • Governance
    • Personalized Learning
    • Private School Choice
    • School Finance
    • Standards
    • Teachers & School Leaders
    • Think Again
  • Research
  • Commentary
    • Gadfly Newsletter
    • Flypaper Blog
    • Gadfly Podcast
  • Events
  • Scholars Program

The Education Gadfly Weekly

Sign Up to Receive Fordham Updates

We'll send you quality research, commentary, analysis, and news on the education issues you care about.
Thank you for signing up!
Please check your email to confirm the subscription.

The Education Gadfly Weekly: Don’t oversell SEL

Volume 19, Number 41
10.16.2019
10.16.2019

The Education Gadfly Weekly: Don’t oversell SEL

Volume 19, Number 41
view

Don’t oversell SEL

Social and emotional learning could do much good if deployed in pursuit of academic learning, but it runs multiple risks of going off the rails when its boosters ignore its limitations. It’s in this context that a recent brief by the NewSchools Venture Fund lands. There’s considerable wisdom in it, but leaders and policymakers should be careful what they do with the SEL measures for which it advocates. They should not, for example, incorporate them into accountability systems. Nor should they get so preoccupied with them that they neglect English, math, science, and history, or forget how much those matter in the real world.

Chester E. Finn, Jr. 10.16.2019
NationalFlypaper

Don’t oversell SEL

Chester E. Finn, Jr.
10.16.2019
Flypaper

Denver’s rapidly-shrinking school choice tent

Dale Chu
10.16.2019
Flypaper

Failing and passing the “Tiffany Test,” part I

David Scarlett Wakelyn
10.16.2019
Flypaper

When a school is improving, stay out of the way, warns an important new book

Robert Pondiscio
10.16.2019
Flypaper

Texas’s shale boom boosted local tax bases. Here’s how it affected schools.

Amber M. Northern, Ph.D.
10.16.2019
Flypaper

The Education Gadfly Show: Why the Big Easy’s big gains are over

10.16.2019
Podcast
view

Denver’s rapidly-shrinking school choice tent

Dale Chu 10.16.2019
Flypaper
view

Failing and passing the “Tiffany Test,” part I

David Scarlett Wakelyn 10.16.2019
Flypaper
view

When a school is improving, stay out of the way, warns an important new book

Robert Pondiscio 10.16.2019
Flypaper
view

Texas’s shale boom boosted local tax bases. Here’s how it affected schools.

Amber M. Northern, Ph.D. 10.16.2019
Flypaper
view

The Education Gadfly Show: Why the Big Easy’s big gains are over

Michael J. Petrilli, David Griffith, Ph.D., Amber M. Northern, Ph.D., Doug Harris 10.16.2019
Podcast
view

Don’t oversell SEL

Chester E. Finn, Jr.
10.16.2019
Flypaper

Call me a crotchety old guy and you have a point, but I need to vent my angst over a new report from the NewSchools Venture Fund, authored by the very capable Stacey Childress and her colleagues. They’ve landed with many feet on the social and emotional learning (SEL) bandwagon. Indeed, their new “insight brief” proudly declares that “enthusiasm for social emotional learning has reached a fever pitch among policymakers and funders.” That may well be so, but readers should bear in mind that while some fevers do good—the bodily kind can boost one’s immune system, not to mention getting overcome by election fever, a feverish desire to end poverty, etc.—other fevers can kill (typhoid, dengue, etc.) and still others simply drive you nuts (cabin fever).

SEL fever may be all of the above—and it may already be time to apply an ice pack and antibiotics. Months ago, Rick Hess and I wrote a cautionary piece showing how SEL could do much good if deployed in pursuit of academic learning, but also runs multiple risks of going off the rails, much as happened to earlier “whole child” education movements such as “self-esteem” and “values clarification.” We offered seven cautions lest overheated SEL boosters nudge it in the latter direction.

The sixth of our cautions was about metrics. Here’s what we had to say:

Make It a Priority to Develop Valid, Reliable, Intuitive Metrics for SEL—and Be Honest About Their Limits. It will be important to identify and insofar as possible develop bona fide outcome measures that feel credible to a broad swath of parents and educators. This will lend legitimacy to the insistence that SEL be evidence based, while enabling its measures to be viewed alongside measures of academic performance.... School climate surveys are a start, but let’s not kid ourselves. They share the vulnerabilities of all subjective “how do you think things are going” polls and questionnaires, including selective answers by adults who want their school to look good (or bad!) and plain old game-playing by students. SEL needs more reliable instruments. Just how practical it will be to develop them remains an open question, which should be addressed with a transparency and modesty too often absent in recent years in high-profile efforts to promote other sorts of novel measures such as student assessment and teacher evaluation.

It’s also vital to resist overselling the instruments that we do have. Some of what we most value in SEL may ultimately prove difficult to measure systematically or credibly.... Transparency and a willingness to continuously solicit feedback from skeptical students, parents, and teachers—not just supportive ones—will prove invaluable in addressing these tensions. A relentless commitment to evidence will help guard against goofiness while also helping reassure parents and educators. When the evidence is shaky or uncertain, SEL advocates need to forthrightly acknowledge the fact—not duck it or downplay it....

The NewSchools team, like many others in education today, is all about “expanded measures of student success” and how these can be used for school improvement. Others are especially keen about how such expansion can be used for improved school accountability that gives a fuller picture of school performance that’s less dependent on reading and math test scores. There’s considerable wisdom and common sense in the new brief’s advice about “non-academic indicators,” which they’ve been working on for two years in conjunction with TransformEd and some forty district and charter schools. Along the way, they whittled some sixty potential indicators (“skills, traits, mindsets, and values”) down to fourteen, half of which they term “social emotional competencies,” the other seven “culture/climate factors.” As they gather data, they look for (and don’t always find) correlations between these indicators and standard academic measures, and this quest is yielding a few useful initial insights. For example, the brief reports that “growth mindset” and “perceptions of school safety” are the two SEL indicators “most strongly associated with academic performance” while “sense of belonging” isn’t. Good to know, and even better when turned into formative guidance for school people.

I wanted to know a bit more about how these fourteen indicators work, in particular how they generate the data that enable correlations even to be sought. It’s well known that measuring this sort of stuff is difficult and lots of smart people are working in various places to get better at it. When I lifted the veil on the GreatSchools metrics, it was not too surprising to find that they’re based entirely on surveys administered to schoolkids, i.e., on self-reporting by students. (Also popular in SEL—and some ESSA accountability—circles are gauges of “school climate” resulting from surveys that include teachers.).

You can learn a lot from asking kids questions, and lots of survey questions and scoring scales have been tested and validated in various ways. TransformEd has done a lot of that and can cite much research—as did the big Aspen Commission on SEL that prompted Rick and me to write. One can learn a lot about the kids’ preferences, their opinions about themselves and their peers and their schools, and much more. But how reliable are they when used to gauge changes over time in a child or a school, particularly when seeking correlations with other things that are also changing over time? How many of these indicators are actually malleable and to what extent? And—especially—to what extent can they be altered by actions undertaken by schools and educators?

Consider, for example, what kids are asked that is meant to reveal the extent of their “growth mindset,” which we know from Carol Dweck, Angela Duckworth, et al.—and are again being told—correlates with, if it does not actually enhance, academic achievement over time.

They’re given statements such as “There are some things I am not capable of learning” and “Challenging myself won’t make me any smarter.” They’re given a scale of responses from “not at all true” to “completely true.” On questions like those, of course, the less true the statement in kids’ eyes, the stronger their growth mindset. (You can see all fourteen indicators if you turn to Appendix A of a TransformED working paper on the topic.)

Makes sense, sure. But now ask yourself to what extent are these things susceptible to change as a result of things that teachers and schools do or don’t do, or do well or poorly? And to what extent does this sense of self among kids get far more powerfully shaped by home and neighborhood, by the cultures they grow up within (including different ethnic and gender attitudes and stereotypes), by prior experience with anything from riding a bike to baking a cake? And how much are they contingent on context and subject matter?

On the first of those two illustrative statements, for instance, I would have displayed zero growth mindset because I probably would have imagined learning astrophysics, Amharic, or skydiving. This would have happened on the second statement, too, as I would have thought of how challenging myself in one realm—high jumping, say—wouldn’t have made me any “smarter.”

Now think about placing statements like these before both eight-year-olds and fifteen-year-olds. Before A students and D students. Homeless kids and upper-middle -class kids. During math class or P.E. On Monday morning or Friday afternoon. Think about it. Of course you’ll learn stuff from the results, and of course that stuff may help school people understand what they’re dealing with, what challenges they need to try to help kids with, and which kids have which challenges. But just how reliable and valid are these data? How accurately do they trace change over time? What inferences can you legitimately make about what causes changes in them? To what extent are they malleable by schools?

Some things in the SEL realm should certainly be malleable, especially on the “school culture/climate” side of the indicators. School safety and “rigorous expectations” are obvious. It gets more problematic on the “social-emotional competency” side, but over time—assuming kids remain there for multiple years—a first-rate school can probably deepen one’s curiosity, encourage perseverance, and foster self-regulation. Yet it’s really hard to imagine schools and teachers having great influence over those things—and especially over kids’ self-perception of those things—when compared with the other forces that shape and influence children. Yes, I’m harkening back to a tiny bit of “original research”—it took about five minutes—that I did several decades ago when I calculated that the typical American child spends only 9 percent of their time on earth between birth and age 18 under the school roof—and 91 percent elsewhere. (And that assumes full-day kindergarten and perfect attendance for thirteen years.)

Two risks loom. Most troubling—and I’m not saying NewSchools is pushing this—is what happens if indicators like these make their way into accountability systems and are used for judgments that get made about schools and teachers. It’s simply wrong to hold people and institutions to account for things over which they have such limited control—and which rely on indicators that more than a few parents and politicians will find unacceptably nosey and personal. Perhaps the risk is small—Angela Duckworth herself has warned against doing it—but in the quest to widen the accountability net, it shouldn’t be ignored.

Also troubling, and far more likely: What happens when school leaders, teachers, and ed reformers get so preoccupied with the SEL indicators themselves that they neglect English, math, science, and history or forget how much those matter in the real world? Recall the research showing that kids in Asian countries that were trouncing us on achievement measures actually didn’t feel all that positive about themselves and their work. Remember, too, the research showing that many young Americans who were bursting with self-esteem could neither multiply two numbers nor write a cogent paragraph.

To repeat: Resist overselling. Don’t get run over by bandwagons. Avoid catching most fevers.

view

Denver’s rapidly-shrinking school choice tent

Dale Chu
10.16.2019
Flypaper

Just weeks away from what could be a watershed school board election, Denver hosted a community town hall last Friday under the auspices of journalist Roland Martin and The 74. Titled “Is School Choice the Black Choice?” the event was the sixth in a series being held across the country with the goal of engaging local communities on education issues impacting communities of color. The panel discussion, featuring six local advocates, school leaders, and elected officials, was a long and winding one, punctuated by lively moments that underscore the broader tensions and complexities currently facing school choice and education reform writ large.

Racial strains figured prominently into the evening’s dialogue, and Martin kicked things off by saying, “You cannot have a movement that involves black and brown children if you do not have black and brown folks leading it and in charge of it.” One panelist described his work as disrupting the “preschool to prison pipeline” and working with black parents to navigate Denver’s “white supremacist school system.” Setting aside for a moment the verbal arms race that has led to the casual trading of such potent terms, the sentiment behind these words illustrates the brutal racial politics involved in communities like Denver when the student population is majority minority and the decision-makers are mostly white.

The emphasis on race is a far cry from the education reform of yesteryear, when the question of school choice being the black choice would have looked and sounded much different. The “soft bigotry of low expectations” was also about race, though by not exactly saying so, reformers were able to keep more people in the big tent. Back then, the focus on race was less tribal, but now it’s unmistakably aggressive, and the town hall reflected the polarization and balkanization of today’s state of affairs. In some instances, the reductionist politics that has infected our broader discourse reared its ugly head on stage. Nowhere was this more obvious than in the lack of consensus among the panelists of what school choice means for black communities.

This disagreement can be traced to several thorny and overlapping issues. For starters, “school choice” can ostensibly mean whatever one wants it to mean. For Martin, choice is about supporting whatever “works”—defined in part by student performance on state tests—regardless of governance structure, and opposing whatever doesn’t. According to him and some on the panel, choice is a tool for affording greater agency to students and families. For others, choice does exactly the opposite. Given the controversial school closings in the city, some now view choice as an anger accelerant and a constant reminder of indiscriminateness and injustice. Fueled by an even broader skepticism of standardized tests and perceptions of inherent racial bias, they argued that the focus on choice is symptomatic of a broader failure to heed and engage the black community on all issues of schooling. Here in Denver, this has been a protracted dispute with no resolution in sight.

In watching the hour and a half of tortuous back and forth, the frustration revealed on stage seemed less about left versus right, reform versus union, or privatizers versus status quo—though all three were certainly in the mix. Instead, there was a populist bent to the conversation, what political strategist Mo Elleithee has described as “in” versus “out.” Elleithee argues, “The real struggle is between the elites and the streets, people and the powerful. We have been increasingly moving in that direction for the past twenty-five years.” Similarly, the resentment expressed by some on the panel and in the audience that night turns on a feeling that they’ve been victims rather than beneficiaries of Denver’s school reforms. 

The pushback to yesterday’s reform playbook feels in some respect unfair given the dire straits many of Denver’s schools were once in—when taking no action would have been unconscionable—but it’s fair to say that reformers were guilty of too easily overlooking how schools can be a significant community asset regardless of academic performance. It’s worth remembering Andy Smarick’s outstanding piece, “Can Bad Schools Be Good for Neighborhoods?” In it, Smarick observes:

It might be the case that the school—notwithstanding its persistent low academic achievement—acts as an important strand in the invisible web of social connectivity that helps to hold a community together despite all the malign forces trying to pull it apart… those pursuing school-closure strategies should be mindful that every school, even the lowest-performing, is woven into the fabric of its neighborhood—and tugging on that thread affects the entire cloth.

What cities like my Denver hometown have seen—and which was palpable during the town hall—is a subset of those from marginalized communities reacting and responding to what were well-intentioned and overdue efforts to improve low-performing schools. This doesn’t mean reformers in Denver were wrong to close certain schools and replace them with new ones, but the effort to bring the community along clearly fell short. As the pendulum continues to swing, the stage may have been set for a shift away from choice in the Mile High City.

view

Failing and passing the “Tiffany Test,” part I

David Scarlett Wakelyn
10.16.2019
Flypaper

What happens to initially high-achieving students from high-poverty families as they move through elementary school? In the opening of his new book, How the Other Half Learns, Robert Pondiscio worries about these students while teaching fifth grade in the South Bronx. Tiffany is bright, pleasant, and earning good grades. But his assistant principal instructs him that top students like Tiffany will be fine; it’s the low achievers he needs to focus on.

As a result, Pondiscio views any reform from the lens of what he calls “The Tiffany Test”: “will this make it more likely or less likely that kids like Tiffany—promising low-income children of color—will get what they need to reach their full academic and life potential?”

We can begin to answer this question now that a majority of states have been giving assessments aligned to college and career-ready standards. Eleven states, educating 9.9 million students (20 percent of the U.S.) participate in the Smarter Balanced consortium. The Tiffanies from California to Washington, to Connecticut and Vermont are doing worse, and better, than one might hope for.

To see this, we can’t compare this year’s fifth graders to last year’s, as most states do. Instead, we need to follow the same groups of students and see how their achievement changes over time. We can take publicly available data to create groups of students by when they will eventually graduate from high school. Last year’s fifth graders will graduate in 2026, sixth graders in 2025, and so on. While classes can rise and fall within schools, as families move across neighborhoods, the size of the groups remains stable across most states and districts.

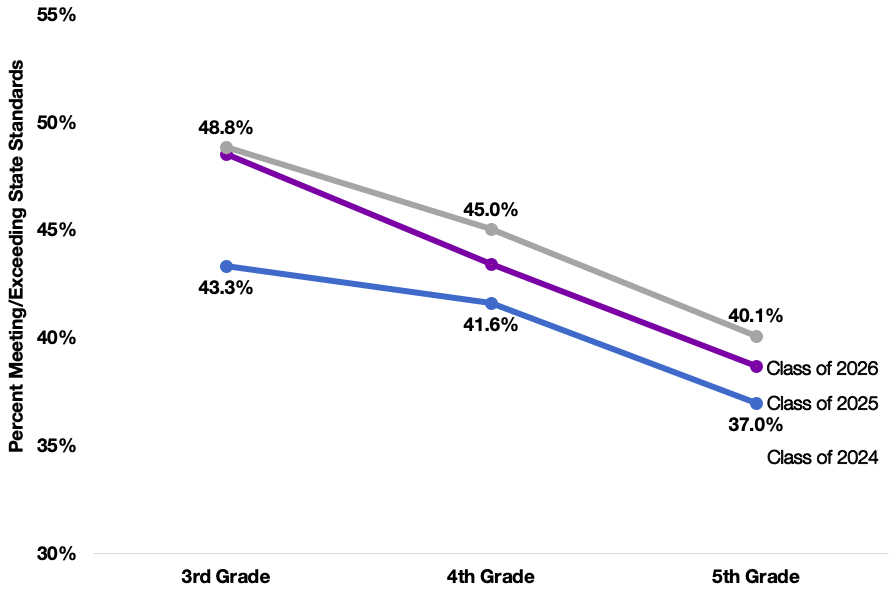
Across three classes of students—those who will graduate high school in 2024, 2025, and 2026—in the Smarter Balanced states, the slide is “only” 8 percentage points, as Figure 1 illustrates below. But this is a substantial number. 181,000 fewer students in fifth grade are meeting and exceeding math standards than they were as third graders. In California, Washington, and Connecticut, where subgroup data are available, 86,000 of these students are from economically disadvantaged families.

Figure 1. Slide in mathematics achievement, as determined by meeting or exceeded state standards, classes of 2024, 2025, 2026

1

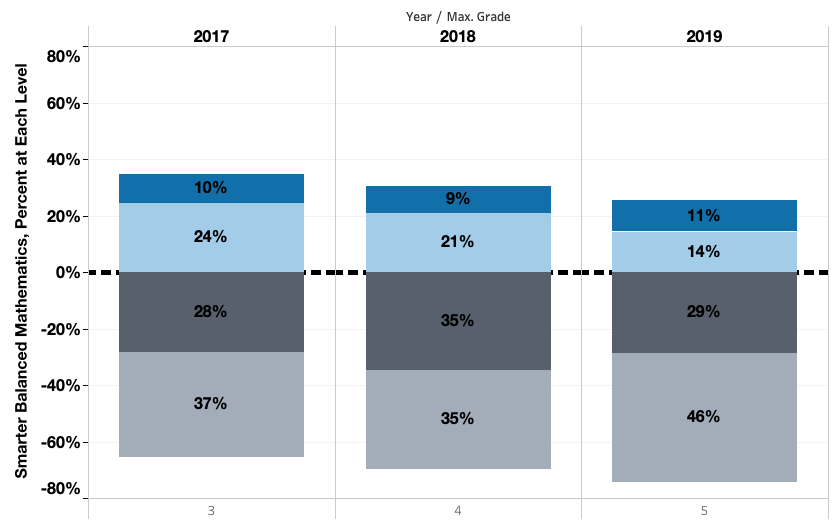
It’s not just that a few elementary students like Tiffany who had been successful in third grade have fallen just below the proficiency cut score. In every class of economically disadvantaged students in California, Washington, and Connecticut, more students are scoring at the lowest levels in math as they progress through elementary school. For example, Figure 2 below shows the math achievement of low-income students in the Class of 2025 as they move through elementary school. The gray bars (Levels 1 and 2) are increasing, and the blue bars (Levels 3 and 4) are sliding downward.

Figure 2. Math slide for California’s economically disadvantaged students (class of 2025)

2

What might explain the slide in math?

First, the “mile wide and inch deep curriculum” problem William Schmidt identified takes time to undo. Too many textbooks in use still haven’t made the shift in focus and coherence expected by the new math standards. Forty-two percent of math teachers the Fordham Institute surveyed in 2016 reported that the math materials available to them are not well aligned with the Common Core. While EdReports.org is helping to raise the quality of learning materials, many of the textbooks in the field still cover less than 50 percent of the major work expected of the grade.

Shelbi Cole of Student Achievement Partners says there is still a substantial mismatch between the questions used in textbooks and the tasks on the assessment. As an example, many of the texts have a large number of word problems in the K–5 Number and Operations in Base Ten (NBT) domain, but this is not the case on the Smarter Balanced test, which emphasizes conceptual understanding and procedural skill aligned to the expectations of the standards. 

Second, the new standards lay out a progression for teaching fractions that’s still taking teachers time to get adjusted to. Before the Common Core, addition and subtraction of fractions were introduced anywhere from third to seventh grade. Now unit fractions are introduced in third grade and developed in a careful sequence that extends partially into sixth grade. Teachers and their students may still struggle with understanding the logic underlying the algorithms of multiplying and dividing fractions.

Math knowledge and skills are cumulative, writes Joel Rose in his recent report, “The Iceberg Problem.” Two-thirds of sixth graders in their urban schools have considerable unfinished learning from earlier grades. They enter math classrooms at least two years behind.

Third, there may still be too much test prep crowding out learning time, says Patrick Callahan, former co-director of the California Mathematics Project and a consultant to several school districts. “For example,” he says, “there are too many weekly or daily practice test items that are never discussed or analyzed. This over-practice can reinforce misconceptions and misunderstandings rather than address and correct them.”

Research by David Blazar and Cynthia Pollard finds that math teachers’ test-prep lessons are of lower quality than when the same teachers aren’t prepping students for the test.

These are only initial hypotheses. States and districts would be well served by gathering expert elementary math teachers to investigate the causes of the slide more thoroughly.

We also need to build cases studies of individual student success and failure. Investigate a group of students who started out meeting standards in third grade and determine why they have slipped as fifth and sixth graders. Assemble a complete picture of their academic and social foundations. Similarly, we need to review a group of students who initially weren’t meeting standards and have grown to reach them. This will help us ensure future Tiffanies get all they need to be academically successful.

Part II, to be published next week, will summarize the surprisingly good news in reading and writing. Stay tuned.

view

When a school is improving, stay out of the way, warns an important new book

Robert Pondiscio
10.16.2019
Flypaper

There’s a not-so-secret tension that separates frontline educators from ed reformers, policymakers, and even district office poobahs. This tension, and the cost of top-down initiatives disrupting what’s working on the ground, form the through line of Eric Kalenze’s important new book, What the Academy Taught Us. I’ve made no secret of my admiration of Kalenze and his work as the American face of England’s ResearchED movement. His book shows off his gifts to good effect: He’s one of the few working educators who isn’t reflexively hostile to school improvement and education reform efforts—even when those efforts go sideways.

The academy of his book’s title is “Sophomore Academy,” an initiative circa 2004 at Osseo Senior High School in suburban Minnesota, just north of Minneapolis, where Kalenze taught English. A few years into his tenure, his principal, Dr. Robert Perdaems, approached Kalenze about an issue he’d noticed while studying the school’s data. “Dr. Bob” recognized that kids who dropped out or failed to graduate on time had all ended their sophomore year behind in credits. “In essence, every incoming sophomore class contained a group of invisible dropouts,” he writes. “Kids who were on their way to dropping out but didn’t know it yet.” The book also details how Dr. Bob built other school-wide improvements, turning much of the design and execution work over to a nucleus of teachers—a kitchen-cabinet group called “CSI” (for “Continuous School Improvement”)—which brought greater focus to each year’s improvement plans and played a key role in building staff buy-in and participation.

Kalenze describes how teachers on the CSI team, which he was enlisted to join, worked together, set priorities, and carried them out to create a sense of “individual belonging and shared community” among at-risk students, moving them academically from “stable to able.” In his telling, Kalenze and his colleagues all gained as professionals through this “bottom-up” teacher-led initiative. And it bore fruit. “Within the structures that Dr. Bob created when he commissioned the Sophomore Academy—not an off-the-shelf, comprehensive program—we were given the freedom to make a real difference when it mattered most,” Kalenze writes.

But it’s not a story with a happy ending. The book morphs into a cautionary tale of “how educational leadership is now done across much of the U.S. and how the already challenging job of continuous school improvement has become incredibly constrained and difficult.” A few years into its run, CSI and Sophomore Academy suffered deaths by a thousand cuts—not just budget cuts, but the inability to protect the initiative from the effects of “transformational system change,” detailed in a chapter drily titled, “The District Knew Best.” School improvements that actually work, Kalenze writes, “are never quite sexy or bold enough to attract the same degree of attention” as personalized learning, education technology, or even yoga breaks.

The district’s vision and goals were “decidedly disruptive,” Kalenze writes. Its word-salad strategy was “to create transformational system change to ensure equitable student achievement.” In sum, the district “had clear ideas about what needed transforming, and they ordered these ideas up for everyone,” including standards-based grading practices, a “digital-learning plan” featuring iPads for everyone, and standardized behavior practices “informed by racial-equity focused professional development.” None of these “had strong enough evidence to justify their adoption,” Kalenze writes, but “all of them had large impacts on schools’ operations, required high costs to enable, and kicked up considerable animus from the districts practitioners and parents.” Predictably, none of them did much to improve student achievement.

To his great (and bewildering) credit, Kalenze tells all this without resentment, but the upshot is clear enough. Losing the “bottom-up” improvements midwifed by Dr. Bob “eroded the overall professional culture” at Osseo High School. “Over time, teachers went from feeling that their impact was not valued to suspecting district leadership did not trust them, period.” Kalenze’s purpose is to offer some clarity around continuous school improvement before it becomes the Next Big Thing that everyone talks about but nobody does (or even understands) very well. He concludes with a list of basic improvement principles that he notes would fit onto a single PowerPoint slide, including identifying problems accurately, matching the right people to each improvement initiative, giving those people active roles in those improvements’ design and communication, and respectfully building and maintaining school-wide harmony. Kalenze’s valuable book is intended to rescue “continuous improvement” from cheerleaders and champions in the world of think tanks and Ted Talks. But it is equally useful as a cautionary tale. When something is improving, continuously stay out of the way.

SOURCE: Eric Kalenze, What The Academy Taught Us: Improving schools from the bottom-up in a top-down transformation era (John Catt Educational, 2019).

view

Texas’s shale boom boosted local tax bases. Here’s how it affected schools.

Amber M. Northern, Ph.D.
10.16.2019
Flypaper

New and fascinating research uses a creative study design and a unique data set to address whether a thriving local economy leads to better student outcomes. Specifically, it examines how the Texas boom in shale oil and gas drilling, which brought with it large and localized effects on wages and the tax base, impacted district schools.

Researchers Joseph Marchand and Jeremy Weber use the variation in shale geology across school districts to model the potential impact of the boom. Specifically they use data on the shale depth—the average distance in kilometers from the surface to the shale formation—as a measure of shale richness and a proxy for the district’s resource endowment. (Deeper shale tends to have greater pressure, so it is more productive and profitable.) They compare results in the districts located at the shale formations versus those outside the formations.

The sample includes over 1,000 school districts for which shale geologic data were available and focuses on shale oil and not the natural gas formations. Districts are followed for fourteen years, from 2001 to 2014. The district outcomes of interest are school finance, spending, labor market outcomes, composition of the student and teacher body, and student achievement outcomes. Analysts use a couple different models, including a district fixed effects model, but both are essentially looking at how outcomes change over time based on shale depth. They also look only at the “within-shale” sample because “non-shale” districts may be quite different than those with shale.

In a nutshell, they find that the percentage of students passing standardized tests in the average shale oil district declined relative to districts outside of any shale formation, even relative to districts with below-average shale geology. There were no clear differences relative to college completion rates or participation and performance on college entrance exams. Attendance rates also slightly declined as a result of the boom.

These declines occurred despite that fact that, over the entire period, the total tax base of an oil district with average shale depth grew by over a staggering $1 million more per student, relative to non-shale districts. This led school districts to lower property tax rates, borrow more, and spend more.

Analysts found that most additional spending went to capital projects or to service debt, with none going to payroll or teacher salaries, despite the fact that two-thirds of total school spending goes to payroll. Analysts say that the capital spending may stem from a state’s focus on equalizing operational spending—but not facility spending—across districts. Unlike operational spending, districts must fund facilities almost entirely through local property taxes, but with an expanded tax base, they can issue bonds and service them without increasing property taxes. (Plus if and when the boom goes bust, they aren’t on the hook to maintain higher salaries this way.)

The boom also widened the gap between private and education sector wages. Specifically, the average shale district experienced nearly a 20 percent increase in the private sector wage. Student composition also changed, but in a way that moderated the decline in achievement since there was a decline in economically disadvantaged students—most likely as a result of extra family income. Finally, the boom was linked to increased teacher turnover, and it led to more inexperienced teachers in the classroom. The overall negative effect of shale development on student achievement likely stems in part from this turnover and the decline in teacher quality.

So in the end, the boom strengthened the local economy, raising wages and adding new jobs. All good. But it didn’t improve student achievement, perhaps because it lured more experienced teachers to leave the classroom. Moreover, it no doubt resulted in some ecstatic kids and teens who are now enjoying stunning school buildings, decked out science labs, fancy gyms, and professional-grade football fields.

SOURCE: Joseph Marchand and Jeremy Weber, “How Local Economic Conditions Affect School Finances, Teacher Quality, and Student Achievement: Evidence from the Texas Shale Boom,” Journal of Policy Analysis and Management (August 2019).

view

The Education Gadfly Show: Why the Big Easy’s big gains are over

10.16.2019
Podcast

On this week’s podcast, Doug Harris, director of the Education Research Alliance for New Orleans, joins Mike Petrilli and David Griffith to discuss the progress, and recent plateauing, of NOLA’s ed reforms. On the Research Minute, Amber Northern examines how earning college credit in high school
via AP exams affects postsecondary course-taking.

Amber's Research Minute

Oded Gurantz, "How college credit in high school impacts postsecondary course-taking: the role of AP exams," Education Finance and Policy (2019). 

Fordham Logo

© 2026 The Thomas B. Fordham Institute
Privacy Policy
Usage Agreement

National

P.O. Box 110
Burke, VA 22009

202.223.5452

[email protected]

Ohio

P.O. Box 82291
Columbus, OH 43202

614.223.1580

[email protected]

Sponsorship

130 West Second Street, Suite 410
Dayton, Ohio 45402

937.227.3368

[email protected]