
What happens to initially high-achieving students from high-poverty families as they move through elementary school? In the opening of his new book, How the Other Half Learns, Robert Pondiscio worries about these students while teaching fifth grade in the South Bronx. Tiffany is bright, pleasant, and earning good grades. But his assistant principal instructs him that top students like Tiffany will be fine; it’s the low achievers he needs to focus on.
As a result, Pondiscio views any reform from the lens of what he calls “The Tiffany Test”: “will this make it more likely or less likely that kids like Tiffany—promising low-income children of color—will get what they need to reach their full academic and life potential?”
We can begin to answer this question now that a majority of states have been giving assessments aligned to college and career-ready standards. Eleven states, educating 9.9 million students (20 percent of the U.S.) participate in the Smarter Balanced consortium. The Tiffanies from California to Washington, to Connecticut and Vermont are doing worse, and better, than one might hope for.
To see this, we can’t compare this year’s fifth graders to last year’s, as most states do. Instead, we need to follow the same groups of students and see how their achievement changes over time. We can take publicly available data to create groups of students by when they will eventually graduate from high school. Last year’s fifth graders will graduate in 2026, sixth graders in 2025, and so on. While classes can rise and fall within schools, as families move across neighborhoods, the size of the groups remains stable across most states and districts.
Across three classes of students—those who will graduate high school in 2024, 2025, and 2026—in the Smarter Balanced states, the slide is “only” 8 percentage points, as Figure 1 illustrates below. But this is a substantial number. 181,000 fewer students in fifth grade are meeting and exceeding math standards than they were as third graders. In California, Washington, and Connecticut, where subgroup data are available, 86,000 of these students are from economically disadvantaged families.
Figure 1. Slide in mathematics achievement, as determined by meeting or exceeded state standards, classes of 2024, 2025, 2026
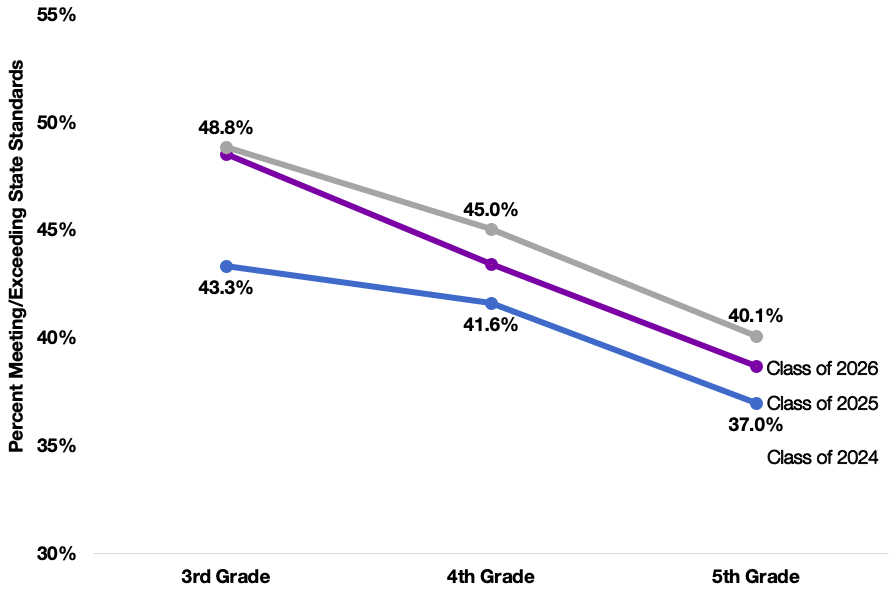
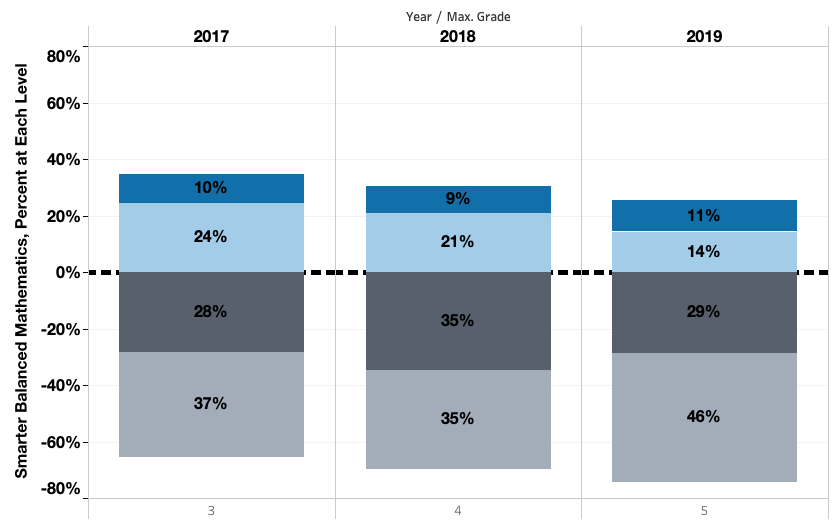
It’s not just that a few elementary students like Tiffany who had been successful in third grade have fallen just below the proficiency cut score. In every class of economically disadvantaged students in California, Washington, and Connecticut, more students are scoring at the lowest levels in math as they progress through elementary school. For example, Figure 2 below shows the math achievement of low-income students in the Class of 2025 as they move through elementary school. The gray bars (Levels 1 and 2) are increasing, and the blue bars (Levels 3 and 4) are sliding downward.
Figure 2. Math slide for California’s economically disadvantaged students (class of 2025)
What might explain the slide in math?
First, the “mile wide and inch deep curriculum” problem William Schmidt identified takes time to undo. Too many textbooks in use still haven’t made the shift in focus and coherence expected by the new math standards. Forty-two percent of math teachers the Fordham Institute surveyed in 2016 reported that the math materials available to them are not well aligned with the Common Core. While EdReports.org is helping to raise the quality of learning materials, many of the textbooks in the field still cover less than 50 percent of the major work expected of the grade.
Shelbi Cole of Student Achievement Partners says there is still a substantial mismatch between the questions used in textbooks and the tasks on the assessment. As an example, many of the texts have a large number of word problems in the K–5 Number and Operations in Base Ten (NBT) domain, but this is not the case on the Smarter Balanced test, which emphasizes conceptual understanding and procedural skill aligned to the expectations of the standards.
Second, the new standards lay out a progression for teaching fractions that’s still taking teachers time to get adjusted to. Before the Common Core, addition and subtraction of fractions were introduced anywhere from third to seventh grade. Now unit fractions are introduced in third grade and developed in a careful sequence that extends partially into sixth grade. Teachers and their students may still struggle with understanding the logic underlying the algorithms of multiplying and dividing fractions.
Math knowledge and skills are cumulative, writes Joel Rose in his recent report, “The Iceberg Problem.” Two-thirds of sixth graders in their urban schools have considerable unfinished learning from earlier grades. They enter math classrooms at least two years behind.
Third, there may still be too much test prep crowding out learning time, says Patrick Callahan, former co-director of the California Mathematics Project and a consultant to several school districts. “For example,” he says, “there are too many weekly or daily practice test items that are never discussed or analyzed. This over-practice can reinforce misconceptions and misunderstandings rather than address and correct them.”
Research by David Blazar and Cynthia Pollard finds that math teachers’ test-prep lessons are of lower quality than when the same teachers aren’t prepping students for the test.
These are only initial hypotheses. States and districts would be well served by gathering expert elementary math teachers to investigate the causes of the slide more thoroughly.
We also need to build cases studies of individual student success and failure. Investigate a group of students who started out meeting standards in third grade and determine why they have slipped as fifth and sixth graders. Assemble a complete picture of their academic and social foundations. Similarly, we need to review a group of students who initially weren’t meeting standards and have grown to reach them. This will help us ensure future Tiffanies get all they need to be academically successful.
Part II, to be published next week, will summarize the surprisingly good news in reading and writing. Stay tuned.