
Governor DeWine is right: Ohio must stop funding “empty desks”
School funding guarantees have been a much-discussed element of Governor DeWine’s proposed

School funding guarantees have been a much-discussed element of Governor DeWine’s proposed




School funding guarantees have been a much-discussed element of Governor DeWine’s proposed biennial budget. At a press conference unveiling his proposal, the governor stated: “It is time that…we no longer fund empty desks; we will not be funding phantom students.” True to his word, his outline dials back “guarantees,” which provide excess dollars to protect districts from funding reductions that are otherwise prescribed under the formula.
In his comments, DeWine alluded to the continuing enrollment declines in Ohio school districts as the rationale for reducing guarantees. Indeed, when districts serve fewer students, an enrollment-driven formula (which Ohio has) will usually prescribe lower funding levels than before. This is a perfectly rational and fiscally responsible approach. Hospitals should receive less public subsidy when they serve fewer patients. Spending on unemployment benefits should decline when more people have jobs. In a similar vein, governments should scale back funding when schools educate fewer students.
Yet hot on the heels of the governor’s proposal, school funding guru Howard Fleeter seemed to downplay the role of enrollment declines in guarantee funding. He told Gongwer, “This idea that the only reason you’re on the guarantee is that you’re losing enrollment, that’s the thing that I think is disingenuous.” In the Cleveland Plain-Dealer, he called it a “myth” that enrollment declines are driving guarantees.
Fleeter is correct that the “only” reason for being on the guarantee isn’t lost enrollment. Districts with increasing wealth—rising property values and resident incomes—also stand to lose state aid under Ohio’s progressive funding formula. To ensure that poorer districts receive more assistance, the formula prescribes them more funding. However, if a district gets steadily wealthier, its formula funding may be lower than in the past. That’s only fair.
Mason City Schools in suburban Cincinnati is the prime example of a district on the guarantee due to growing wealth. From 2020 to 2024, its local tax revenues soared from $59 to $96 million, a 64 percent increase that easily outpaces the statewide average of 18 percent. Underlying the rise in local revenues is a significant increase in property values (up 20 percent) and resident incomes (up 21 percent). The formula takes into account Mason’s rapid gains in local wealth, and in turn reduces its prescribed state aid.[1] However, the guarantee does an end-run around the formula and protects the district from that funding loss. This year, Mason received the largest guarantee subsidy in total dollars statewide ($14 million).
So yes, trends in local wealth factor into the guarantee. But enrollment remains a significant factor. Consider Table 1 which shows the districts that experienced the largest enrollment losses over the past five years (more than 20 percent). Fourteen of the nineteen districts are on the guarantee, while three more (starred) are on a guarantee that benefits very small districts and is tucked inside the formula’s “base cost” model.[2] Only a couple of the rapidly declining districts are not on the guarantee, likely due to slower growth in local wealth and other variables.[3] Looking at guarantee versus non-guarantee districts more broadly, the bottom rows of the table shows that guarantee districts overall have suffered larger enrollment loss within the past five years than their counterparts (-8.1 versus -4.7 percent).
Table 1: Districts with the largest enrollment declines and guarantee funding
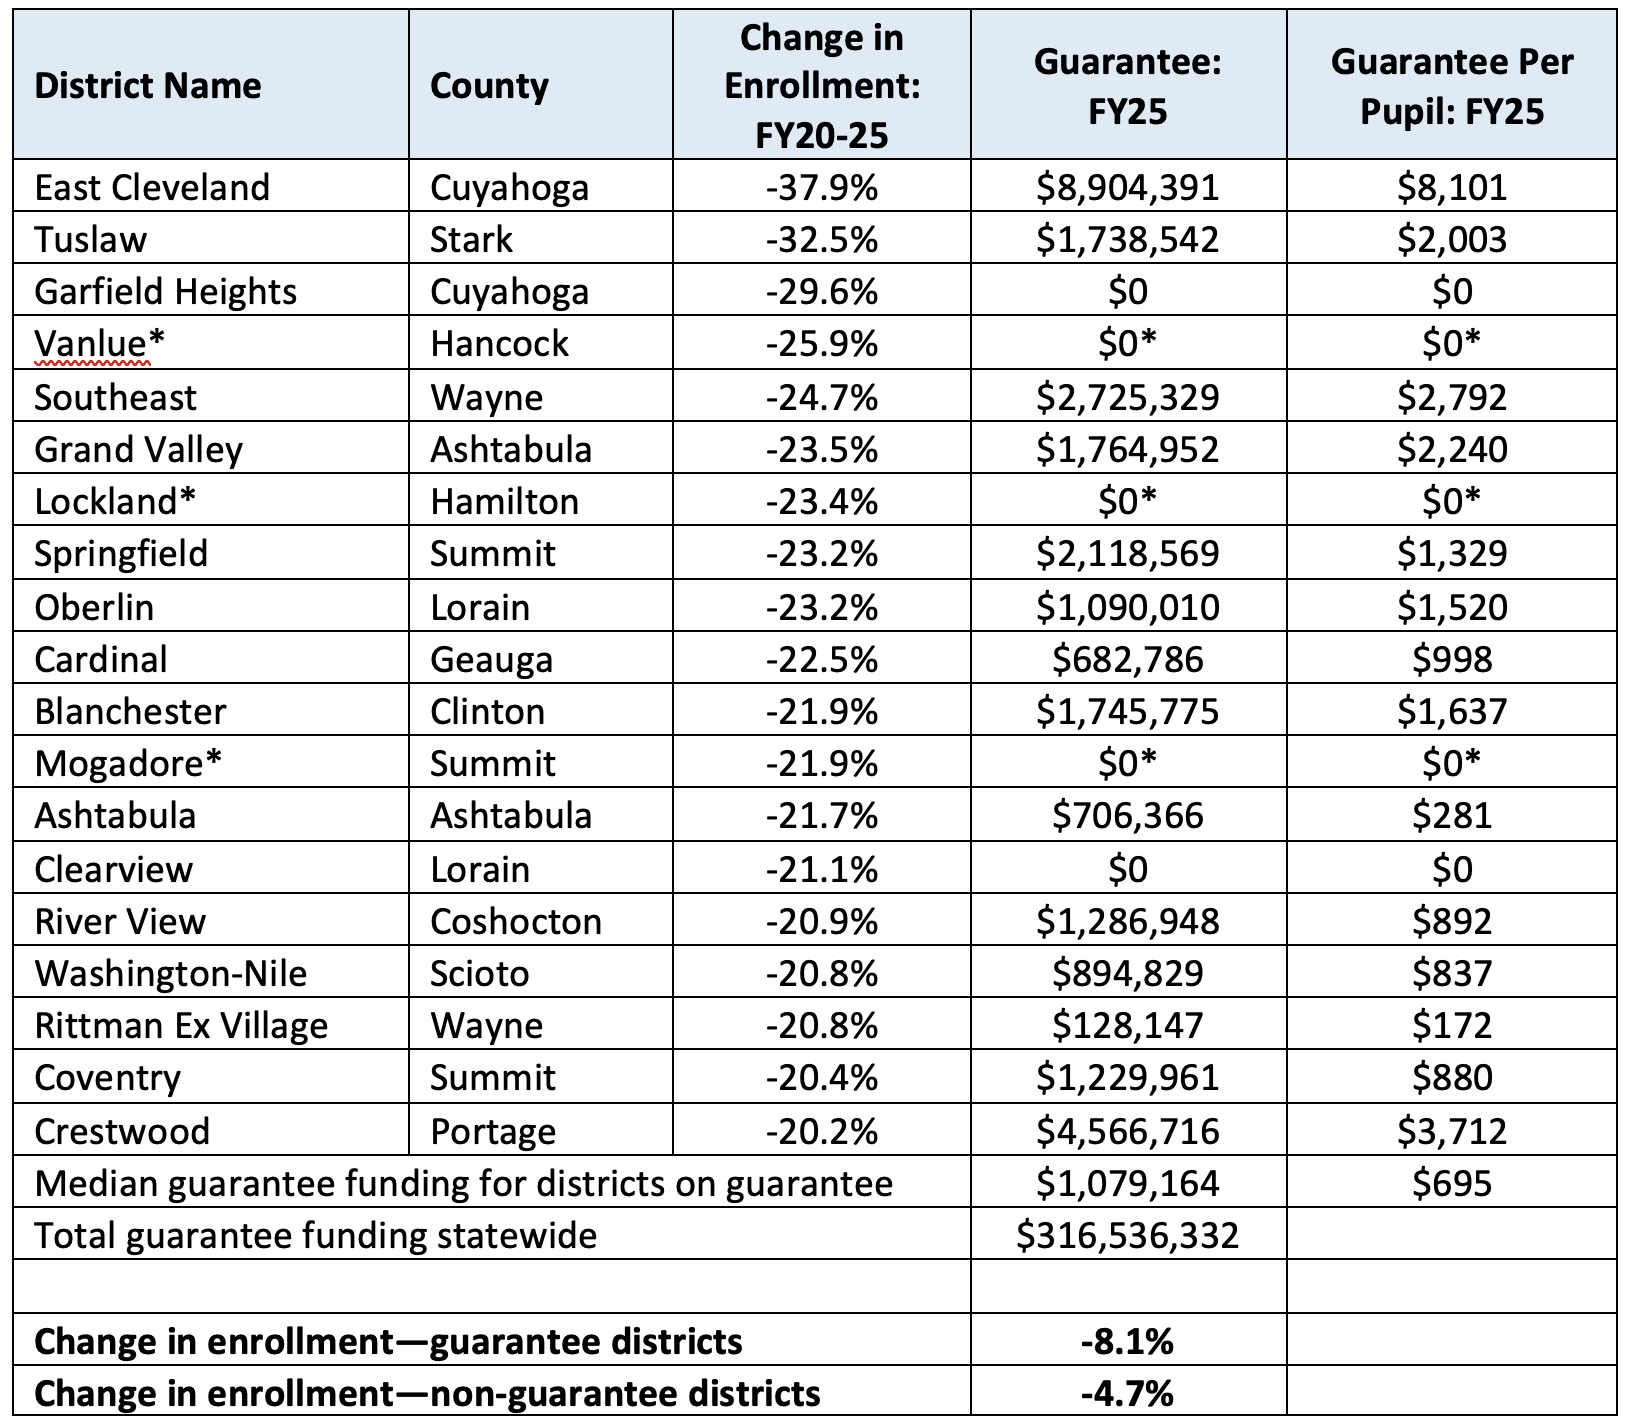
Notes: Table displays the districts with enrollment declines of more than 20 percent from 2019–20 to 2024–25. The “guarantee” represents funds from the two main guarantees elements in the current system, known as “temporary transitional aid” (guarantees based on FY20 funding levels) and “formula transition supplement” (guarantees based on FY21 funding levels). (*) Denotes small districts (less than 750 students) that benefit from a staffing minimum guarantee embedded in the formula’s base-cost model, the amount of which is hard to determine.
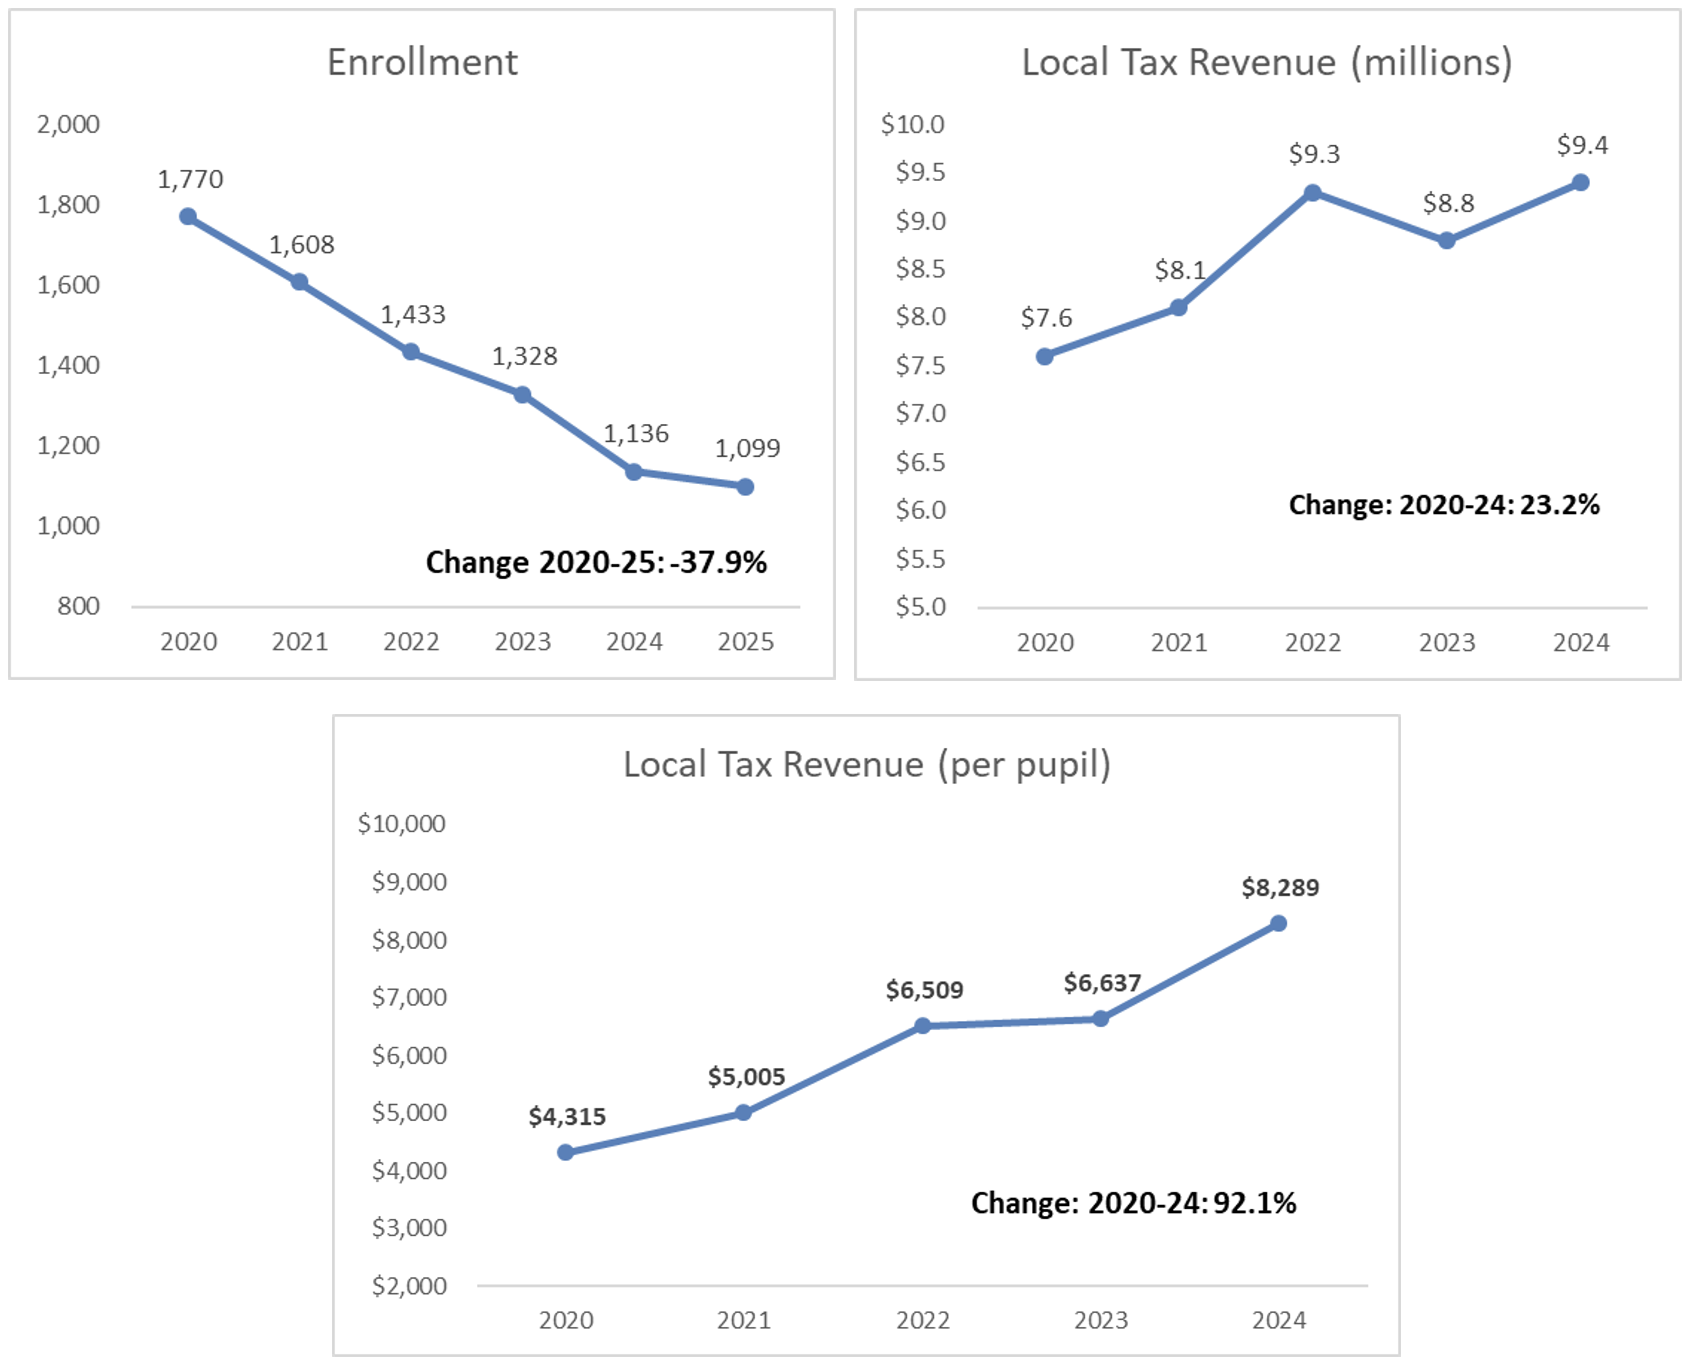
At the top of Table 1, we see East Cleveland. It is an undeniable example that sharp enrollment declines can put districts on the guarantee—proof that taxpayers are indeed funding “empty desks.” Over the past five years, the district has been the state’s biggest enrollment loser, shedding a remarkable 38 percent of students. To put it another way, in a classroom that once had twenty students, there are now eight “empty desks.” Despite its nearly half-empty classrooms, the district receives a massive subsidy from the state that amounts to an astronomical $8,101 per pupil in guarantees, the largest sum on a per-pupil basis statewide. Making things even more absurd, the district has actually gained in local wealth, which—when combined with the enrollment slide—has nearly doubled its local revenues per pupil.[4]
Figure 1: East Cleveland’s enrollment, local revenue, and local revenue per pupil
***
As you can tell, school funding is pretty complicated. But let me boil it down to three basic ideas when it comes to guarantees:
First, removing guarantees is a step towards a fairer school funding formula in which all districts receive state aid via formula. Conversely, guarantees only prolong Ohio’s “patchwork” system, where some districts are funded via formula, while others are on guarantees.
Second, giving guarantees to districts that have more local wealth undermines the core principles of a progressive, fair funding formula. Their budgets are growing thanks to increased local support, and the state should pare back its funding allotments and send them to districts more in need of the aid.
Third, districts serving fewer students should receive less state aid under a fair funding plan. Rather than propping them up—on the backs of taxpayers—Ohio should expect districts to tighten their belts when they are losing students.
In the coming days, if lawmakers can withstand the onslaught of the education establishment, we should get one step closer to a formula that is truly fair to schools, students, and the citizens of Ohio.
[1] Mason’s enrollment declined from 2020 to 2025 (-3.3 percent), which magnifies the increase in local funding on a per-pupil basis (up 69 percent).
[2] This refers to a “staffing minimum” that boosts the formula funding for low enrollment districts (under 750 students). Their helps to keep smaller districts—including those losing enrollment—off the main guarantees, since their formula prescriptions are more likely to exceed their historical funding levels (the previous formula did not include these minimums). The value of the staffing minimum guarantee is difficult to determine.
[3] Garfield Heights appears not to be on the guarantee due in part to a sizeable increase in DPIA funds. It now reports 99 percent “economically disadvantaged” students (due to CEP) versus just 55 percent in FY19, the last year the previous formula was functional. Clearview appears to have experienced a large increase in “targeted assistance,” suggesting that its local wealth has grown slowly compared to the median district.
[4] East Cleveland’s property valuation in FY23 (most recent available) was $161 million versus $138 million in FY20; resident incomes have also gone up in recent years.

It’s mid-March, which means Ohio policymakers are knee-deep in a biennial budget process that will result in plenty of policy changes. For Governor DeWine, it’s the last one—term limits guarantee that the next time a state budget rolls around, Ohio will have a new governor.
One of the hallmarks of the DeWine administration has been a concentrated push to improve early literacy. During the 2023 state budget, DeWine established a statewide initiative grounded in the science of reading, an evidence-based instructional approach that focuses on phonics and knowledge-building. The initiative included requirements and provided funding for schools in areas such as high-quality curriculum, professional development for teachers, and literacy coaches.
Implementation of these efforts got off to a good start in 2024. But there’s still a huge mountain to climb, and not just in reading. Math achievement in Ohio is equally lackluster. Fortunately, Governor DeWine’s 2025 budget proposal picks up where he left off in 2023 and adds numeracy to the mix. Several promising ideas for reading and math were recommended by the governor, including expanding access to advanced coursework, establishing universal screening tools in early grades, and providing additional funding for literacy professional development. But let’s not stop there. Lawmakers could do even more on the math and reading fronts. Let’s examine four ideas.
1. Require DEW to undertake a review of core math curricula and create a list of high-quality instructional materials.
A key feature of Ohio’s early literacy initiative is its emphasis on high-quality curriculum and instructional materials. Starting last year, public schools were required to adopt curricula and materials that appear on a state-approved list of high-quality options. The Department of Education and Workforce (DEW) established this list, which is updated periodically, via an intensive review of reading curricula that’s currently on the market. If implemented faithfully, this policy should ensure that every public school in Ohio is using materials that are aligned with the science of reading.
Given Ohio’s continued struggles in numeracy, lawmakers should establish a similar process for math. Directing DEW to review the core math curricula (grades K–12) that are currently on the market, assess their alignment with state math standards and evidence-based practices, and establish a list of high-quality options should help local leaders make wise curricular decisions moving forward. Unlike with reading, lawmakers should not require districts to adopt materials from this list (at least not yet). For now, they should focus solely on identifying high-quality options on which district leaders can feel confident spending taxpayer dollars.
2. Require state report cards to identify the reading and math curriculum used in each school and whether it’s been designated by DEW as high-quality.
Current law requires Ohio districts and schools to report to the state the core curricula and instructional materials they use in English language arts in grades PK–5. This requirement allows state leaders to ensure that schools are following the rules and using evidence-based materials. As mentioned above, Ohio does not have a state-approved list for math curricula, and DeWine’s budget doesn’t call for one. But it does call on districts to report to the state the core curricula and instructional materials they’re using in math. This is a wise move that should give state leaders a clearer picture of which math materials are being used across the state. But lawmakers can and should do more. Adding a requirement for DEW to identify districts’ chosen curricula on their state report cards and note whether they’ve been designated by the department as high-quality should improve transparency with the public and provide an incentive for districts to use high-quality materials.
3. Establish a minimum passing score for the math subsection of the elementary licensure content exam.
To be licensed in Ohio, teachers are required to pass several exams. For the most part, these tests fall into two equally important categories: pedagogy (how you teach) and content (what you teach). As part of their licensure requirements, middle and high school teachers must pass math-specific content knowledge exams. Doing so signals that they’ve mastered the content they will be expected to deliver to students. But Ohio doesn’t currently require elementary teachers to pass a math-specific test. Instead, they take a composite content knowledge exam that combines math with other subjects.
Because teachers are only required to achieve an overall passing score, high performance in these other subject areas could easily mask math deficiencies. As such, it’s possible that some of Ohio’s elementary educators don’t have a firm grasp on math content. Given the importance of ensuring that young students have a strong numeracy foundation, it’s crucial to ensure teachers’ content mastery. The best way to do that is to establish a minimum passing score for the math subsection of the elementary licensure content exam and require prospective teachers going forward to meet or surpass that score before they can teach math.
4. Require DEW to create and maintain a public, annually-updated dashboard that tracks the state’s early literacy reform efforts.
Ohio has invested significant time, effort, and funding into improving early literacy outcomes. State report cards and national assessments will help leaders track improvement (or lack thereof) from year to year and among student subgroups. But these resources cover a broad range of outcomes, including test results in other subject areas. And they can be difficult for parents and stakeholders to navigate. Establishing a dedicated early literacy dashboard that’s available online and tracks K–3 reading outcomes at the state, district, and school level would make the results of Ohio’s literacy efforts much easier to track. Ensuring the data are disaggregated by student demographics would empower stakeholders to keep a close eye on improvements among traditionally underserved students. Parents and families would have another tool at their disposal to help them make school choice decisions. State and local leaders could use the dashboard to champion districts and schools that are doing excellent work. And state officials wouldn’t need to start from scratch. Colorado offers a stellar model they could work from.
***
With his 2025 state budget, Governor DeWine has cemented himself as a champion for early literacy and signaled the importance of numeracy. Now, it’s up to legislators to build on his solid foundation. Here’s hoping they incorporate some of the above ideas into the final version of the budget.

Debate on the biennial state budget is in full swing, as Governor DeWine has unveiled his proposals and House lawmakers are now holding committee hearings. Through the amendment process, the chamber is expected to put forward its plan in April and send the legislation over to the Senate. The Fordham team has already taken a close look at several of the big topics in the governor’s plan for K–12 education (charter schools, literacy and numeracy, student attendance, career planning, and guarantees). This piece covers three additional issues worthy of attention.
Cost of updating the funding formula inputs
It sounds incredibly arcane, but one of the biggest discussions right now revolves around updating the “inputs” of the school funding formula. As a quick refresh—and see here for a longer explanation—Ohio’s current formula (the Cupp-Patterson model) uses a series of inputs to determine base per-pupil funding from the state. These inputs include average teacher salaries and benefits, building expenses, and a whole lot more. Ohio currently uses input data from FY22 (e.g., salaries from that year) in the formula, and public-school advocates have been pushing hard for an update to FY24. Because of rapid inflation, the use of more current data would push up state education spending significantly.
While it seems like an “easy” update (at least technically), it’s hard politically, because it comes with a very steep price tag. This a possible reason why the governor (who has stressed fiscal discipline) didn’t propose it, and is likely behind Speaker Huffman’s comments about the formula being “unsustainable.” Indeed, according to estimates that I’ve seen, the update would cost the state roughly $850 million over the next two years—an 11 percent increase in state education spending by FY27 compared to FY25. This added cost goes above and beyond the governor’s proposed $250 million (2.5 percent) bump over the biennium. That’s a lot of money to spend, especially at a time when the state budget is tightening and the national economic outlook is becoming cloudier.
We at Fordham have long raised concerns about the costs of Cupp-Patterson’s inputs-driven model, and now this General Assembly has some tough questions to wrestle with. Will they find enough room in the budget to drop hundreds of millions more into the formula? Or will they take a pass on the update, presumably kicking the can to future lawmakers to make (bigger) “catch-up” payments down the road? Might they get fed up with the formula’s expense and simply put a fork in it? Or will they seek a compromise that reins in its costs but preserves the underlying structure? No one knows exactly how it’ll all play out. But it’ll be fascinating to see how the debate over the $850 million “update” unfolds.
Funding high-quality industry credentials
Under Governor DeWine’s leadership, Ohio has invested millions in supporting high schoolers’ attainment of industry-recognized credentials (IRCs). The headliner in this area has been the Innovative Workforce Incentive Program (IWIP), which provides reimbursements to schools when students earn an industry credential in selective, high-priority career fields (e.g., manufacturing, IT, and healthcare). These credentials can give students an edge as they pursue in-demand careers that require technical skills. In past budgets, schools were eligible to receive up to $1,250 per IWIP credential. However, due to increasing attainment of these credentials and a limited budget appropriation, the reimbursement rate had to be scaled back in FY24 to just $550 per credential.
The governor’s budget does increase IWIP funding from $10.5 to $16.0 million. That’s a step forward, but it’s still not quite enough. In fact, his budget proposes to reduce the maximum reimbursement to $750 per credential to fit the new appropriation. While that creates more realistic funding expectations, the governor should have prioritized this important initiative and allocated a higher overall appropriation to accommodate both the increasing participation in IWIP programs and support the originally intended reimbursement of $1,250. With any luck, House and Senate lawmakers will see the importance of incentivizing IWIP credentials and enlarge the allocation.
Finally, on the topic of industry credentials, kudos to the governor for discontinuing funding that covers credentialing testing fees ($5.5 million, this year). The problem Ohio is running into is that students are accumulating more and more credentials, but many of them have little value in the workplaces (including hundreds that are not on the IWIP list). Yet under current policy, the state covers testing fees for these low-level credentials. That should stop, and the governor was right to pull the plug. Note that testing fees for high-value IWIP credentials would still be covered through that reimbursement program.
Money for academic distress commissions?
One of the more eyebrow-raising allotments in the governor’s budget is $2 million over the biennium to support academic distress commissions (ADC) in East Cleveland and Youngstown. While this is less than the prior budget’s allocation for ADCs ($3.5 million), it’s still a surprise to see funds set aside. Over the past several years, lawmakers have gutted this policy, which had originally sought to transform Ohio’s lowest-performing school districts. The initial policy called for a chief executive officer who had “complete operational, managerial, and instructional control of the district,” while the commission itself—the majority of whom are state appointees—appointed the CEO and oversaw an improvement plan. After hearing constant complaining about state overreach from district officials, lawmakers relented in 2021 and walked back the ADCs. The chief executives are now gone, the commissions have been made toothless, and governing authority has been handed back to the local school boards. All districts have to do is create an improvement plan, and meet a majority of goals in that plan to be released from any commission oversight.[1]
Given the dramatic rollback of state accountability and intervention through ADCs, it’s puzzling that the state would spend money to support the now-feeble effort. And don’t shed a tear over these districts losing funding, either. East Cleveland receives—by far—the most state funding per pupil in Ohio: a whopping $25,260 per student in 2024, a large chunk of which comes through guarantees (largely money for students the district no longer serves). Youngstown received the eleventh most state funding at $14,541 per pupil, a portion of which also came through guarantees. If ADCs were a serious turnaround effort, setting aside state funds in support would be wise. But the policy is now but a shell, and these dollars would surely be better spent elsewhere.
* * *
In the days ahead, state lawmakers will be making important decisions about how to spend taxpayer dollars while also working to craft a fiscally responsible budget. In the area of K–12 education, they should think hard about which programs and initiatives are best positioned to deliver a quality education for Ohio students. Investing in high-quality credentials, effective literacy programs, and high-quality schools of choice should breeze through, but initiatives that are unlikely to improve student outcomes should receive more scrutiny. The stakes are high, and lawmakers need to continue using school funding levers to drive higher achievement throughout Ohio.
[1] A third district, Lorain, was also overseen by an academic distress commission, but in a special carveout, it was removed them from this status in 2023.

Last year, during his state of the state address, Governor DeWine called on the legislature to “make a very simple fix in statute to insert career planning into existing graduation plan requirements.” The requirements that he references mandate that every Ohio student in grades nine through twelve who attends a public or chartered non-public school have a graduation plan that maps their academic pathway to a diploma. These pathways include course and graduation requirements and must be updated each year until the student graduates.
When the governor released his state budget recommendations a few weeks ago, it wasn’t a surprise to see that he followed through on his career planning idea. After all, DeWine has prioritized expanding and improving career pathways since taking office, and providing students with high-quality career planning is a key part of ensuring that pathways live up to their potential. He was also right that it only required a simple change in law. Rather than a “graduation plan,” students going forward would be required to have a “graduation and career plan.”
As simple as the change itself is, implementation will be much more complicated. To support the transition, DeWine charged the Department of Education and Workforce (DEW) with adopting rules regarding the content of graduation and career plans. This is crucial because, although DEW currently publishes a template, districts and schools aren’t required to use it. That means plans can look wildly different from school to school or even student to student. Under this framework, well-meaning district leaders could struggle to identify what should and shouldn’t be included. Meanwhile, there’s no way for the department to ensure that every student ends up with a document that’s actually helpful. DEW can and should give schools some freedom about how to design their plans. But setting expectations and guardrails around what must be included is the best way to ensure that all students benefit.
It’s important to note that although DEW would be responsible for adopting rules, the budget includes some additional stipulations. For example, just like their predecessors, new plans must address how a student will meet curriculum and graduation requirements and must be updated each year. But under the budget, plans would also be required to identify post-graduation career goals and align the student’s high school experience to those goals. For example, if a student wants to go into a STEM field, then her graduation and career plan would likely map out high-level math and science courses. If she wants to work in cybersecurity, then her plan could include CTE courses (some of which could lead to college credit) and industry-recognized credentials. And if she wants to be a teacher, her plan might mention the state’s Grow Your Own Teacher Scholarship program.
This kind of alignment probably seems like a no-brainer. If a student wants to be an engineer or a cybersecurity analyst after they graduate, then of course they should be taking courses and earning credentials that will prepare them for that career. But for a lot of Ohio students, that’s not how high school works. It should be, especially since Ohio schools have been required to have career advising policies since the 2015–16 school year. But nearly a decade later, thousands of students still graduate each year with no idea how to pursue their interests or even what they’re interested in.
Don’t just take my word for it, though. In an interview last year, DEW Director Steve Dackin observed that “most kids were led to believe that their primary opportunities would be either in college or the military.” Because knowledge of their options is so limited, “they’re at a deficit. If you ask a kid, ‘What do you want to do when you get out of high school?’ they’re void of much information about what’s available.” By requiring schools to help students craft graduation and career plans that align with their interests and future goals, the budget takes a huge step toward solving this problem.
But there is one significant thing that’s missing. For these planning efforts to be truly beneficial, students need an in-depth opportunity to explore career fields and their associated educational pathways. It’s equally important that they are provided with this opportunity in middle school, so they have a better idea of which courses—traditional academic, career-technical, or both—they want to take in high school.
The best way to make this happen is to require all students to complete a career exploration course, equivalent to at least one semester of instruction, during grades 6–8. Lawmakers should charge DEW with outlining required course activities and instruction and creating a model curriculum. Course content should cover each of Ohio’s career fields, including available jobs within each field; the training (and training costs) required to obtain those jobs; salary ranges; Ohio regions where each field or job is most in demand; and projected job growth. Students should also be required to complete at least one aptitude or interest survey/assessment (like YouScience). Based on DEW’s guidance, districts and schools could design and offer this course, partner with a qualified organization to provide it, or pursue a state-approved alternative in collaboration with their CTPD and Business Advisory Council.
Getting courses up and running will take a significant amount of work. But the benefits would be huge. Students would be able to link academic work to their unique interests and the real world, which could have a profound impact on student engagement. And with a career exploration course under their belt, every ninth grader would walk into their high school empowered to make informed decisions about how to spend their next four years. This could lighten the load for school counselors and staff, as they would go from working with students who have little to no knowledge of their options and interests to working with students who are well-informed. Parents and families would have an additional opportunity to be involved in helping their kids plan for the future. And Ohio’s institutions of higher education and its employers would benefit from students who are more knowledgeable about what they want and how they can get it.
Planning for the future can be scary. But knowledge is power, and Ohio leaders have a responsibility to ensure that every student is equipped with the knowledge they need to prepare for their future. Requiring schools to help students craft career plans is a great start. But ensuring that students have the information and tools they need to take advantage of those planning opportunities is just as important.

School systems across the country (and world) have been implementing limitations or outright bans on student smartphone use during the school day in an effort to improve the educational experience for young people. Improvements have been predicted along many dimensions: attention span, academic achievement, mental wellbeing, disciplinary referrals, and even absenteeism. But as ever, researchers are scrambling to catch up to this widespread and fast-moving policy development. A new report from the United Kingdom aims to provide some early data on the mental health impacts.
Researchers at the University of Birmingham in England launched a study in 2022 that uses a multi-method cross-sectional observational design. They will eventually evaluate the impact of school phone policies on a wide range of outcomes, including sleep, physical, activity, and educational achievement. But for now, the most recent report focuses on the important component of student mental wellbeing.
The research team compares students from a set of twenty English secondary schools (ages 12–15) that have restrictive smartphone policies and ten with permissive policies. In restrictive schools, phones were not allowed to be used during the school day for recreational purposes, and were required to be left at home or turned off and stored (personal bags, school lockers, electronically-sealed pouches, etc.) during the full school day. In permissive schools, phones were allowed to be used at any time or at certain times (such as lunch or class changes) and/or in certain areas (like hallways or outside the building).
The team recruited students in September 2022 and January 2023 from the various schools via flyers and emails. The final sample size was 817 students from restrictive schools and 406 students from permissive schools. The main outcome of interest was mental wellbeing, as assessed twice during the project using the Warwick-Edinburgh Mental Wellbeing Scales. This fourteen-item survey provides statements like “I’ve been feeling optimistic about the future” and “I’ve been feeling close to other people” and asks for a response on a five-point scale from “none of the time” to “all of the time.” Secondary data captured included smartphone and social media usage, as recorded by an app on student phones and as reported on student surveys. The researchers used mixed effects linear regression models to explore associations between school phone policy and participant outcomes, and between phone and social media use time and participant outcomes.
As expected, students attending schools with restrictive smartphone policies recorded lower phone and social media time use during the school day. Average phone use approached one hour for permissive schools, but just short of eleven minutes for restrictive schools. Average social media use was nearly eradicated during the school day in restrictive schools (under two minutes) compared to half an hour in permissive schools. However, there was no statistically significant difference in overall use of smartphones and social media between the groups of students during weekdays—implying that students in restrictive schools “made up time” on their devices before or after school—or on weekend days. The typical student in both groups used their phones for approximately 1.7 hours per day on a weekday and approximately 2 hours per day on weekend days.
Similarly, mental wellbeing scores were nearly identical among students in both groups. The mean overall was 47 on a scale of 0 to 70 (highest score), indicating a “medium level” of wellbeing according to the survey instrument. The mean for students in permissive schools was 48; restrictive schools, 46. And there was no evidence of a difference between groups when the researchers controlled for variables such as gender, income, and student achievement levels. However, increases in both smartphone use and social media time were associated with increases in anxiety and depression scores (that is, specific subsets of questions) on the wellbeing survey.
These data indicate that more device usage time does lead to more anxiety and depression for young people, as many pundits and policymakers suspect. But they also indicate that smartphone restrictions in schools do not impact mental wellbeing in students. Schools that restrict phone usage when students are on campus are doing their part to combat the problem, but that is not enough in itself to see a positive impact. The authors suggest that such school-based policies require further development if they are to ever successfully address that goal, but it seems likely that a more ambitious effort is required to successfully curtail phone and social media usage to the levels needed.
SOURCE: Victoria A. Goodyear et al., “School phone policies and their association with mental wellbeing, phone use, and social media use (SMART Schools): a cross-sectional observational study,” Lancet Regional Health Europe (February 2025).

Aaron Churchill and Chad L. Aldis
In January, federal officials released fourth and eighth grade math and reading scores from the 2024 National Assessment of Educational Progress. Results nationally and in Ohio were abysmal, especially in reading, where scores slid yet again after the pandemic-impacted plunge in 2022. Yet a few states—most notably Louisiana and Mississippi—have bucked these trends and shown improvements in reading. It’s likely no coincidence that both states have been at the forefront of ambitious literacy reforms centered around high-quality curricula and the Science of Reading.
Ohio has only recently begun its turn to the Science of Reading (SoR), an evidence-based approach that emphasizes phonics and knowledge-building curricula. Under the leadership of Governor Mike DeWine, lawmakers enacted provisions in 2023 that require schools to implement the Science of Reading starting sometime this school year (2024–25). To support the effort, Ohio has dedicated $168 million to help cover new curricula purchases, to fund teacher stipends for professional development, and to support literacy coaches.
The new policy represents a big shift for Ohio schools. But how are classroom teachers—the ones being called upon to change their practices—feeling about this whirlwind of change? Do they generally view the shift to the Science of Reading as a positive development, or is there widespread skepticism? Are they starting to use high-quality curriculum, or are they turning to other materials when they close their classroom doors? How often do they report using scientifically-based instructional strategies versus non-aligned practices?
To learn more about teachers’ views, we partnered with Johns Hopkins University’s Institute for Education Policy to survey grade K–3 reading teachers working in a representative sample of schools statewide. A total of 402 teachers took time out of their busy schedules to participate in the survey during fall 2024.
From this survey, we see a mix of promising news and signs of work ahead.
On the upside, teachers report significant changes occurring in literacy instruction—and most view these shifts positively. For instance, 81 percent of teachers say they’ve “noticed changes” in their schools’ literacy instruction over the past year. Most teachers (57 percent) report that their school is in the first or second year of implementing a state-approved core reading program. When asked how they view these transitions, 68 percent of teachers respond positively, while just 7 percent say they’ve been negative (the rest are neutral).
Also encouragingly, teachers report regular use of scientifically-based instructional strategies, such as practicing letter-sound recognition, developing academic vocabulary, and blending and segmenting words. When asked whether they favor phonics or three-cueing (a non-aligned method), a strong majority express support for phonics by a 72 to 16 percent margin.
Now to several concerning findings.
Overall, we agree with the report’s conclusion: “Teachers’ responses to the survey suggest a partial but incomplete implementation of SoR-aligned curricula.” How can Ohio continue to press for full implementation? Here, the authors offer four recommendations, which we endorse and summarize in brief form. They include:
We wish to add two suggestions—which should be enacted this year through the state budget. First, lawmakers should require the Ohio Department of Education and Workforce to disclose the core curriculum and any supplemental programs used by schools on their annual report cards. This information is currently unavailable, but parents and the public should know which materials their local district and school are using and whether they are state-approved. Second, lawmakers should continue support of the state’s literacy coaching program. This initiative currently deploys eighty-four trained coaches who provide hands-on support for teachers serving in more than 100 low-performing schools. In his recent budget request, Governor DeWine set-aside $12 million per year to sustain the program, and lawmakers should approve these funds. Coaches like these were essential to the Mississippi Miracle, and can help Ohio make rapid progress, too.
Ohio’s Science of Reading initiative is off and running, with significant improvements happening in schools and classrooms across the state. Success like that demonstrated by Louisiana and Mississippi will take continuing commitment from state and local education leaders to make sure these instructional reforms take root in every classroom. Rigorous implementation promises higher reading proficiency for Ohio students, and a brighter future for the state. Let’s keep the pedal to floor on the Science of Reading.
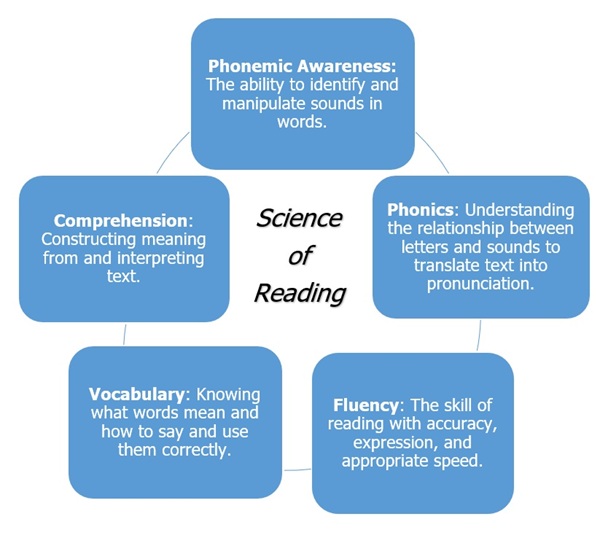
The science of reading (SoR) encapsulates a body of interdisciplinary research developed over decades. It represents the preponderance of evidence about reading development, reading, and best practices of reading instruction. SoR is not a single approach but rather a large and diverse collection of evidence that should be used to inform curriculum and instruction for all students. Properly understood, SoR centers around five main components: phonological awareness, phonics, fluency, vocabulary, and comprehension (Castles et al., 2018; Shanahan, 2020).
Ohio has made significant efforts to improve early literacy over the past several years. Governor DeWine’s literacy agenda focuses on SoR (Poiner, 2023), and in 2023, the state legislature passed a bill requiring all teachers to complete training in SoR by June 2025. In addition, the state requires public schools to adopt state-approved curriculum and instructional materials aligned with SoR during the 2024-25 school year and to move away from other methods of teaching reading that lack evidence of success.
To understand the progress made towards these goals, the Johns Hopkins Institute of Education Policy, in partnership with the Ohio Department of Education and Workforce (“ODEW”), the Thomas B. Fordham Institute, and Ohio Excels administered a representative state-wide survey to Ohio’s K-3 public school teachers. The survey asked teachers about their use and perceptions of curricula aligned to SoR, effective instructional practices, and professional development. This report highlights findings from the survey and provides the following principal findings:
Based on these findings, we recommend the following:
Recommendation 1: Survey results suggest that most, but not all, districts have adopted state-approved core curricula. Once the state has identified districts that have not adopted such curricula, it should require those districts to do so (for example, by incorporating this requirement into state grant applications, providing PL support only for state-recommended curricula, and sharing curriculum-specific rubrics).
Recommendation 2: Encourage individual teachers’ use of district-selected materials by aligning teacher observation rubrics to their district’s curricula. ODEW could support this by providing exemplar observation rubrics or, where they already exist, press for the use of curriculum-specific rubrics. The state should focus professional learning support on curriculum-specific pedagogy.
Recommendation 3: Ensure that all state-supported PL and any webinars or other public advocacy promote the use of foundational skills materials in the core curricula and discourage the use of supplemental materials. Using a single, high-quality curriculum helps ensure alignment and coherence in literacy instruction. We recommend only allowing districts to select supplemental foundational skills materials if their core curricula do not include them (such as in the case of Wit & Wisdom).
Recommendation 4: Focus professional development on training teachers to identify struggling learners, tailor instruction to their needs, and monitor progress effectively.
The science of reading (SoR) integrates research across diverse fields to create a comprehensive understanding of how children develop reading and writing skills from early childhood through adolescence (Petscher et al., 2020). For early readers, SoR emphasizes the critical role of explicit phonological awareness and phonics instruction in teaching children how to read. In addition, this research underscores the significance of reading comprehension, including vocabulary, reading fluency, and the content knowledge essential for proficient readers (Castles et al., 2018; Shanahan, 2020). The five primary elements of SoR and their definitions are shown below (National Reading Panel, 2000; Ohio Department of Education and Workforce, 2024a; Shanahan, 2005).
Since 2023, Ohio has made significant strides in improving early literacy, with Governor DeWine’s literacy agenda focused on SoR (Poiner, 2023). A new policy framework mandates that public schools adopt curricula and instructional materials aligned with SoR by the 2024-25 school year. Schools and districts that have not yet adopted the SoR are required to replace their core curriculum and/or reading intervention programs to comply with ORC 3313.6028(C).
Thus, the 2024-2025 school year serves as a transition period for districts to select state-approved materials, procure and distribute them, and provide professional development to help teachers implement the new resources effectively (Ohio Department of Education and Workforce, 2024b).
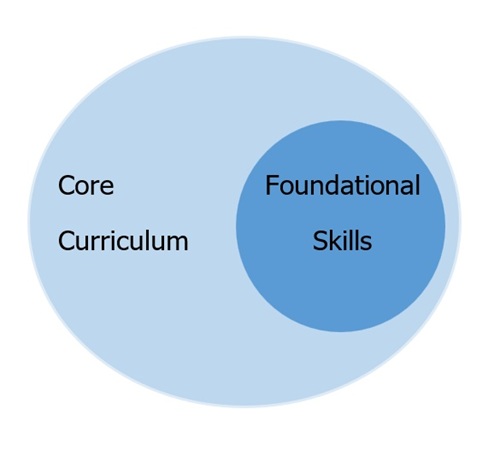
In spring 2024, ODEW released a list of approved instructional materials for Grades K–5 to support the new frameworks. The list is based on comprehensive reviews by EdReports, a national nonprofit that evaluates the quality of instructional materials (Poiner, 2024; Ohio Department of Education and Workforce, 2024b). It includes two main categories:
Since most core programs include foundational skills lessons, teachers using those programs do not need a separate foundational skills program. However, Ohio includes two core materials, Wit & Wisdom and Fishtank Plus ELA, that do not contain foundational skills lessons for Grades K-2. These programs teach many literacy skills, including reading comprehension, fluency, and vocabulary, but they do not teach students phonemic awareness or phonics, the basic building blocks of learning how to read. Thus, teachers who use those two curricula must also use state-approved foundational skills curricula.
ODEW encourages districts to prioritize high-quality core programs, with SoR-based supplemental materials only used when necessary. This revised framework is intended to discourage the use of curricula not aligned with SoR, such as Fountas & Pinnell and Lucy Calkins’s Units of Study, which are notably absent from the list (Poiner, 2024).
Selecting a new curriculum aligned with SoR is an essential first step toward changing Ohio's early reading instruction. However, the success of Ohio’s literacy initiative will also depend on a number of next steps, such as high-quality curricular implementation and sufficient support and professional learning for teachers. The purpose of the present study is to understand the implementation process: which curricular materials teachers use for core and foundational skills, how they use these materials, their instructional techniques, and their professional learning experiences.
To gain a broad understanding of how early elementary teachers are progressing toward implementing SoR-aligned materials, the Institute fielded a state-wide survey to a stratified, random sample of K-3 teachers from public schools representative of Ohio’s traditional districts and community (i.e., charter) schools. Surveys were sent to 1,652 teachers from 120 schools in 48 districts. A total of 402 K-3 teachers responded to the survey, with a response rate of 24%, and responses were weighted to reduce non-response bias. See Appendices B and C for more details.
Teachers who responded to the survey were more experienced, with more than 17 years of experience on average, and evenly distributed across the four grade levels. On average, teachers taught 24 students, including approximately three English language learner (ELL) students and four students receiving special education services (i.e., with individualized educational plans or IEPs). Most notably, teachers indicated that an average of approximately 16 students in their class were on Reading Intervention and Monitoring Plans. Ohio law requires that schools develop a Reading Improvement and Monitoring Plan within 60 days for any K-3 student reading below grade level, and the plan must remain in place until the student achieves grade-level reading proficiency. Thus, survey responses suggest that approximately two-thirds of respondents’ students were reading below grade level (Ohio Department of Education, 2024c), highlighting the critical need for strong reading instruction.
Core Curricular Materials
Research shows that most teachers use various materials to plan lessons, even when given a comprehensive curriculum (Kaufman et al., 2020). Thus, to understand the range of sources teachers use to plan their core literacy instruction, the survey provided teachers with a list of all ODEW’s approved core instructional materials and options for other commonly used published materials that were not on the approved list. Teachers were asked to select all the materials they used for their core ELA lessons. Teacher responses show that while many teachers do consult unapproved materials when planning their literacy instruction, 70% of teachers primarily use a state-approved SoR core curriculum. In addition, while teachers generally have favorable impressions of their most frequently used core curricula, they have more mixed opinions about whether their curricula meet the needs of students below grade level, those learning English, and those with IEPs.
Figure 1 shows the percentage of teachers who use each material to plan their core literacy lessons. Note that state-approved materials are displayed as purple bars, and materials not approved by the state are orange.
Figure 1. Response to Survey Item: Please indicate which of the following instructional resources you draw upon for your core comprehensive ELA classroom lessons. (Select all that apply.)
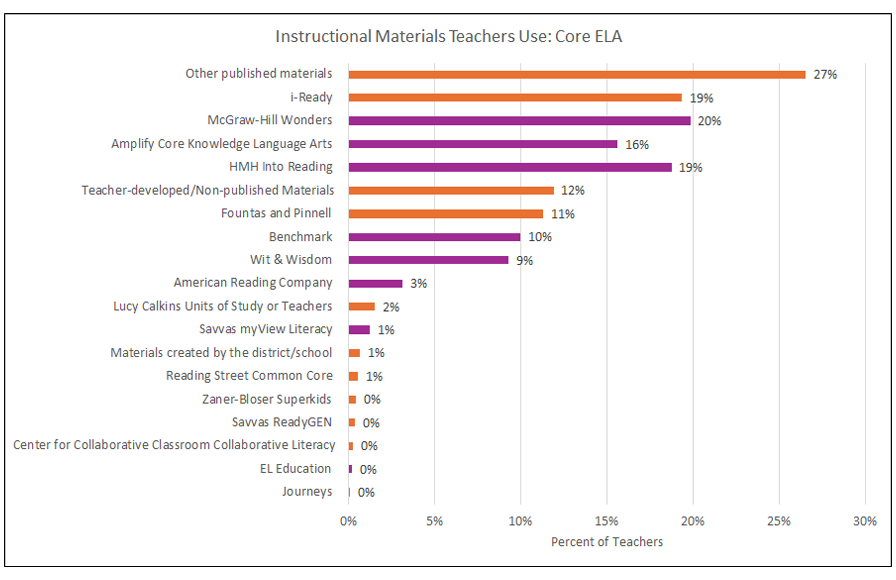
Figure 1 shows that teachers draw on a wide range of materials to plan their core literacy lessons, many of which are not on the state’s approved list of curricula. For example, more than a quarter of teachers use “other published materials” (i.e., published materials not listed in the survey), and 19% use i-Ready. This suggests that many teachers at least consult unapproved ELA materials that are not aligned with the state’s standards of high-quality SoR-aligned curriculum.
Most Frequently Used Materials
To better understand whether teachers primarily use state-approved curricula and which curricula teachers regularly use, the survey next asked teachers to indicate which instructional materials they used most frequently for their core comprehensive ELA classroom lessons. Teachers’ responses are shown below in Figure 2.
Figure 2. Responses to Survey Item: Which of these instructional resources do you use most frequently?
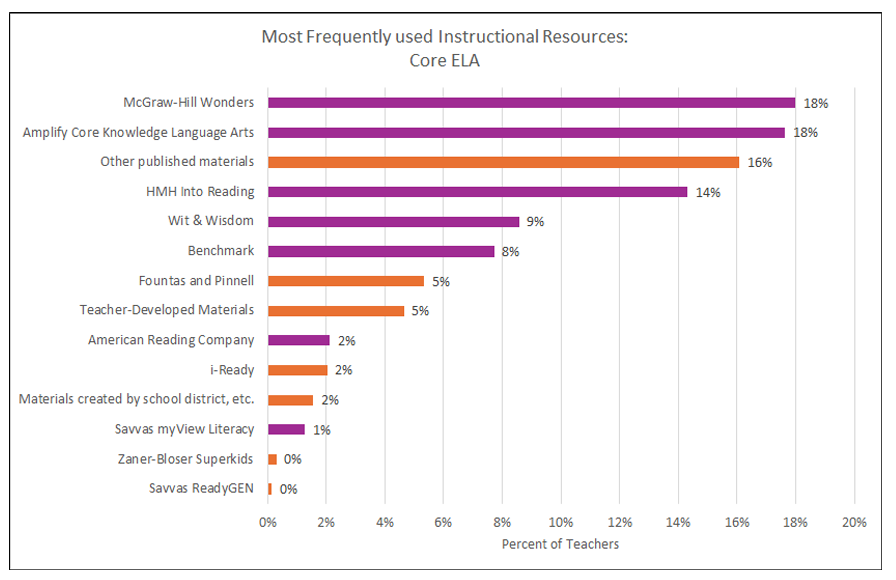
Figure 2 shows that a variety of core curricular materials are used most frequently by K-3 teachers across the state. The most commonly used curricula are on ODEW’s approved curriculum list, including Amplify Core Knowledge (18%) and McGraw-Hill Wonders (17%). Collectively, 70% of teachers indicated that they most frequently use core curriculum approved by the state.
Figures 1 and 2 show that while most teachers use state-approved curricula, augmenting with other materials, often unapproved, is common. In addition, 30% of teachers indicated they did not use approved state materials to teach core ELA. This includes the 21% of teachers who indicated they use “other published materials” or “teacher-developed materials” most frequently. This suggests that further support is needed to reach full implementation among the 70% of teachers primarily using approved curricula and more intense, targeted support to reach the other 30% of teachers.
Teachers’ views of their Materials
Teachers indicated they had neutral to slightly positive impressions of their core curricula. Specifically, the survey asked teachers to rate their agreement about elements of their core curricula on a scale of 1, indicating strong disagreement, to 5, indicating strong agreement. Responses are shown in Figure 3.
Figure 3. Responses to Survey Item: Respond to the following statements about your impression of the curriculum.
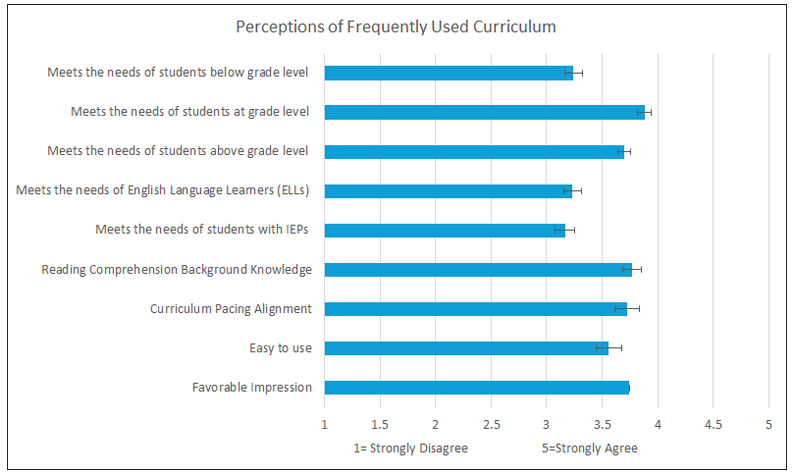
Teachers’ average responses across all questions range from 3, indicating “neither agree nor disagree” with the statement, and 4, indicating agreement. Figure 3 suggests that teachers generally had a slightly favorable impression of their curricula (with an average of 3.7) and most strongly agreed that their frequently used curriculum met the needs of students at grade level. However, teachers indicated more neutral responses when asked if their materials met the needs of their students below grade level, students learning English, and students with IEPs.
These more neutral responses are especially notable since teachers indicated that two-thirds of their students are below grade level. Teachers also reported teaching an average of three students who were learning the English language and four who had IEPs. Taken together, these groups represent most of the students in teachers’ classes, and teachers’ perceptions about the curriculum meeting these students’ needs may help explain why teachers augment these materials.
Foundational Skills Curricular Materials
All but two of the core curricula approved by ODEW also include lessons for foundational skills. This suggests that most teachers do not need to augment their core curriculum with a separate foundational skills curriculum. However, ODEW has approved 13 supplementary foundational skills materials. Teachers’ responses show that they are unlikely to use these state-approved foundational skills curricula but instead supplement their core curricula with different foundational skills curricula. Specifically, while 70% of teachers use state-approved core materials, only 47% use approved foundational skills materials. Figure 2 showed that only 9% of teachers used a core curriculum without foundational skills, suggesting that teachers are unnecessarily supplementing their core curricula. Even when the foundational skills supplements are state-approved, they are not aligned with the core curriculum. This is important because it results in unnecessary misalignment between two components of an instructional system that should work together. Survey responses also suggest that this decision is likely happening at the school or district level rather than at the classroom level, as many teachers indicate that their schools recently adopted new core curricula but that they have used their foundational skills curricula for longer.
Given teachers' frequent practice of constructing lessons from various sources, especially in ELA, the survey asked if they use the same core curricula to teach foundational skills (Kaufman et al., 2020). Teachers’ responses are shown in Figure 4. Respondents also indicate whether teachers used state-approved core curricula (in purple) or not (in orange).
Figure 4. Responses to Survey Item: Do you use the same curriculum to teach your core comprehensive ELA instruction and your foundational skills instruction?
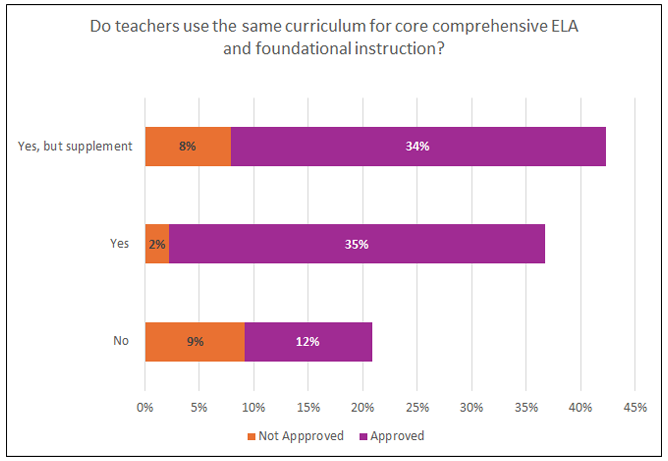
Figure 4 shows that the largest group of respondents, 42% of teachers, stated that they use the same curriculum for core and foundational skills lessons. However, they also supplemented their foundational skills lessons with additional materials. This is concerning, as SoR research finds that phonics instruction should be systematic (National Reading Panel, 2000), which is less likely when teachers augment lessons with materials from multiple sources. In addition, the state has indicated, through their approval, that the state-approved curricula are aligned with the SoR and do not need to be supplemented.
In addition, Figure 4 shows that 21% of respondents used a completely different foundational skills curriculum than their core curriculum (i.e., answered “No”). Combining these two groups suggests that the majority of teachers, some 63%, used at least two different resources for core and foundational skills, making alignment between lessons less likely.
To better understand the resources teachers primarily draw upon for their foundational skills lessons, Figure 5 shows all the materials teachers use most frequently for their foundational skills lessons. The response options included all state-approved foundational skills materials and other popular materials not approved by the state. Note that these responses only represent the 63% of teachers who use foundational skills materials outside their core curricula.
Figure 5. Responses to Survey Item: Which of these materials do you use most frequently?
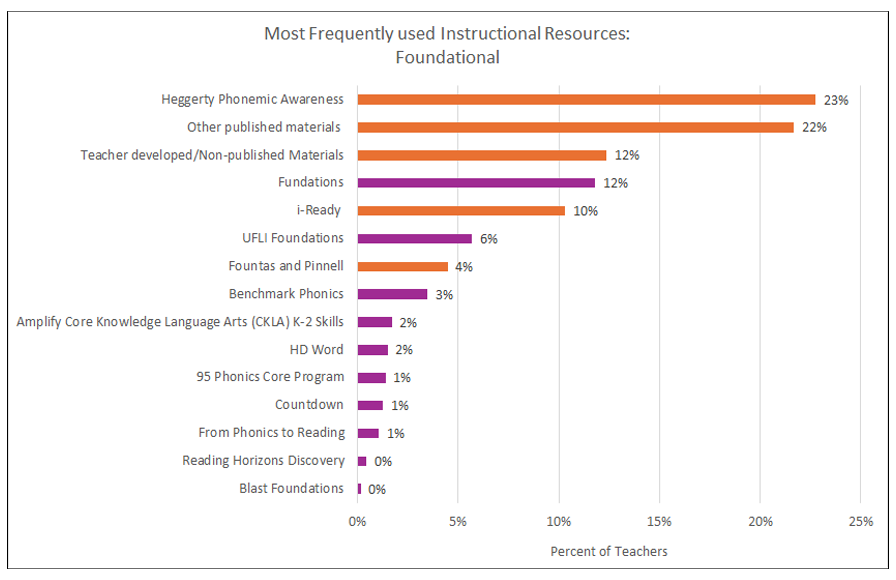
Figure 5 shows that when teachers do not use the same core and foundational skills curriculum, many use a foundational skills curriculum that is not approved by the state. Specifically, among teachers that did not use the same core and foundational skills materials, almost a quarter (23%) stated that they used Heggerty Phonemic Awareness, another 22% stated that they used other published materials not approved by the state, and 12% stated that they most frequently drew from unpublished or teacher-developed foundational skills materials. In total, 71% of these teachers used materials not approved by the state to teach foundational skills. This is especially concerning, given that foundational skills lessons are designed to teach students how to read.
Note, however, that Figure 5 only shows responses from teachers who use separate foundational skills curricula or use them to supplement core curricula and does not include teachers who used the same core and foundational skills curricula only. Thus, Figure 6 shows the percentage of teachers that used state-approved foundational skills curricula—whether embedded in their core curricula or as a separate or supplemental program—across all teacher respondents.
Figure 6. Percent of teachers who use ODEW-approved core and foundational ELA curricula.
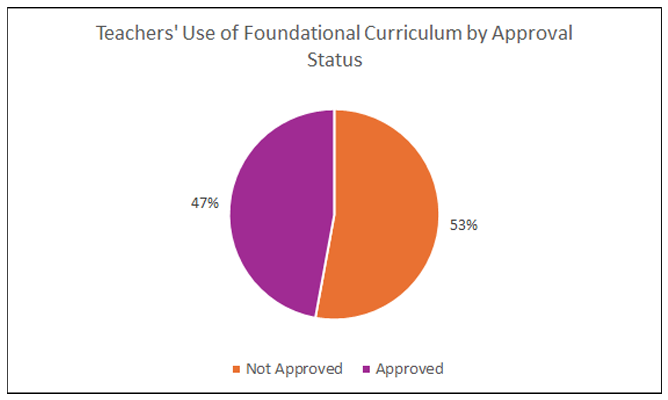
Figure 6 shows that 47% of teachers used state-approved foundational skills materials, compared to 70% of teachers using state-approved core curricular materials. This suggests that the state is further along in implementing approved core materials than foundational skills materials.
Teachers’ views of their Foundational Skills Curriculum
When asked about their agreement to a series of questions about their impressions of their foundational curricula, teachers had more positive responses about foundational skills curricula, shown in Figure 7, than core curricula, shown in Figure 3.
Figure 7. Responses to Survey Item: Respond to the following statements based on your use of your chosen foundational skills curriculum.
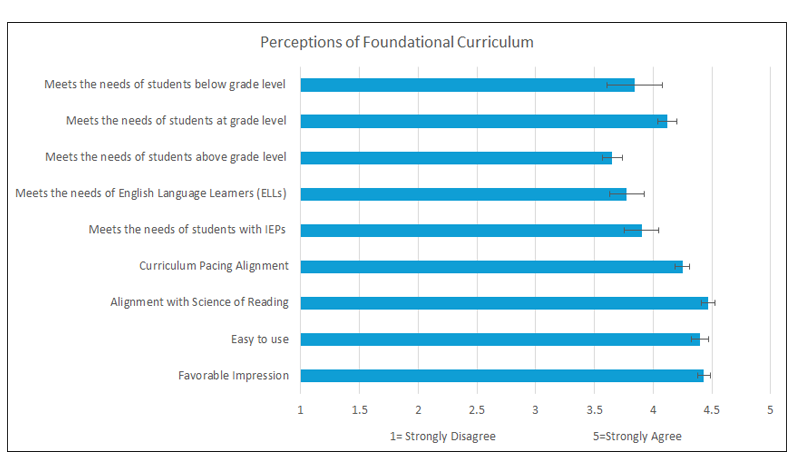
Teachers’ average responses across all questions ranged from around 3.5, where a 3 indicates a neutral response to a statement (“neither agree nor disagree”), to 4.5 indicates agreement with the statement. Figure 7 suggests that teachers generally had a more favorable impression of their foundational curricula (with an average of 4.4). They most strongly agree that their most frequently used foundational skills curriculum is aligned with SoR and is easy to use. Teachers indicated more neutral responses that the materials meet the needs of their students above grade level, below grade level, students learning English, and students with IEPs. However, these responses were higher than those about the core curricula.
Are Teachers Required to Use Specific Instructional Materials?
The survey also explored the extent to which teachers reported being required to use specific core and/or foundational skills materials. To shed insight on why a smaller percentage of teachers are using approved foundational skills materials, especially considering that teachers indicate more favorable responses to foundational skills materials, Figure 8 shows teachers’ responses regarding whether their school or district requires the use of specific core and/or foundational materials.
Figure 8. Responses to Survey Item: Please indicate whether your district/school system requires or recommends use of [your curriculum]?
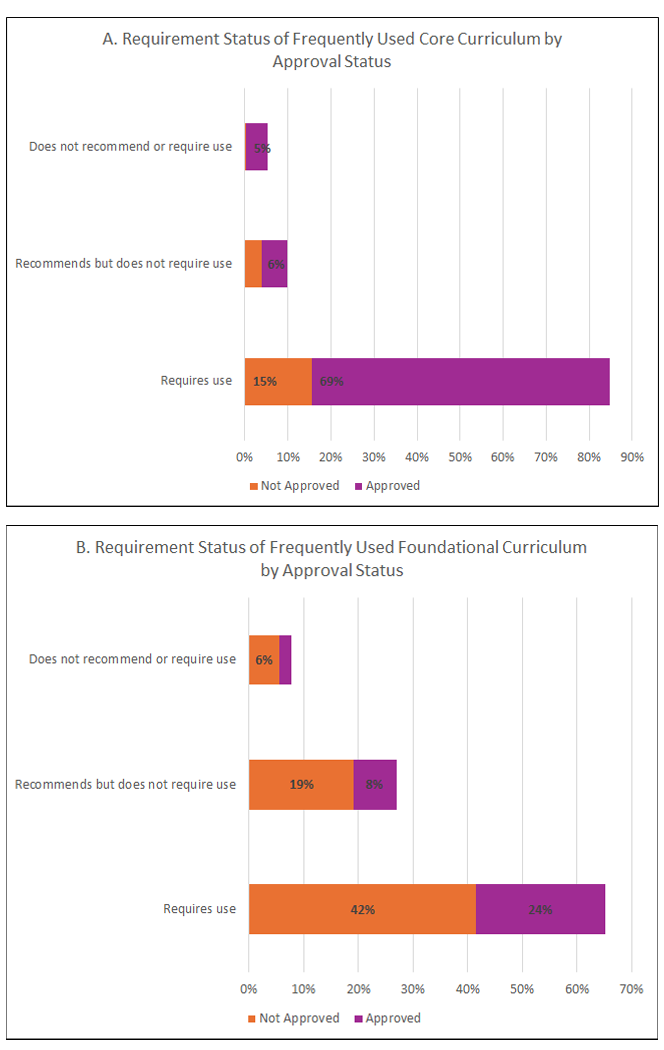
Figure 8 shows that more schools and districts require the use of core than foundational skills curriculum. In addition, while 15% of teachers state that their districts require the use of unapproved core curricula (e.g., suggesting that they have yet to transition to state-approved materials), 42% of teachers state that their districts require the use of unapproved foundational skills curricula. Thus, Figure 8 suggests that districts are further along in transitioning to core curricula than foundational skills curricula. However, this is puzzling since – to repeat a key point - most core curricula include foundational skills curricula.
Figure 9 may shed some insight into this, as it shows how long teachers have been using their core and foundational skills curricula.
Figure 9. Responses to Survey Item: How long have you been implementing your most frequently used instructional materials?
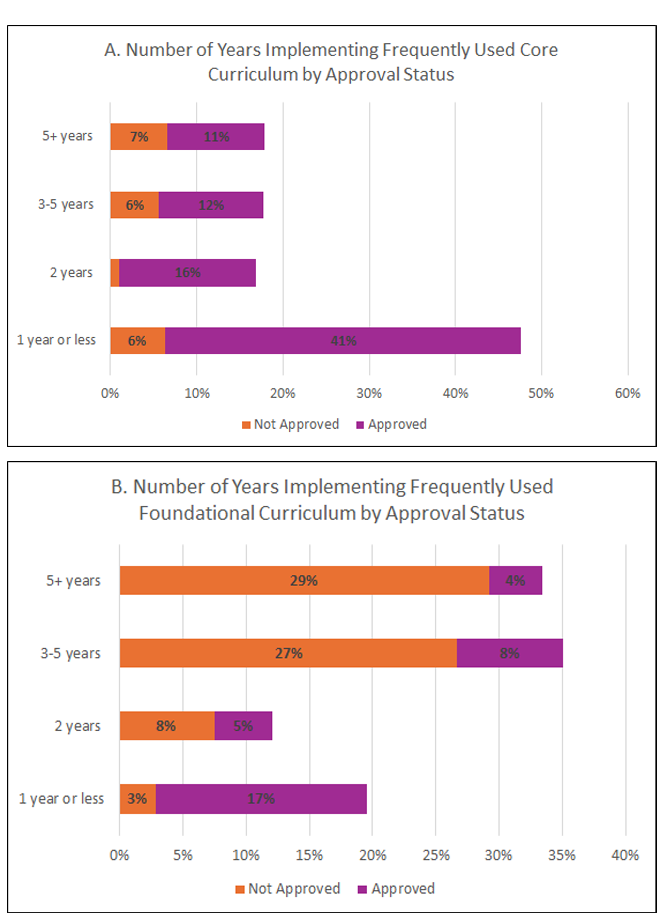
Panel A shows that most teachers use state-approved core materials, which are relatively new to many teachers. For example, 41% of teachers are in their first year of using state-approved core materials. In contrast, a small percentage of teachers still use unapproved materials, and most have been using these materials for relatively longer. This suggests that these teachers still need to transition to approved state materials (although it is surprising that 6% of teachers are in their first year of using unapproved curricular materials).
In contrast, Panel B shows that many districts and teachers have not yet transitioned to using state-approved foundational skills materials. This suggests that schools and teachers have continued to use their prior foundational skills curricula, even though they are not approved. Additional support may thus be needed to help schools and teachers move away from these known foundational skills materials. This transition is critical given that foundational skills are specifically designed to teach students how to read.
Foundational Skills Instructional Practices
To gain a deeper understanding of teachers’ instructional practices during their foundational skills lessons, the survey asked teachers about their general comfort level with teaching the five main elements of SoR. Teachers’ responses suggest that teachers felt comfortable teaching each of the five main elements of the SoR; all responses are between 4 and 5, indicating that teachers felt very and extremely comfortable on average.
In addition, the survey asked teachers about their use of more specific instructional strategies aligned with SoR. Teachers were asked how frequently they use each strategy every week, with a response of 1 indicating that they do not use the strategy at all and 5 indicating that they use it a great deal. Responses are shown in Figure 10.
Figure 10. Responses to Survey Item: In a typical week, how much do you ask your students to engage in the following practices during ELA class?
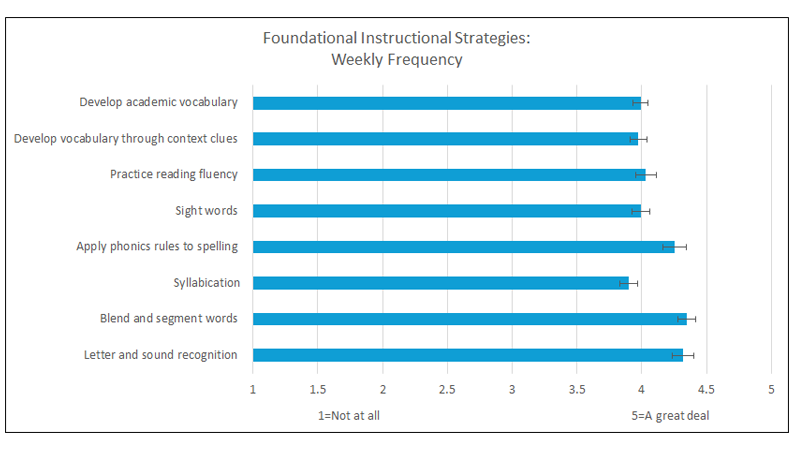
Figure 10 shows that teachers regularly used each SoR-aligned strategy, with all responses close to 4 or “a lot.” In addition, teachers most regularly practiced letter and sound recognition, blending and segmenting words, and applying phonics rules to spelling with their students. On average, teachers practiced syllabication and developing vocabulary slightly less regularly.
Teachers were asked how frequently they used additional tools and methods in their classrooms, several of which were not aligned with SoR (e.g., running records, three cueing, balanced literacy, leveled readers, guessing from context, pictures, or other clues). These responses are shown in Figure 11.
Figure 11. Responses to Survey Item: In a typical week, how much do you use the following tools and methods in your classroom to help kids learn how to read?
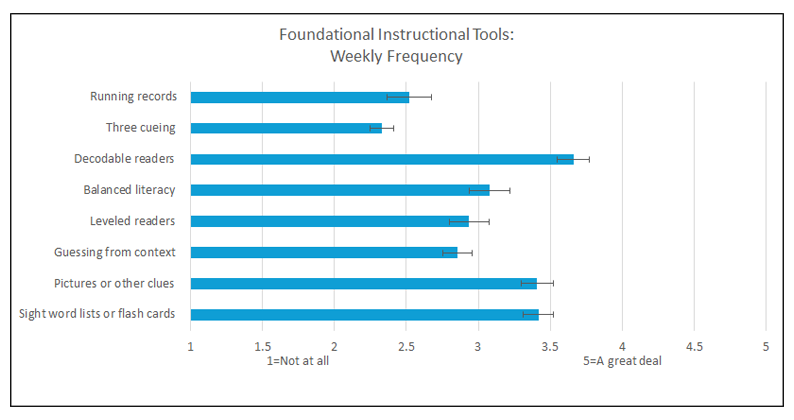
Figure 11 suggests that teachers are less likely to employ instructional practices that do not align with SoR. For example, on a scale of 1 to 5, where a 2 indicates using the method “a little” and a three indicates the method is used “some,” teachers’ average response to the use of the three cueing system is 2.3, their use of prompting students to guess an unknown word from context clues is 2.9, and prompting for students to guess an unknown word using pictures or other clues is 3.4. Thus, Figures 10 and 11 suggest that SoR-aligned practices were more common than practices less aligned with SoR. These differences highlight the partial implementation of SoR: teachers are now comfortable with SoR’s main components and are more likely to use instructional practices aligned with SoR research. However, they still sometimes rely upon old, unaligned practices.
Use of non-SoR Practices
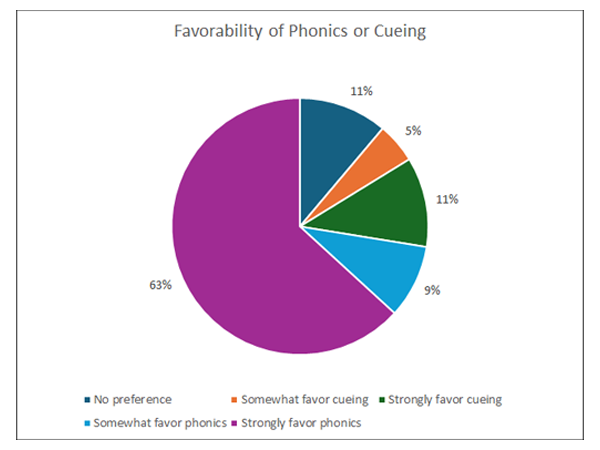
This partial implementation is highlighted in Figure 12, which shows teachers’ responses to a question asking if they generally favor using phonics or cueing. Most teachers, 72%, preferred phonics over the three-cueing system, with most indicating a strong phonics preference. Among the more than a quarter of teachers remaining, 11% indicated no preference between the two approaches. Thus, we estimate that 16% of K-3 teachers across Ohio still favored teaching reading using the three-cueing system.
Figure 12. Responses to Survey Item: Do you generally favor the use of phonics (i.e., encouraging students to sound out words) or cueing (i.e., encouraging students to use context clues) when teaching?
Science of Reading Professional Learning
Teachers’ responses about the quantity of professional learning (PL) they received to support ELA instruction over the past year suggest an increase in ELA professional learning than they typically receive. Specifically, teachers indicated that they received an average of almost 26 hours of PL to support their ELA instruction in the past year. Approximately 68% of teachers indicated that the PL support they received this year increased compared to a typical year. In comparison, 23% responded that professional development remained the same as in a typical year.
In addition, teachers’ responses indicate that most teachers received PL support for using ELA curricular materials and SoR instruction. Specifically, 70% of teachers participated in PL to support their most frequently used curriculum. In addition, 86% of teachers indicated that they participated in PL to support instruction in SoR, and 55% of teachers indicated they participated in SoR PL provided by ODEW.
To learn more about the quality of teachers’ SoR PL, the survey asked teachers to indicate how much they agreed with statements about their experiences. Responses are shown in Figure 13, where a response of 1 indicates that a teacher strongly disagreed with the statement, and 5 indicates strong agreement.
Figure 13. Responses to Survey Item: Please respond to the following statements regarding the PL (the language used in the survey was professional development) you received to support your literacy instruction in the science of reading over the past year.
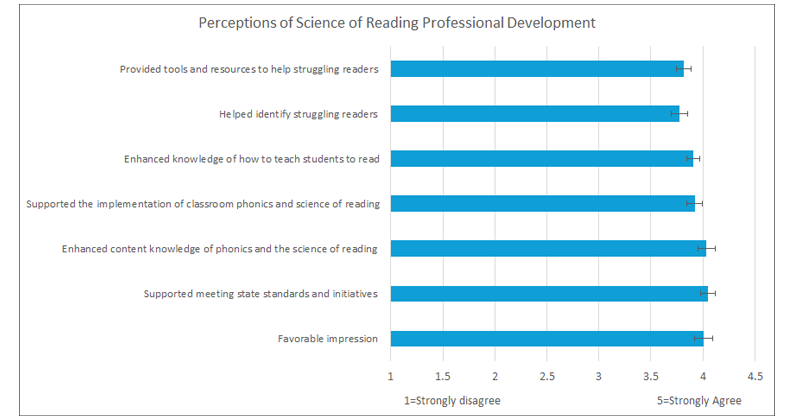
Figure 13 suggests that teachers had a positive view of their SoR PL. Average answers are all close to 4, indicating “agreement” with the statements. Teachers had the strongest agreement that they have a favorable impression of the PL, that the PL supported meeting state standards and initiatives, and that it enhanced their content knowledge of phonics and SoR. Teachers had slightly less positive responses, an average of 3.8, to statements about identifying and supporting struggling readers and to a statement that the PL provided teachers with resources and tools to support struggling readers. These responses suggest that teachers believed they benefited from their SoR PL and might benefit from additional professional learning to support their struggling readers.
Teachers’ responses to the survey suggest a partial but incomplete implementation of SoR-aligned curricula. While the teacher survey shows evidence of the success of Ohio’s efforts to improve early literacy, it also indicates that more work is needed to complete the implementation process and better support the two-thirds of respondents’ students who are below grade level in reading.
The survey revealed that 70% of teachers use state-approved core curricular materials most frequently. However, a significant number, 30%, also use non-approved curricula or teacher-developed materials. The survey revealed that only 47% of teachers used a state-approved foundational skills curriculum. This is surprising, given that all but two of the state-approved core curricula include foundational skills lessons.
Teachers’ responses suggested that some schools and districts have not yet implemented a state-approved core curriculum.
Some teachers are not using state-approved core curricula, and some teachers who are using such curricula are not using them to teach foundational skills (even though almost all the core curricula include materials to support such teaching).
While teachers are generally satisfied with their state-recommended materials, they are less satisfied with their efficacy when it comes to teaching students who are below grade level.
While Ohio’s initiative is progressing towards the widespread use of SoR-based reading instruction, effective implementation at scale will depend on targeted incentives, focused PL support, and close monitoring to ensure that districts and teachers fully adopt SoR-aligned materials and practices and discard non-SoR-aligned materials and practices.
Fordham Institute acknowledgements
We wish to thank Alanna Bjorklund, David Steiner, and Ashley Berner at Johns Hopkins University, for designing the survey and producing the fine report that follows. Special thanks to Lisa Gray, Kevin Duff, and Cassandra Palsgrove of Ohio Excels who provided thoughtful input on the survey and report drafts. We’re grateful to the staff at the Ohio Department of Education and Workforce who supported this effort, particularly Melissa Weber-Mayrer and Sherine Tambyraja. We also wish to thank Tom Lasley of Learn to Earn Dayton and Tony Podojil of the Alliance for High Quality Education who helped encourage survey participation. On the Fordham team, our thanks to Michael J. Petrilli and Chester E. Finn, Jr., who provided feedback on an earlier draft. We wish to thank our Fordham-Ohio colleagues Jeff Murray and Jessica Poiner for helping on this project in various ways.
This report was made possible through generous financial support from Ohio Excels, as well as our sister organization, the Thomas B. Fordham Foundation.
Doan, S., & Shapiro, A. (2023, December 11). Do Teachers Think Their Curriculum Materials Are Appropriately Challenging for Their Students? Findings from the 2023 American Instructional Resources Survey. Rand.org; RAND Corporation.
Castles, A., Rastle, K., & Nation, K. (2018). Ending the reading wars: Reading acquisition from novice to expert. Psychological Science in the Public Interest, 19(1), 5-51.
Dillman, D. A., Smyth, J. D., & Christian, L. M. (2014). Internet, phone, mail, and mixed-mode surveys: The tailored design method (4th ed.). John Wiley & Sons.
Kaufman, J. H., Doan, S., Tuma, A. P., Woo, A., Henry, D., & Lawrence, R. A. (2020, August 31). How Instructional Materials Are Used and Supported in U.S. K–12 Classrooms: Findings from the 2019 American Instructional Resources Survey. Rand.org; RAND Corporation.
Levy, P. S., & Lemeshow, S. (2008). Sampling of populations: Methods and applications (4th ed.). John Wiley & Sons.
National Reading Panel (US), National Institute of Child Health, & Human Development (US). (2000). Report of the National Reading Panel: Teaching children to read: An evidence-based assessment of the scientific research literature on reading and its implications for reading instruction: Reports of the subgroups. National Institute of Child Health and Human Development, National Institutes of Health.
Ohio Department of Education and Workforce. (2024a,). Implementing Ohio’s Plan to Raise Literacy Achievement A Guide for School Leaders, Grades K-5.
Ohio Department of Education and Workforce. (2024b, March 4). Updated list of approved core curriculum and instructional materials for English language arts.
Ohio Department of Education and Workforce. (2024c, August 28). High-Quality Instructional Materials in English Language Arts FAQ | Ohio Department of Education and Workforce.
Ohio Department of Education and Workforce. (2024d, December 18). District Resources.
Petscher, Y., Cabell, S. Q., Catts, H. W., Compton, D. L., Foorman, B. R., Hart, S. A., ... & Wagner, R. K. (2020). How the science of reading informs 21st‐century education. Reading Research Quarterly, 55, S267-S282.
Poiner, J. (2024). Ohio continues to move toward high-quality reading curricula. The Thomas B. Fordham Institute.
Shanahan, T. (2005). The national reading panel report: Practical advice for teachers. Learning Point Associates.
Shanahan, T. (2020). What constitutes a science of reading instruction? Reading Research Quarterly, 55, S235-S247.
Shen, Z., Curran, F. C., You, Y., Splett, J. W., & Zhang, H. (2023). Intraclass Correlations for Evaluating the Effects of Teacher Empowerment Programs on Student Educational Outcomes. Educational Evaluation and Policy Analysis, 45(1), 134-156.
Valliant, R., Dever, J. A., & Kreuter, F. (2018). Practical tools for designing and weighting survey samples. Springer International Publishing.

Note: On Tuesday, March 4, 2025, the Ohio House Education Committee heard public testimony on the education provisions in House Bill 96—the next biennial state budget. Fordham’s vice president for Ohio policy provided the following proponent testimony in written form.
My name is Chad Aldis, and I am the vice president for Ohio policy at the Thomas B. Fordham Institute. The Fordham Institute is an education-focused nonprofit that conducts research, analysis, and policy advocacy, with offices in Columbus, Dayton, and Washington, D.C. Fordham’s Dayton office, part of the affiliated Thomas B. Fordham Foundation, also serves as an approved charter school sponsor in Ohio.
I have spent my career advocating for policies that strengthen academic achievement and expand educational opportunities for Ohio’s students. And for that reason, I am pleased to support House Bill 96 and the crucial investments and policy improvements that it makes to ensure more students are equipped with the knowledge and skills necessary for success in college, career, and life. I urge the committee to maintain these provisions and consider additional measures that would further enhance the quality and transparency of Ohio’s education system.
Improving the Cupp-Patterson School Funding Formula
Ohio’s budget, as you all know, contains thousands of pages of policy changes in addition to the required funding provisions. Still, when discussing education and the state budget, the only place to start is the school funding formula.
When Ohio lawmakers enacted the Cupp-Patterson school funding formula, it was intended to create a fairer and more predictable system. While it has led to increased state spending on education, four years of implementation have revealed areas that require structural improvements. The governor’s proposal includes a full phase-in of the formula, but there is a further need to refine the formula to ensure efficiency, fairness, and long-term sustainability.
1. Use Direct Certification for Disadvantaged Pupil Impact Aid (DPIA)
Ohio’s method for identifying economically disadvantaged students has become unreliable due to the federal Community Eligibility Provision (CEP) policy, which allows certain schools to classify all students as disadvantaged for meal subsidy purposes. As a result, many mid-poverty districts receive excessive DPIA funding, diluting resources intended for truly low-income students.
To improve equity, Ohio should transition to a direct certification model, using participation in programs such as SNAP, TANF, or Medicaid to determine disadvantaged status. This would ensure that DPIA funds are allocated based on actual student need, improving the effectiveness of this critical aid.
To be clear, this would not have any impact on the ability of students to receive free lunches. This would only ensure that the dollars to support our most economically disadvantaged students actually goes to those students.
2. Eliminate School Funding Guarantees
More than 200 districts currently receive $375 million in excess funds through funding guarantees, which provide state aid to districts that are losing enrollment or becoming wealthier. These guarantees undermine the principle of a formula-based system, creating inequities that favor some districts while shortchanging others. The governor has recommended starting the process of reducing these guarantees. We agree with him and think the legislature should move even more quickly to do so. Specifically, we recommend accelerating the reduction of the guarantee to 10 percent in the first fiscal year and 20 percent in the second (the governor proposed 5 and 10 percent reductions, respectively). In addition, lawmakers should immediately eliminate the supplemental targeted assistance guarantee as it primarily acts to insulate districts against past enrollment losses due to school choice.
3. Restore Financial Incentives for Open Enrollment
Ohio’s interdistrict open enrollment program benefits over 70,000 students, yet the Cupp-Patterson formula weakened financial incentives for districts to participate. Previously, open enrollees were funded at a flat statewide per-pupil amount ($6,020 in FY21), but the new formula introduced variable funding levels that are lower for many districts, discouraging participation. The result: for the first time, statewide open enrollment participation is falling at a time when policy makers should be encouraging public school choice options.
To restore access to open enrollment, the state should return to a set per-pupil funding amount, ensuring that districts have the resources to support students who choose to enroll. This could be funded via either a district-to-district transfer or direct state funding.
4. Remove Staffing Minimums from the Base Cost Formula
The base cost calculations under Cupp-Patterson include staffing minimums that disproportionately benefit low-enrollment districts, artificially inflating their per-pupil funding levels (often exceeding $10,000 per student). This creates inefficiencies and disincentivizes district consolidation or expansion.
Rather than relying on rigid staffing minimums, Ohio should calculate base costs based on actual student enrollment and needs, promoting transparency and fiscal responsibility. If, as is likely the case, the Cupp-Patterson formula fails to provide sufficient resources for very small districts, a very targeted scarcity index should be created. Rather than wrapping itself in rhetoric around staffing minimums, this shift would more transparently underscore the financial commitment being made to the smallest districts.
5. Control the Inflationary Cost of the Formula
Finally, and most critically, the current funding formula ties base cost calculations to rising employee salary and benefits data leading to likely unsustainable spending increases. While sensible on its face, federal and local optional revenue—dollars outside the state funding formula—can result in significant salary increases statewide. In turn, this produces increased costs for the state during the next state budget process—despite the spending being above and beyond the calculated cost of the Cupp-Patterson formula.
To ensure financial sustainability, Ohio should immediately address this issue. It could explore options such as requiring the legislature each year—based on evidence presented by the public and stakeholders—to adjust the various salary inputs used to calculate the base funding cost. Alternatively, using the Cupp-Patterson base cost as a starting point, the state could set a fixed statewide base cost per-pupil amount to be reviewed every two years. In either case, the legislature—which has the constitutional responsibility to make appropriations—would have control over the appropriation process and amounts to be appropriated.
Literacy and Numeracy
Ohio has made tremendous strides in improving literacy instruction through a steadfast commitment to the science of reading. HB 96 builds upon this progress in two important ways. First, it requires the Department of Education and Workforce (DEW) to adopt a diagnostic assessment aligned with Ohio’s academic standards in both reading and math for grades K-3. A universal approach to screening will ensure that struggling students are identified early and receive the support they need before they fall irreversibly behind. Second, the bill maintains investments in professional development for teachers and literacy coaches, ensuring that educators continue to receive the training necessary to effectively implement research-based reading instruction.
However, while the budget proposal rightly prioritizes foundational learning, there is room for improvement. Currently, the bill acknowledges the need for top students to receive advanced math instruction but unfortunately allows districts to opt out of offering advanced math courses to high-achieving students. This provision should be removed and replaced. The state must ensure that all students performing at an advanced level have access to accelerated learning opportunities, rather than leaving it to chance based on district capacity or preference. Specifically, any student scoring advanced or accomplished on the seventh grade state math assessment should, unless a parent opts out, be enrolled in algebra in eighth grade.
In addition, I urge the committee to require DEW to review core math curricula and develop a list of high-quality instructional materials, similar to what was done for literacy. High-quality curriculum is a cornerstone of strong instruction, and providing districts with clear, research-backed recommendations will help elevate student achievement. While it’s important to create this list, it should be done to assist districts in making purchasing decisions and not require the purchase of an approved curriculum.
Career Pathways and Workforce Readiness
Ohio’s education system must prepare students for a rapidly evolving job market. One of the most promising aspects of HB 96 is the elimination of the arbitrary point value system for industry-recognized credentials (IRCs). Instead of assigning point values without a clear economic rationale, the state should transition to a data-driven framework that categorizes credentials based on workforce demand, earnings potential, and career advancement opportunities.
The budget also takes a positive step by eliminating waivers that allow districts to avoid offering career-technical education (CTE) to seventh and eighth graders. Early exposure to career pathways is key to helping students make informed decisions about their futures, and removing barriers to access ensures that more students can explore high-quality career options.
One misstep the budget makes is to add 250 hours of work-based learning as a foundational option for meeting graduation requirements (it’s currently considered a supportive measure). We strongly urge you to remove this language and revert to existing law. Work-based learning is incredibly important, but—on its own—it is not an adequate measure of post-high school preparedness.
To further strengthen the impact on career education, I encourage lawmakers to require all middle school students to complete a career exploration course. As students consider their high school and post-secondary options, structured career exploration will help them make informed choices about coursework and credentialing programs. Without such a course, the career planning requirements being championed by Governor DeWine are unlikely to have the desired impact on Ohio students. Additionally, the state should invest in linking workforce data to secondary and post-secondary education metrics, allowing policymakers to assess which programs are delivering strong outcomes and which need improvement.
Public Charter Schools: Expanding Opportunity and Ensuring Sustainability
Governor DeWine’s strong commitment to high-quality public charter schools has resulted in major policy advances, particularly through the high-quality charter funding program established in 2019. Research has shown that these funds have been used effectively—boosting teacher pay and improving student achievement in qualifying schools. HB 96 continues this progress by preserving and strengthening key charter school funding mechanisms.
Protecting Charter Funding Initiatives
Ohio lawmakers have taken important steps in recent years to address the funding gap between charter schools and traditional districts. Currently, three critical funding streams help close this gap:
HB 96 not only maintains these programs but also increases the per-pupil facilities amount to $1,500—a necessary step to help charters secure adequate learning spaces. Importantly, the bill adds these measures to the charter school funding formula in revised code signaling their importance and increasing the likelihood that they’ll remain key elements of how Ohio funds charter schools in future years.
Boosting Charter Facilities Support and Access to Buildings
Unlike district schools, public charters do not receive local property tax revenue to support facility needs. The state’s per-pupil facilities aid, while helpful, has historically fallen short. HB 96 wisely increases this funding, and also strengthens Ohio’s law for unused facilities, ensuring that charter schools can access vacant district buildings at more affordable prices.
For years, some school districts have resisted offering these taxpayer-funded buildings to charter schools as required by law. HB 96 clarifies the definition of an “unused” facility, expands the ability of high-quality charters to bid on these buildings statewide, and adds transparency provisions to improve compliance. Lawmakers should embrace these improvements and consider further measures, such as credit enhancement and revolving loan programs, to help charters finance their capital projects at lower costs.
Improving Accountability for Dropout Recovery Schools
Of Ohio’s approximately 320 charter schools, 84 are designated as dropout recovery schools. These schools serve students who have fallen behind in their education, and the state rightfully holds them to a different accountability framework. However, the current definition of a dropout recovery school is too broad—requiring only a majority (50.1 percent) of students to be enrolled in dropout recovery programs, which allows some schools to avoid standard accountability measures.
HB 96 appropriately tightens this definition. Under the proposed changes, dropout recovery schools must serve only students aged 14-21 who are at least one grade level behind upon enrollment. This ensures that the schools truly specialize in helping at-risk youth and are not being used to shield general-education students from higher expectations. A two-year transition period will allow affected schools to adjust, ensuring a smooth implementation of this reform.
Teacher Policy and Transparency
A high-quality teacher workforce is essential for student success. HB 96 makes important strides by requiring DEW to collect and publish vacancy data across all school districts. This transparency will help address teacher shortages and workforce planning issues.
However, to make this data even more useful, DEW should be required to collect vacancy information from all public schools—including charter schools, STEM schools, and joint vocational districts—not just traditional districts. Additionally, disaggregating vacancy data at both the district and school level will allow policymakers and community leaders to identify localized staffing shortages and craft targeted solutions.
The governor’s budget smartly prohibits the use of seniority or continuing contract status as the primary factor when assigning teachers and instead requires assignment based on the best interests of students. We urge you to keep this provision in HB 96.
The state should also strengthen teacher licensure policies by ensuring that prospective elementary educators demonstrate sufficient content knowledge in math. Unlike middle and high school teachers, elementary teachers are not currently required to pass a standalone math content exam. Establishing a minimum passing score for the math subsection of the PK-5 content knowledge exam would help ensure that all teachers are adequately prepared to deliver high-quality math instruction.
Finally, Ohio should open its door to licensed out-of-state teachers and exempt them from additional reading coursework requirements if they can pass Ohio’s Foundations of Reading licensure exam on the first attempt. The goal of the coursework is to ensure competency to teach reading. If teachers can demonstrate competence on the required assessment, they should be treated as professionals and not be subjected to additional coursework requirements.
Accountability and Transparency
House Bill 96 takes a commendable step in requiring the inclusion of a performance rating on the College, Career, and Military Readiness (CCWMR) report card component. This will ensure that schools focus not just on awarding diplomas, but on preparing students for postsecondary success, whether that is in college, the military, or the workforce.
To further enhance transparency, I encourage the committee to require DEW to create a public, annually updated dashboard tracking the state’s early literacy reform efforts. Ohio has made substantial investments in literacy, and a dedicated public dashboard would allow families, educators, and policymakers to monitor progress at the state, district, and school levels.
Conclusion
House Bill 96 makes critical investments that will strengthen Ohio’s education system. By expanding diagnostic screeners in math and reading, strengthening charter schools, improving career pathways, addressing teacher shortages, and increasing transparency, this budget ensures that all students—regardless of zip code—receive a high-quality education.
I urge the committee to advance this bill with these improvements in mind. Thank you for your time and consideration.