

School Choice
Leftist judge tramples on parental rights, school choice in the Buckeye State
Last month, Franklin County Judge Jaiza Page issued her long-awaited decision on Ohio’s EdChoice Scholarship lawsuit.
Last month, Franklin County Judge Jaiza Page issued her long-awaited decision on Ohio’s EdChoice Scholarship lawsuit.

Last month, Franklin County Judge Jaiza Page issued her long-awaited decision on Ohio’s EdChoice Scholarship lawsuit. Brought forward by a group of school districts—government entities with a vested interest in crushing educational choice—the litigation seeks to abolish the program, uproot more than 100,000 private school students, and force them to attend their assigned public schools. Alas, the judge, an elected Democrat and former Columbus City Council member, sided with the educrats and denounced the program as unconstitutional. Given the certainty of appeal, Judge Page stayed her own decision, which allows EdChoice to continue operating until the case works its way through the system.
Her decision reads more like a left-wing harangue bashing private school choice than serious legal analysis. It parrots absurd talking points about how choice will lead to the “downfall” of public schools, blames the scholarship program (rather than dysfunctional bureaucracy) for districts’ inability to educate students, and accepts a factually deficient narrative that districts are “underfunded.” The judge also ignores hard evidence, presented in her court, that EdChoice has improved public education by introducing healthy competition. Last—and perhaps most troublingly—she dismisses the rights and responsibilities of parents in raising their own children, rights that the nation’s highest court has affirmed for 100 years.
Let’s take a closer look at where Judge Page went so wrong.
Disregards parental rights and responsibilities in education
At a basic level, the judge misses the overarching point of EdChoice—that it exists to empower parents to choose a school that best meets the needs of their children. For many Ohio families, their local public school is a great fit. And following the state constitution, the legislature continues to ensure that all Ohio families have a public school option. Yet no single school—whether public or private—can be all things to all people. For some parents, a private school simply fits better, and EdChoice helps ensure that option is financially viable.
But is empowering parents with choice constitutional? The Ohio Constitution contains no prohibition on private schools or programs that support them. Moreover, we have clear case law affirming their legality. A landmark U.S. Supreme Court case in the area of parental rights in education is Pierce v. Society of Sisters (1925), in which the justices unanimously struck down an Oregon law forbidding private education. There, they famously declared that the “the child is not the mere creature of the State; those who nurture him and direct his destiny have the right, coupled with the high duty, to recognize and prepare him for additional obligations.”
Years later, in Zelman v. Simmons-Harris, the Supreme Court upheld the Cleveland Scholarship—the forerunner of EdChoice—and cleared the way for other states to launch private school choice programs. Closer to home, the Ohio Supreme Court also affirmed the constitutionality of the Cleveland program in state litigation (Simmons-Harris v. Goff, 1999). It also upheld the state’s public charter school law, another form of educational choice, in Ohio Congress of Parents and Teachers (2006).
In sum, the judge’s ruling is out of step with decades of legal precedent that honors parental rights and responsibilities in raising their children, including initiatives that support their ability to choose the best school for their child.
Misconstrues the “no aid” clause of the Ohio Constitution
Staying in the legal realm, the plaintiff school districts argue that EdChoice violates a so-called “no aid” clause in the Ohio Constitution: “no religious or other sect, or sects, shall ever have any exclusive right to, or control of, any part of the school funds of this state.” The judge agreed, but there are two significant problems with this interpretation.
Makes a hash of school funding
In a tale as old as time, plaintiff districts complain that they don’t have enough money—and that EdChoice is to blame for their self-perceived financial woes. Completely ignoring basic school funding data, and demonstrating a lack of understanding of Ohio’s funding system, the judge concurred, declaring that EdChoice results in unconstitutional public school funding.
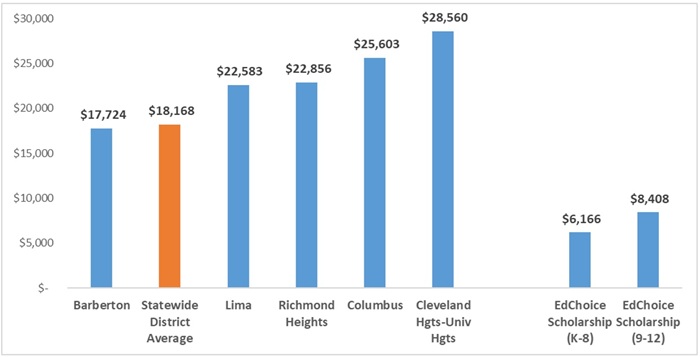
Let us first look at the overall funding levels—not cited anywhere in her opinion—of all named plaintiff school districts. Figure 1 shows the total per-pupil revenue (state, local, federal) received by Barberton, Lima, Richmond Heights, Columbus, and Cleveland Heights-University Heights school districts in FY24—data that are readily accessible on the Ohio Department of Education website. Four of the five districts received more than $20,000 per pupil last year, well above the average district in Ohio and multiples above the current maximum EdChoice scholarship (many recipients receive far less than the maximum amount). Only Barberton—a mixed-income suburban district—received slightly less than the state average, but even its per-pupil funding still far exceeds the scholarship amounts.
Figure 1: Overall revenue per pupil for plaintiff school districts, FY24
In Judge Page’s opinion, she wrote this of Cleveland Heights-University Heights:
Inadequate funding has caused CH-UHCSD to lay off or suspend teachers and other staff members resulting in overcrowded classrooms and insufficient support for special education and English as a second language children.
That’s plain nonsense. The district receives an astronomical—by Ohio standards—$28,560 per student, the tenth highest in the state. That’s “inadequate”? Really? If indeed there are “overcrowded classrooms” and “insufficient support” for special-needs students, the fault lies with district administration, not EdChoice.
What does the judge focus on in her discussion of school funding? Rather than looking at the total funding picture—what really matters for educating students—she cites only state funding, which in turn allows her to decry that some districts’ state aid falls below the scholarship amounts.
This analysis is both simple and wrong. Ohio has long had a “hybrid” system whereby the state and local districts share responsibility for funding education. Under state law, districts must levy a minimum 20 mill (2 percent) property tax to help meet basic funding requirements.[2] Recognizing that wealthy districts have more tax capacity, the state rightly sends them less state aid. It’s a “progressive” system. As a result, wealthier districts like Columbus—one of the state’s most prosperous in terms of property values—receives relatively modest state aid ($4,800 per pupil in FY24). Focusing only on state dollars alone—while ignoring local funds, including the state-required millage—betrays either a poor understanding of school funding or (more deviously) an intentional misreading of the policy to arrive at a predetermined decision.
Last note on funding: Judge Page engages in some distasteful revisionist history when it comes to Ohio’s current funding formula. She faults state lawmakers for not fully funding the Cupp-Patterson formula over the past four years. It’s true—due to its exorbitant price tag—the formula has been phased in. But what the judge fails to acknowledge is that the legislative architects of the plan, and the districts and unions that supported it, agreed to the phase-in. But now, in a bizarre twist, she declares EdChoice unconstitutional because of the formula phase-in for public schools.[3]
Ignores the empirical evidence on EdChoice
As a final swing and miss, the judge chose to ignore evidence refuting districts’ claims that EdChoice has done them harm. Consider the research findings, much of which were included in expert testimony and a Fordham report by Professor Stéphane Lavertu of The Ohio State University.
The evidence makes clear the negative consequences of following the judge’s opinion. Without EdChoice, Ohio would have a weaker K–12 education system, one in which complacency in the public school sector is acceptable and where Ohio students have diminished opportunities. Is that the “thorough and efficient” education system our constitutional framers sought?
* * *
Amped up by the education establishment and liberal media, private school choice has become one of the left’s favorite scapegoats. But the rhetoric falls far short of the reality. Sadly, Judge Page bought into the political theater while trampling on parents’ rights, court precedent, basic facts about school funding, and evidence showing that EdChoice improves public schools. With any luck, the appellate courts will put a quick end to this sad show. The sooner the better.
[1] A U.S. Commission on Civil Rights report cites thirty-eight states (including Ohio) as having a Blaine Amendment: https://www.usccr.gov/files/pubs/docs/BlaineReport.pdf (p. 53).
[2] Districts can, and many do, tax above that minimum rate with voter approval.
[3] The underlying assumption is that, if EdChoice had not existed, the legislature would have fully funded Cupp-Patterson from the start. But that’s a stretch, as the legislature could have simply used scholarship funds for other purposes (e.g., higher education, roads, parks, Medicaid, etc.). Moreover, the amount spend on scholarships was well below the spending required to fully fund Cupp-Patterson.

In June, The Washington Post published an op-ed arguing that if schools evaluated and paid teachers based on student outcomes they would achieve better results. As proof of what’s possible, the authors—scholars Eric Hanushek and Margaret Raymond of the Hoover Institution—cited teacher pay initiatives in two cities: Washington, D.C., and Dallas.
For Ohioans, these reform efforts are likely unknown. But there’s a lot to learn from their experiences that could help inform a successful merit-pay strategy in the Buckeye State.
First, some background. Officials at the District of Columbia Public Schools (DCPS) began linking teacher performance to pay and retention during the 2009–10 school year. Under this system, known as IMPACT, teachers who were rated “ineffective” were dismissed and those rated “minimally effective” were given one year to improve. Higher-performing teachers were eligible for a bonus of up to $25,000 each year they earned a rating of “highly effective.” According to an analysis[1] published in Education Next, DCPS dismissed the majority of very low-performing teachers during the early years of IMPACT, while other low performers were 50 percent more likely to voluntarily leave. Those who stayed got better, likely responding to the large financial incentive. “Improved teaching was common,” the analysis finds, and “student achievement increased as a result.”
A few years later, the Dallas Independent School District (ISD) replaced traditional salary schedules with a pay system tied to evaluations. Teachers’ compensation was based on their evaluation score averaged over two years, though salaries were only adjusted downward if teachers scored at a lower level for three consecutive years. Performance-based salaries during the first year ranged from $45,000 to $90,000. A separate Education Next analysis, co-authored by Hanushek, found that in the four years (2015–2019) after Dallas ISD adopted its new performance-based system, student performance on standardized tests improved while scores in similar Texas schools stayed flat. Like D.C., teacher turnover during implementation was concentrated among lower-rated teachers.
For Ohio policymakers, who are considering if and how to implement teacher merit pay in the Buckeye State, three lessons stand out.
1. Implementing effective performance pay initiatives requires radical change, which in turn requires political courage.
In their op-ed, Hanushek and Raymond observe that, despite positive outcomes for students in both districts, “performance-related reforms have not caught on in the rest of the nation’s schools.” That’s disappointing but not surprising, given the considerable controversy, pushback, and political fallout that comes with such sweeping reforms.
Washington, D.C., and Dallas are instructive examples. In the nation’s capital, the chancellor who oversaw the launch of IMPACT, Michelle Rhee, caused plenty of waves. She eventually resigned after the mayor who appointed her, Adrian Fenty, failed to win reelection, in part because of what was happening in DCPS. There were also plenty of clashes in Dallas, some of which began even before bold changes were implemented. According to Education Next, the teacher turnover rate “rose sharply” in Dallas when performance pay reforms were “highly publicized but still in the development stage.” This produced “major shifts” in the workforce, as the share of novice teachers with no prior experience quadrupled within three years.
For Ohio, there are two lessons to be learned. First, if state leaders want to use performance pay to boost student outcomes, then tinkering on the edges of teacher evaluation and rigid salary schedules isn’t going to cut it. Radical change will be required. Second, enacting radical change is controversial and will lead to considerable pushback and political fallout. (Just ask former Governor John Kasich, who also tried to implement merit pay, along with a host of other collective bargaining changes.) If Ohio leaders are prepared to stand their ground and spend significant political capital on the issue, then they could embrace teacher performance pay as an evidence-based way to boost student outcomes. But if they’re going to repeat their unfortunate history of backing down from evidence-based reforms when the going gets tough, they should probably sit this one out.
2. Locally-driven efforts are more likely to be successful than those managed by the state.
As is the case for many states, Ohio’s history with top-down teacher policy reform isn’t a pretty one. In 2011, lawmakers introduced a statewide initiative aimed at supporting novice teachers with a residency model like those used in the medical field. After lots of pushback and making significant revisions to the program in 2015, 2017, 2018, 2021, and 2023, Ohio is now right back where it started—requiring very little support for new teachers. State-managed teacher evaluations experienced a similar rollercoaster, with lawmakers responding to persistent pushback by making almost constant tweaks until finally passing legislation last year that allows districts to forgo the state’s framework and develop and use their own.
In short, the top-down stuff hasn’t been very successful. But Dallas offers an alternative that Ohio is already poised to emulate. Dallas ISD began its teacher-pay reforms after new state rules enabled districts to develop their own frameworks for rating teacher performance. Texas also uses its Teacher Incentive Allotment to provide schools with “lasting funds for outstanding Texas teachers to remain in the classroom and improve student outcomes.” If Ohio lawmakers eliminate the mandatory step-and-lane salary schedules currently in state law, that would open the door for innovative Ohio districts to do what did Dallas did. Creating a system that incentivizes districts to innovate (rather than forcing it on them) and leaves nuts-and-bolts implementation up to local leaders would help Ohio avoid repeating history.
3. Multiple measures of effectiveness are crucial.
Opponents of performance pay often argue that it’s difficult to measure teacher contributions to student learning, and thus unfair to link student outcomes to teacher pay. In an attempt to make evaluations as fair as possible, many districts have utilized multiple measures of teacher effectiveness to assign ratings that determine pay.
That’s true in both Dallas and D.C. The evaluation system in Dallas included ten classroom observations (some of which were unannounced) each year by the same observer, evidence of student progress toward established learning objectives, test-based measures of achievement growth relative to comparable students, and schoolwide achievement. Dallas ISD also surveyed students in grades 3–12 each spring and incorporated their responses into teacher ratings. Meanwhile, during the first three years of IMPACT, DCPS assigned teachers a rating based on classroom observations, various measures of student learning, a schoolwide value-added measure, and contribution to the school community (as assessed by the principal). Of the five classroom observations conducted for each DCPS teacher, three were conducted by an administrator and two by “master educators” who worked with several schools. Only the first observation was announced in advance.
Research also supports using multiple measures when it comes to performance pay. According to a comprehensive meta-analysis, student test scores improve when pay is not based solely on test scores. To ensure fairness and gain teacher buy-in in Ohio, it will be crucial for districts and schools (under the direction of the state) to include multiple measures in any framework that ties teacher impact to compensation.
***
Performance pay for teachers is the definition of a sticky subject. There is evidence from districts like Dallas and D.C., as well as other places, that it can boost student outcomes. But there’s also a long history of controversy and pushback, not to mention significant questions about how to design and implement programs to ensure they’re fair and effective. It’s too soon to tell how serious Ohio policymakers are about trying (again) to bring teacher merit pay to the Buckeye State. But as they explore their options, they’d be wise to heed the lessons outlined above.
[1] The analysis first appeared in the Fall 2017 issue and is based on data from the first three years of IMPACT (2009–10, 2010–11, and 2011–12).

Even though Governor DeWine has put his signature on the biennial state budget bill, the process still isn’t quite over. On the heels of sixty-seven line item vetoes, lawmakers are planning a return to Columbus to override several nixed property tax provisions in late July. Given the uproar over rapidly increasing property taxes—a result of skyrocketing home values—as well as the legislature’s extensive review of this issue, it’s not surprising to see lawmakers seeking to undo the property-tax vetoes and making every effort to quickly provide taxpayer relief.
In his veto message, DeWine acknowledged citizens’ concerns and promised to convene a working group to explore reform efforts. But he also expressed unease about the fiscal implications of the proposed measures on school districts. The governor is correct that a balance must be struck, and he rightly nixed one of the General Assembly’s proposals that would diminish districts’ capacity to wisely steward funds. However, he was wrong to veto two reforms that would create a fairer and more intelligible property tax system for voters, one that allows them to hold districts more accountable at the ballot box. In summary, here’s where the General Assembly should land on three vetoed property-tax items.
Override the governor’s vetoes regarding:
Emergency and replacement levies. The General Assembly proposed to eliminate districts’ ability to put two unconventional types of levies before local voters: the emergency levy and replacement levy.[1] The governor vetoed the proposal on grounds that they are “important tools” for school districts. However, both types of levies defy principles of transparency and fair play, as they use language that could be easily misunderstood by citizens and give districts built-in advantages at the ballot box.
Twenty mill floor calculation. The General Assembly proposed an important change in the way the 20 mill (2 percent) property tax floor is calculated. As a quick refresher, districts whose rates are at this floor automatically generate additional “unvoted” tax revenues when property values increase. This can be a windfall for districts, but it also hammers taxpayers who are no longer protected by Ohio’s longstanding tax reduction factors. In short, whether a district is at the 20 mill floor is highly consequential for taxpayers, and as of 2023, about two-thirds of districts are at this floor in at least one of two property classes (residential or commercial/industrial).
But in a mathematical quirk, certain property taxes (emergency levies, most notably) do not count towards the 20 mill floor. This allows districts to exploit the floor and emergency levy, together, to gain revenues through inflation and by putting another levy on the books. House Bill 96 would close this loophole by including already enacted emergency levies in the 20 mill calculation. This will move some districts above the floor, and would provide residents in those districts with the same inflationary protections that citizens in other districts receive.
Let the governor’s veto stand on district cash carryovers
Concerned about the large sums of cash some districts have accumulated, the General Assembly proposed a carryover threshold—a year-end cash balance at or above 40 percent of a district’s annual expenditures—that triggers property tax refunds to local citizens. The idea was understandable: It would provide immediate tax relief for Ohioans residing in districts with seemingly “excessive” amounts of funding. But the proposal also runs the risk that districts will simply unload their cash reserves in careless ways—e.g., giving every school employee big one-time bonuses—just to get under the threshold. This would not only represent wasteful spending, but also undermines the policy goal of providing tax relief. Governor DeWine was right to veto the simple yet likely ineffective cash carryover provision.
* * *
Many Ohioans are clearly upset with the local tax system, so much so that a grassroots initiative has emerged to repeal property taxes altogether. That effort would be incredibly disruptive to school districts and other municipal services that rely on this revenue source. Yet the public frustration is understandable, given the system’s complexity and structural flaws that seem to favor higher taxes. This year’s budget bill took some thoughtful steps toward a fairer and more even playing field between citizens and local government. Those provisions should be enacted as soon as possible.
[1] The budget bill also eliminates the “substitute” levy, which extends an emergency levy slated to expire.

Two years ago, Governor DeWine and the General Assembly worked together to establish a statewide early literacy initiative aligned with the science of reading. Their collective effort was prompted by lackluster reading achievement: Approximately 40 percent of Ohio third graders weren’t proficient in reading.
Given all the research pointing to worrisome outcomes for struggling readers, policymakers were right to act. And it’s good news for students and families that the state’s science of reading initiative is now well underway. But reading isn’t the only subject that needs an overhaul. In fact, Ohio’s achievement results in math are actually worse than the reading scores that prompted an all-hands-on-deck statewide initiative. Consider the following:
Just like with reading, math achievement has a big impact on students’ long-term outcomes. And while there isn’t an official “science of math,” experts have identified key elements that should guide math instruction in schools. Moreover, Ohio’s early literacy initiative includes several promising practices that could apply to math. But collectively, lawmakers have yet to prioritize numeracy like they did early literacy. They had an opportunity to do so during the budget cycle that wrapped up a few weeks ago, but most math proposals got axed in conference committee.
The good news is that the state budget isn’t lawmakers’ only opportunity to pass legislation. Here are three numeracy policies they should consider enacting when they return this fall.
1. Supporting teachers with rigorous pre-service training and ongoing professional development.
Teachers matter more to student achievement than any other element of schooling. If state leaders are serious about improving math outcomes, then ensuring that both prospective and current teachers receive high-quality training is crucial. Lawmakers could accomplish this in three ways.
First, Ohio needs to bolster the math content training that teacher candidates receive before they enter the classroom. A recent report from NCTQ found that more than a third (36 percent) of Ohio’s elementary teacher preparation programs earn a grade of D or F for failing to provide sufficient instruction in math content. To fix this, lawmakers should take a page out of their early literacy book: Establish teacher preparation standards that encourage effective and consistent math content training and require periodic audits to verify that programs are following state standards.
Second, Ohio should raise expectations for teachers’ content mastery. As part of state licensure requirements, middle and high school teachers must pass math-specific content knowledge exams. Doing so signals that they’ve mastered the content they will be expected to deliver to students. But Ohio doesn’t require elementary teachers to pass a math-specific test. Instead, they take a composite content knowledge exam that combines math with other subjects. Because teachers are only required to achieve an overall passing score, high performance in other subject areas could easily mask math deficiencies. To ensure math content mastery, state leaders need to establish a minimum passing score for the math subsection of the elementary licensure content exam and require prospective teachers to meet or surpass that score before they can teach math. Teacher candidates who don’t meet the required minimum score can still earn their license. They just won’t be permitted to teach math until they pass the math subsection of the exam.
Third, policymakers should invest state resources in boosting the content knowledge and skills of current math teachers. Research indicates that when professional development (PD) is aligned to high-quality curricula, it better supports teachers. That, in turn, can lead to improved student outcomes. Ohio already has a PD blueprint thanks to our statewide reading initiative. Enacting a similar effort in math would be wise.
2. Prioritizing high-quality instructional materials.
Research demonstrates that high-quality instructional materials (HQIM) can improve student learning and achievement. That’s why a key feature of Ohio’s early literacy initiative is its emphasis on state-approved HQIM. It’s time to do the same for math. Lawmakers should take a two-pronged approach.
First, they should focus on identifying HQIM in math. Just as they did with reading, they should require the Department of Education and Workforce (DEW) to review K–12 core math curricula that are currently on the market and identify those that are high quality based on their alignment with state math standards and evidence-based practices. Unlike reading, however, districts should not be required to adopt math materials from DEW’s list (at least not yet). For now, the focus should be on identifying high-quality options so that districts aren’t flying blind when it’s time to update their curricula and materials.
Second, lawmakers should improve transparency. Current law requires public schools to report to the state the core curricula and instructional materials they use in English language arts in grades PK–5. Schools should also be required to report this information for math. Once reporting requirements are in place, state report cards should identify the reading and math curriculum used in each school and whether it’s been designated by DEW as high-quality. Not only would this effort improve transparency with the public, it would provide an incentive for districts to use high-quality materials.
3. Requiring interventions for students who are struggling in math.
When students take Ohio’s state exams, their results fall into one of five performance levels: limited, basic, proficient, accomplished, and advanced. The top three levels (proficient, accomplished, and advanced) are considered passing scores. A student who scores at the accomplished or advanced level is considered on track for college and career readiness.
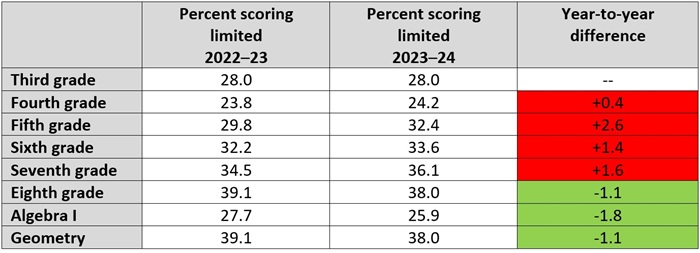
Unfortunately, data from the two most recent school years show that a significant percentage of Ohio’s students are scoring at the lowest performance level (limited) in math. Between 2023 and 2024, the percentage of students scoring in the limited category increased in grades four, five, six, and seven. The percentage of students scoring limited in eighth grade and high school math decreased, but the overall number in those grade levels remains staggeringly high—more than a fourth in Algebra I, and more than a third in eighth grade and geometry.
Chart 1. Percentage of students scoring limited in math
To their credit, some lawmakers have tried to tackle this issue. The Senate, for example, incorporated into its version of the proposed budget a previously separate bill that would have required public schools to provide academic intervention services to students who score limited on math and reading state tests. Schools also would have been required to develop an improvement and monitoring plan for each student who qualifies for intervention services in math, to involve parents in developing that plan, and to continue implementing it until a student achieves current grade-level skills. Unfortunately, none of those provisions made it into the final budget. Given how many students are scoring in the limited range, lawmakers would be wise to revive the effort.
***
Ohio policymakers deserve praise for their early literacy efforts. The statewide initiative that’s currently underway could help thousands of students achieve better short- and long-term outcomes. But numeracy matters, too. State data are clear that far too many students are struggling in math, and districts and schools need help to bolster their instruction and boost intervention efforts. Now is the time for state leaders to act—and teacher training, high-quality instructional materials, and a statewide intervention policy for struggling students are the best places to start.

Improving educational opportunities for inner-city kids was originally a bipartisan endeavor. Conservatives and urban Democrats both championed public charter schools and private-school vouchers—primarily for large, densely populated, and economically segregated urban areas. That approach made practical sense, as that’s where a great number of low-income kids reside and where population density makes school transportation feasible and competition most beneficial. Indeed, both charters and vouchers have brought considerable benefits to Ohio’s low-income urban students.
But many high poverty communities (those with poverty rates in the top 10 percent) are not in big cities, and the exercise of school choice looks different in those areas. As one moves out from cities toward rural areas, families increasingly enroll their kids in districts other than their own (primarily via Ohio’s open enrollment program) or pursue self-funded options such as homeschooling and private schools that do not participate in the state’s voucher programs.
The use of inter-district open enrollment is encouraging, as that program has yielded considerable benefits for low-income students. But extensive homeschooling and self-funded enrollment in private schools means that these kids’ educational outcomes are not reflected in Ohio K–12 data, making it difficult to assess their educational trajectories. These “off-grid” schooling options pose a challenge for community members concerned that all Ohio families have access to a high-quality education, though recent state and federal efforts to expand private-school funding could help with that.
Ohio’s high-poverty communities are not primarily urban
Table 1 compares high-poverty Ohio districts—where Census-based poverty estimates for school-age residents are in the top 10 percent statewide—to the rest of Ohio school districts. The typical high-poverty district is indeed larger (median of 2,403 school-age residents as opposed to 1,771). Predictably, in part because of their higher child poverty rates (31 percent instead of 12 percent), test scores in district schools are near the bottom. The default educational option in these high-poverty communities—the residential district school—has average test scores at the 12th percentile of Ohio districts.
Table 1. Comparing Ohio’s highest poverty districts to other Ohio districts
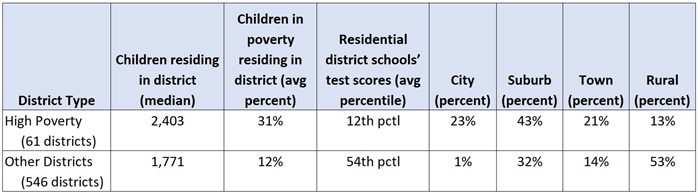
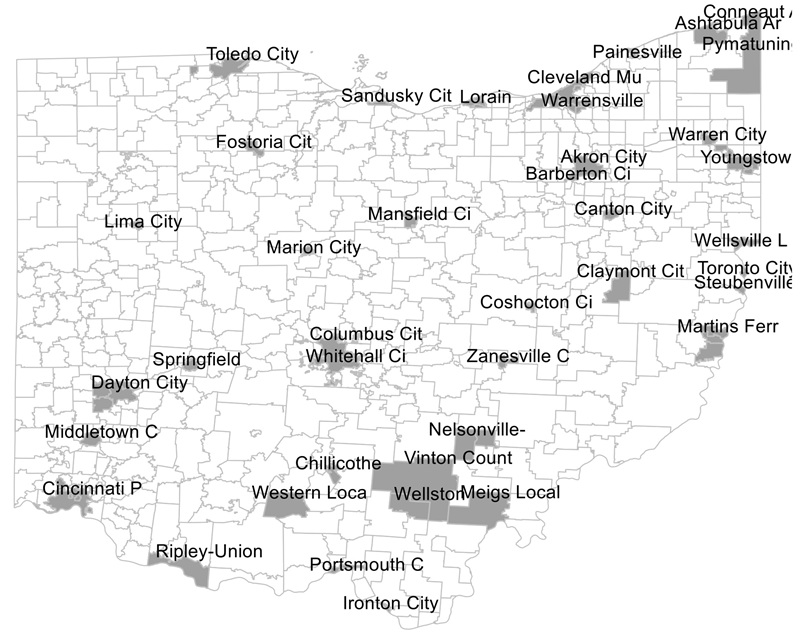
Perhaps the most striking takeaway from the table, however, is that less than a quarter of high-poverty districts are in cities, reflecting that there aren’t all that many city districts in Ohio. The modal high-poverty district is a suburban district (43 percent), and over one-third are towns or rural communities (21 and 13 percent, respectively). The map below (Figure 1) illustrates the geographic distribution and labels some of these districts. (A full list of the high-poverty districts, along with their NCES locales, appears in the first of three supplemental tables at the bottom of this post.) The geographic spread of high-poverty districts is remarkable.
Figure 1. Communities with the highest child poverty rates
School choice is prevalent outside of city districts, but it takes a different form
School options like charters and private-school vouchers benefit from residential density. Thus, one should expect the use of these options to decline as one moves from cities to less populated suburbs, towns, and rural areas, respectively.[1] Figure 2 (below) demonstrates exactly that. Among Ohio’s high-poverty city districts, 19 percent of school-age kids are enrolled in charter schools and 13 percent receive scholarships to attend private schools. Figure 2 indicates that these percentages steadily decline as one moves from cities to rural areas, where 3 percent of children attend charter schools (a decline of 16 percentage points from 19 percent) and 1 percent use private-school vouchers (a decline of 12 percentage points from 13 percent). Note that most rural charter school students (2 of the 3 percent) attend online virtual charter schools.
Figure 2. Voucher and charter use across locales
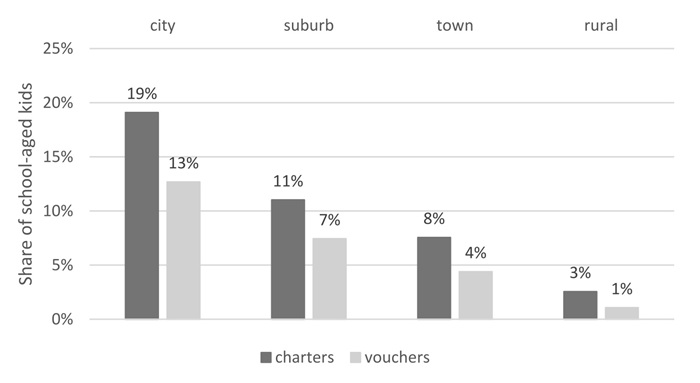
Without access to brick-and-mortar charter schools or private-school scholarships—or the financial means to relocate to another district—families in high-poverty districts can enroll in online charter schools (which, interestingly, they do at slightly lower rates than their city-dwelling peers). But they can also participate in a form of choice unavailable to many city residents: inter-district open enrollment. That is because Ohio’s city districts are surrounded by suburbs that generally do not allow students from other districts to enroll if they have seats available (unless they pay tuition), whereas most other districts participate in Ohio’s open enrollment program. Another option—one that can be very costly in terms of time and money—is to homeschool or send kids to private schools that do not participate in the state’s voucher program. These are “off-grid” options, as there is far less regulation and data collection because little or no public money is provided.
Figure 3. Interdistrict and “off-grid” choice across locales
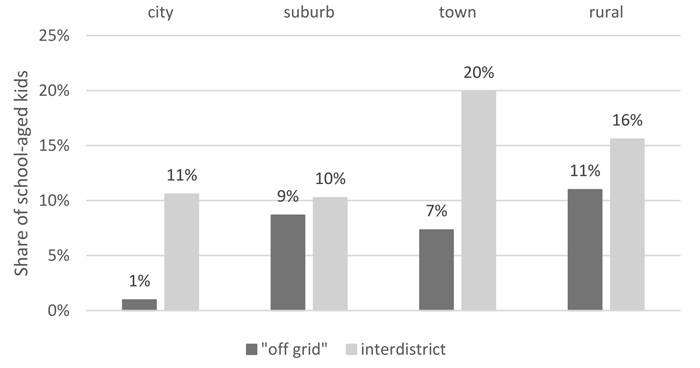
Figure 3 reveals that, outside of cities, families are far more likely to participate in off-grid options—by magnitudes of 6–10 percentage points. Homeschooling rates in cities and suburbs are comparable (at approximately 1–2 percent of school-age residents) and climb a bit for towns (to 3 percent) and rural areas (to 4 percent). (These and other disaggregated statistics are available in supplemental tables here.) That means that the bulk of the “off-grid” difference reported in Figure 3 is some other option for which the state does not report statistics. These could be chartered or non-chartered private schools, but one cannot tease that out from the data. One can only discern that some school-age residents are unaccounted for.
Figure 3 also reveals that families residing in high-poverty towns and rural communities are far more likely than families in cities (and suburbs) to enroll their kids in a district different from the one in which they reside. That means they are indeed far more likely to be enrolled in district schools than their urban counterparts, but the twist is that they are not necessarily attending the schools run by their own district. That is not the case in suburbs, probably because students are kept out of higher income neighboring districts that don’t participate in Ohio’s open enrollment program.
Not less choice, but quite different
The countervailing patterns above largely offset one another, such that overall rates of school choice do not vary significantly across cities, towns, and suburbs. The off-grid school options accessed in non-urban, high-poverty communities—particularly rural districts—create a bit of a blind spot when assessing schooling quality in Ohio. But the good news is that many families outside of big cities have multiple public district options available to them. Making sure that these public options are high quality must remain a priority.
[1] Since the early 2000s, charter schools have been able to locate in most high-poverty districts because they historically have been identified as poorly performing on state-issued report cards. Notable exceptions are the high-achieving Steubenville and Bellaire districts. Since 2020, charter schools have been able to locate in any Ohio district.

Acquisition of workforce credentials—certificates or licenses that are earned over a short time period and which signal mastery of a specific career-relevant skill—has surged in recent years. For example, U.S. Department of Education data show that short-term (one year or less) certificate attainment grew at a rate of 33 percent between 2013 and 2023. By comparison, bachelor’s degree attainment grew at a mere 8 percent over the same time period while associate degree attainment fell by 5 percent. This rapid rise in the pursuit of credentials has led to concerns over an equally rapid rise in low-value or low demand credentials that cost money to earn but don’t produce a measurable economic benefit for earners. A new report from AEI and Burning Glass Institute digs deep to try and identify which types of credentials are beneficial to earners and which are not.
The research team uses data from Burning Glass Institute’s comprehensive labor market database, called Lightcast, which comprises the detailed career histories of over 65 million Americans, and Credential Finder, an exhaustive registry of more than 1.1 million credentials offered by universities, employers, labor unions, nonprofits, and many other entities in the United States. They start by identifying a set of the most-commonly earned credentials—a total of 23,444—then use advanced AI and natural language processing tools to gather detailed information about the education, employment, wages, and demographics of the individuals who earned those credentials. Labor market outcomes for credential earners are compared to a counterfactual cohort of similar workers (matched on gender, race/ethnicity, education level, work experience, and pre-credential occupation) who did not pursue the given credential, so as to isolate the impact of the credential on three outcomes of interest: wage changes, job promotions, and job switches. Additionally, they analyze the more than 2,050 providers from whom these credentials were earned, looking for evidence of differential quality or effectiveness among them.
On the upside, the researchers found that the top 10 percent of credentials examined provide an incremental earnings boost of nearly $5,000 annually just one year out from earning the credential. Nursing credentials seem to provide the biggest returns. On the downside, the average credential earner overall gets only $1,200 more than their non-credential-earning peers. Depending on the cost of the credential program, it could take years for the average earner to break even. This wide span of wage outcomes persists even when narrowed to specific job fields. Meanwhile, very few of the most common credentials led to promotions, with the share of credential earners moving up in their field only 4 points higher than it would have been without the credential. The maximum boost is 15 points, in the project management field (think Six Sigma certification and the like).
Job switching is another strong motivator for pursuing a new credential. The results here are variable, with earners in the bottom decile of credential quality seeing a 3-percentage-point bump in job change success, while the top decile of credential quality see a 20-percentage-point bump compared to job switchers without credentials. Once again, nursing is the area where earning credentials is most likely to lead to successful job changes.
As for provider quality, the researchers find a mixed bag. There seems to be no direct connection between a well-known “brand name” provider and outcomes. One example provided is Stanford University. Their (now-discontinued) Data Science Foundations program was associated with $4,200 in incremental wage gains, while their project management certification failed to boost wages meaningfully for any credential earner. A similar disconnect was found among certain credentials offered by LinkedIn. The findings suggest there’s a complex dynamic at work among providers, specific credentials, credential-earners’ goals, and employers’ mindsets that will require more analysis to understand.
Short-term credentials are more attractive than ever, as they can help learners master workplace skills on a flexible schedule at lower cost than a college degree and potentially lead to higher pay and/or a better job. These benefits explain the rapid rise in attainment. The authors of this report conclude from their analysis, however, that “most credentials fail to deliver” on the promise. They call for “a new mechanism for assuring quality,” eschewing process-based evaluations that are the hallmark of traditional accreditation regimes, and instead focusing on empirical data on the outcomes that earners experience.
SOURCE: Matt Sigelman et al., “Holding New Credentials Accountable for Outcomes: We Need Evidence-Based Funding Models,” AEI and Burning Glass Institute (June 2025).

Rigorous research shows that boys and girls exhibit similar core numerical skills during infancy and early childhood, but the pervasive stereotype that boys are better than girls in the subject leads to behaviors that quickly transform that initial promise into later reality. As years of schooling progress, an achievement gap emerges and widens between the genders, and ultimately females end up consistently underrepresented in math-intensive college majors and jobs. Prior evidence suggests that the trouble starts early, and a new report in the journal Nature sharpens the picture.
A team of researchers from France and the United States, led by Pauline Martinot, a physician with a background in neurodevelopment and global health, makes use of four years of data from the French national testing program called EvalAide. It is a series of tests designed by the education ministry to give every French teacher in first and second grade a detailed picture of the needs, achievement levels, and progress of each child in their class, covering both language and mathematics. French law generally requires students to begin first grade in the September following their sixth birthday. Nationwide testing is conducted at the start of first grade, the middle of the first-grade year, and at the start of second grade. Results from each administration are given to teachers and parents, with the idea that teachers will explain to families what pedagogical means are being and will be used to boost outcomes for the next test, and families will have direct insight into what is and is not working along the way. Martinot and her team follow four cohorts of students entering first grade across the country from 2018 to 2021—more than 2,650,000 children.
The average mathematical performance of boys and girls was nearly identical at the start of first grade. By the middle of first grade, however, a small but already highly significant gap favoring boys was observed. By the start of second grade, that effect size had quadrupled, creating a giant gap between boys’ and girls’ test performance. This pattern repeated in each of the four years studied here—with no variation for Covid-impacted school years—and varied only slightly across family, class, and school type and across socioeconomic levels. Various other robustness checks were made, including analyzing only the parts of the EvalAide test that were identical across all test administrations (the majority of questions are designed to increase in difficulty with each test), controlling for variations in student age at test administration, and controlling for varying amounts of schooling received prior to first grade. The researchers even analyzed selected pairs of boys and girls who were closely matched on both math and language test results, as well as numerous demographic factors at the start of first grade. These students’ math outcomes still diverged in a similar pattern to the overall findings on both subsequent test administrations.
The researchers learned more about how the gap is forming: At the first test administration, although boys and girls had the same mean score, boys were over-represented at both ends of the distribution (lowest and highest deciles). Thus, similar averages for boys and girls. After one year of schooling, however, the picture changes dramatically, with the top 5 percent of test performers comprising more than twice as many boys as girls (2.3 boys for each girl). And this same pattern was observed in the vast majority of individual classrooms—tens of thousands of them across France—every year. Martinot and her team caution that these are not causal findings and likely don’t generalize beyond France, but they are satisfied that something is occurring within first grade classrooms across the country to manifest these alarming shifts in academic outcomes.
They conclude with speculation on the causes of this pervasive pattern, largely focusing on the behaviors of adults—teachers and parents/guardians—who adhere to gender-based stereotypes and transmit them to the young people in their care. It is also suggested that math starts to “get serious” as soon as it becomes an “academic subject” in its own right and that this new emphasis on math achievement might serve to amplify adult mindsets around it and to make students, especially girls, more receptive and responsive to those preconceptions, whether problematic or beneficial. As to solutions, the report encourages education for teachers and parents to erase gendered stereotypes, as well as any anxieties of their own on the subject, and suggests schools should provide access to strong role models of scientists, analysts, teachers, astronauts, and statisticians for girls to appreciate and emulate. Good practices for anyone interested in boosting the presence of women and girls in math and science.
SOURCE: Pauline Martinot et al., “Rapid emergence of a maths gender gap in first grade,” Nature (June 2025).
By Aaron Churchill
Ohio is on a roll, with economic development gaining speed across the state. Earlier this year, Anduril Industries—a California-based technology company—announced that it will build an advanced manufacturing facility in Pickaway County. Intel is in the midst of constructing a massive semiconductor production site near Columbus. Healthcare providers have been expanding, while oil and gas development continues to boom in Eastern Ohio.
At a press event trumpeting the expansion of a Ford plant in Avon Lake, Governor DeWine emphasized the need for a strong workforce to attract investment. The Akron Beacon Journal noted:
The key, however, always has been Ohio’s talented workforce, DeWine said. “The controlling factor always is, are the workers there? Are there workers with the skill set? Are there workers who can do the job?”
The governor is right. If Ohio is to capitalize on the opportunities for growth and prosperity that lie ahead, the state must have a highly skilled workforce. And developing that talent pipeline begins in today’s K–12 schools.
Ensuring that every student exits high school proficient in math and reading remains the core talent imperative—something that Ohio still has much to do to accomplish. Yet above and beyond a solid academic foundation, schools must also provide preparation aligned with students’ post-secondary career plans, including specialized/advanced coursework and opportunities for on-the-job training. For the two in five students who head directly into the workforce, schools must help them build the career-technical skills needed to secure good-paying jobs right out of high school.
Recognizing the importance of readying young people for career success, Ohio has recently undertaken efforts to elevate career-technical education (CTE). These initiatives include building career-focused pathways to high school graduation, providing financial incentives for high-quality CTE programs, and supporting work-based learning. Just this spring, Governor DeWine proposed in his budget recommendations a new requirement that every student create an individualized career plan during high school.
As this push continues, it’s important to step back and ask some basic questions. Just how many students participate in CTE courses? Or attain industry-recognized credentials? Complete an on-the-job experience? What career fields are most and least represented? Are any particular student groups getting left behind? Overall, what type of progress is Ohio making to promote high-quality programs, and how might policymakers keep improving it?
Authored by Jay Plasman of The Ohio State University, this report provides a big-picture overview of CTE in the Buckeye State. It analyzes recent trends in participation, as well as patterns by career field, key student groups, and type of school. Some of the data presented here are publicly available and parts of the puzzle have been assembled in such publications by ExcelinEd, Ohio Excels, and in earlier Fordham pieces. Yet we know of no consolidated review, and such a report could be helpful to state and local leaders seeking a clearer understanding of this area of education.[1]
The present report focuses on key measures of CTE participation: coursework, credential attainment, and work-based learning. Here’s a summary of the main findings.
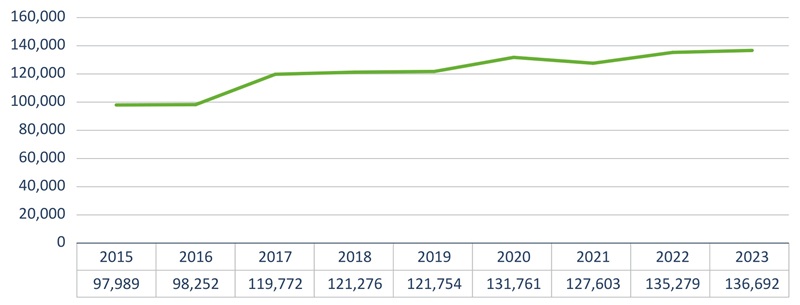
1. Coursework participation is indeed on the rise. Roughly one in four Ohio high school students completed at least one CTE course during the 2022–23 school year, up from one in six during 2014–15. In terms of actual headcounts, 136,692 students completed a course in 2022–23 versus 97,989 students in 2014–15.
2. One-third of Ohio students attain CTE “concentrator” status by graduation. Among the class of 2023, 44,246 students—about one in three—completed two or more courses in a single career pathway, thus achieving the federally defined “concentrator” status. The number of concentrators has risen when compared to the class of 2020 when 36,021 students met this coursetaking benchmark.
3. Attainment of industry-recognized credentials has soared in recent years. In 2021–22, Ohio high school students earned 69,883 credentials, while just 14,500 were earned in 2014–15—a nearly fivefold increase. This count includes any credential that is approved for the purpose of meeting certain elements of state graduation requirements.
4. Attainment of more-selective IWIP credentials has also risen significantly. Recognizing that not all credentials are of equal value, state lawmakers recently created the Innovative Workforce Incentive Program (IWIP), which provides additional funding to schools when students earn high-priority credentials in select career fields such as IT or manufacturing. The number of IWIP credentials earned rose from 3,031 in 2019–20 to 19,175 in 2022–23.
5. Participation in work-based learning ticked upward in the most recent year. In the class of 2023, 12,567 students, or about one in ten, accumulated more than 250 hours of work-based learning experience (e.g. apprenticeships or internships) during high school. This represents an increase compared to the roughly 8,000 students in the class of 2022 who met the hour threshold.
It’s clear that more and more Ohio students are availing themselves of career-technical learning opportunities. But not everything is rosy in this realm—and the study also reveals several concerning patterns—and areas ripe for attention. They include the following:
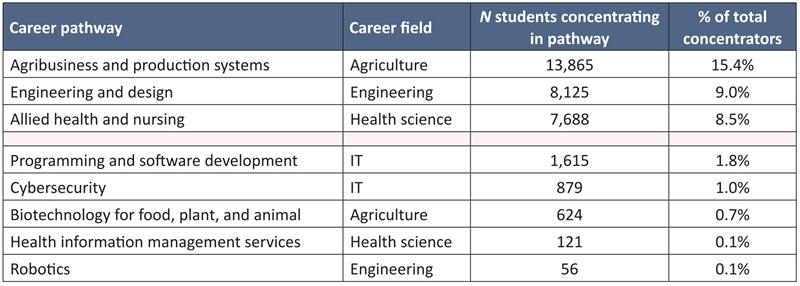
1. Several high-tech career pathways are underrepresented in CTE coursetaking. The state categorizes courses into sixteen career fields, which get subdivided into forty-six career pathways. These are akin to college majors, as they specify state-approved CTE courses that students may take in a specific domain.[2] As shown in the table below, the three pathways in which students most frequently concentrate are agribusiness and production, engineering and design, and allied health and nursing. However, the bottom section displays five high-tech pathways in which very few young Ohioans concentrate, whether due to meager school offerings or lack of interest. These data suggest significant room to grow programs in high-tech pathways.
Table A: Most frequent pathways of CTE concentration (top) and underutilized high-tech pathways (bottom)
2. More selective IWIP credentials represent a small fraction of total credentials-earned. In 2022–23, just 16 percent of all credentials-earned in Ohio were high-priority IWIP credentials. Hence, the vast majority of credentials—although qualifying for graduation purposes—are in lower-demand career fields and/or more general certifications not closely tied to particular professions. Here again we see ample scope for growth in helping students prepare for high-wage, in-demand careers.
3. Specialized career centers are more likely to provide programs in high-priority career fields. In 2022–23, a slight majority of students (51 percent) attending specialized career centers met “concentrator” status by taking coursework (but may not have earned a credential) in selective career fields,[3] while just 40 percent of students who participated in CTE at “regular” traditional high schools did so. In terms of IWIP attainment, 8 percent of students attending career centers earned these high-priority credentials, while just 2 percent of students enrolled in traditional high schools did so.
4. Low-income and Black students are underrepresented in specialized career centers. Such students were more apt to participate in CTE at traditional high schools, which are less likely to offer high-priority CTE programs, as identified under IWIP. Alongside data showing a proliferation of lower-level credentials in Ohio’s major urban districts (presented elsewhere), this should raise concerns about equitable access to rigorous CTE for students from disadvantaged backgrounds.
5. Too few students receive on-the-job experience during high school. Just 47 percent of the CTE concentrators in the class of 2023 participated in any amount of work-based learning—at least one hour—and only 26 percent achieved the 250-hour mark.
* * *
Based on these data, we conclude with three recommendations for Ohio policymakers.
First, keep pushing for high-quality, high-priority CTE. One area in need of immediate attention is the rigor of the career-tech-focused graduation pathway, which currently steers students into accumulating lower-level credentials as a shortcut to graduation. Instead, lawmakers should implement a graduation pathway that challenges students to complete a coherent set of CTE courses (three or more) and credentialing program in a high-value career pathway of their choice.
Second, revisit what it means to be “career ready.” Ohio currently has a scattershot approach to demonstrating “career readiness.” For instance, on the college-and-career-ready measure of the state report card, schools get credit when students meet just one of a smorgasbord of post-secondary readiness indicators. Ohio needs a clear, career-ready definition that incorporates rigorous CTE coursework (and aligned assessments), high-quality credentials, and work-based learning, all in the same pathway. An integrated readiness measure, which states like Arkansas and Maryland are moving toward, would promote quality and could be incorporated into graduation requirements and other accountability systems such as the report card.
Third, increase access to rigorous CTE. Historically disadvantaged students, particularly in Ohio’s big cities, appear to have less access to high-priority programs. Rural and small-town students may also face diminished on-the-job opportunities, as fewer employers may be present in their communities. Policymakers should pursue strategies that expand access to quality CTE. This might include targeted grant programs to expand IWIP or work-based learning in urban or rural communities. It could also entail stronger promotion of inter- and intra-district open enrollment and dual enrollment. This would allow students to access CTE programs provided by a neighboring school or local community/technical college that is unavailable at their assigned district high school.
As the nation’s seventh largest economy, Ohio continues to be a powerhouse that creates jobs and prosperity for its 12 million citizens. To ensure that the state maintains that lofty perch while advancing the prosperity of its residents in tomorrow’s economy, policymakers must develop a skilled workforce. Creating a top-notch CTE system for primary and secondary students is one piece of a robust talent-development strategy. While progress has certainly been made, this report indicates there is still room for significant improvement. Gearing CTE more closely to high-wage, in-demand professions will be a heavy lift, one that should include school systems, higher education, and employers. But it’s one worth undertaking, as Ohio’s future—and that of hundreds of thousands of young people—depend on it.
There are a number of technical terms and acronyms throughout this report that are worth describing and defining here. The first set of terms relate to measures of career and technical education (CTE) participation, while the second set includes terms relating to the types of schools where CTE is delivered to students.
CTE Participation
CTE participants is used to reflect a simple count of the number of students who completed at least one CTE course (Ohio defines completion of a course as being enrolled for at least 90 percent of the scheduled hours or earn at least partial credit) in a given year regardless of grade level in high school; this represents the most basic measure of CTE participation.
CTE concentrators reflects a more rigorous indicator of CTE participation (hereafter, simply “concentrators”). Prior to Perkins V, the federal government allowed states to create their own definition and Ohio used this: “a student who completed two courses and was enrolled in a third course within a single career pathway (OCTAE, 2018).” Now, under Perkins V, the federal government has a national definition of concentrators: “at the secondary school level, a student served by an eligible recipient who has completed at least two courses in a single approved Career Technical Education program or program of study (Ohio Department of Education and Workforce, 2025).” In this report, we examine CTE concentrators using a cohort approach based on year of entry into ninth grade as a means of identifying unique concentrators. Here, a concentrator is defined using the applicable definition for the identified year (i.e., beginning in the 2019–20 academic year, a concentrator is defined using the two-course definition; before 2019, a concentrator is defined using the two course, plus enrollment in a third definition).
Industry-recognized credentials (referred to simply as “credentials,” or IRCs, for the remainder of the report) represent a verification of a student’s skill and competence in an identified field to potential employers (Ohio Department of Education and Workforce, 2024). Ohio has approved hundreds of credentials, which students may earn to meet certain graduation requirements (see Box 2 below). Similar to CTE participants, credential earning is taken as a snapshot of a single year. While credentials can be earned at many levels of education, here we focus on those earned in high school.
Work-based learning (WBL) is defined as “sustained interactions with industry or community professionals in real workplace settings, to the extent practicable, or simulated environments at an educational institution that fosters in-depth, firsthand engagement with the tasks required in a given career field, that are aligned to curriculum and instruction” (Ohio Department of Education, 2020). In Ohio, students who accumulate at least 250 hours of WBL over the course of high school meet career experience and technical skill competency guidelines (see Box 2 below) under state graduation requirements. As with CTE concentrators, we identify WBL using a cohort approach based on the year a student entered ninth grade.
CTE Delivery
Traditional high schools are by far the most common type of secondary institution in Ohio. They are located within comprehensive school districts (i.e., an administrative entity) and provide comprehensive education programming, which may include CTE options. There were approximately 750 traditional high schools in Ohio in 2024.
Vocational high schools are standalone schools within a comprehensive school district that focus on the provision of CTE programming to students. Students in attendance at one of these schools are expected to participate in career preparation through CTE options. There were eight vocational schools in Ohio in 2024.
Joint Vocational School Districts (JVSDs) are direct career-focused education providers that operate as independent school districts and serve students from the surrounding school districts. They typically provide CTE programming in designated career tech centers. Students may attend career tech centers either full time or part time. As of 2024, there were forty-nine career tech centers in operation across Ohio.
Workforce development is a major focal point for policymakers and practitioners around the country. In recent years, Ohio has taken center stage with respect to advancements in workforce development. With major investments from the private sector—including Google, Meta, Amazon, IBM, and the multi-billion-dollar Intel project—and the public sector through the CHIPS Act, Ohio is becoming a leader in workforce investment. The federal government recognized this by designating Columbus, Ohio as one of five Workforce Hubs across the country—an acknowledgement that Ohio is making moves in the right direction.
A key component in ensuring that the state is prepared to meet these expanding and ever-changing labor market needs is to provide high school students with opportunities to access and participate in career readiness activities and programming through career and technical education (CTE). In 2018, the federal government passed the Strengthening Career and Technical Education for the 21st Century Act, a reauthorization of the Perkins legislation that governs and funds CTE across the country. A major focal point of this authorization (the fifth iteration of the Perkins Act, aka Perkins V) was its emphasis on ensuring equitable access to CTE programming in high-demand, high-skill career fields for identified “special populations” including students from economically disadvantaged backgrounds, students with disabilities, English Learner students, homeless students, and students pursuing nontraditional fields.[4] Though students from traditionally underserved racial/ethnic backgrounds, such as Black or Hispanic students, are not officially included among these groups, they are important populations to consider given their focus in other federal legislation, such as the Every Student Succeeds Act (ESSA).
As well as increasing access to high-quality CTE opportunities, Perkins V also stipulates the need to create cross-sector partnerships spanning secondary schools, postsecondary institutions, and industry partners to ensure that labor market needs are met with respect to knowledge and skills gained during CTE experiences. Finally, Perkins V reemphasizes the alignment of CTE pathways with career fields with large current and projected needs.
CTE in Ohio
In addition to the federal initiative, Ohio has taken important steps to modernize CTE. Shortly after Perkins V came into effect during the 2019–20 academic year, Ohio created the Innovative Workforce Incentive Program (IWIP). The goal of this program is to improve career preparation for high school students in targeted labor market sectors identified as high-growth, high-need fields (e.g., information technology, advanced manufacturing, and skilled trades). Under this program, the state provides funds to schools through two distinct mechanisms. The first is an implementation grant to help schools develop IWIP credentialing programs at the secondary level. The second mechanism focuses on reimbursements to schools through incentive payments, under which schools are eligible to receive up to $1,250 for each credential earned by a student if the credential is recognized as a priority by the state. This amount is above and beyond the credential test fee reimbursements schools already receive for other credentials students earn, along with other funding streams used to support CTE. Through these grants to develop new programs and additional reimbursements for priority credentials, IWIP is one example of the state’s commitment to and investment in workforce development.
With this policy background in mind, the purpose of this report is twofold. The primary goal is to provide a general overview of the current state of career-focused education in Ohio. A secondary goal, when available data make it possible, is to identify trends in career-focused education in Ohio. The period of interest for this report spans the academic years 2014–15 through 2022–23. Here, career-focused education is examined through multiple indicators: (1) CTE participants; (2) concentrators; (3) credential earners—non-IWIP and IWIP designated; and (4) WBL participants.
Along with these measures of CTE participation, we look at the data in several ways. First, we look at CTE as a broad umbrella (i.e., did a student complete coursework in any field of CTE in high school). Second, we look at CTE by career cluster, of which there were sixteen over the period covered by this report (U.S. Department of Education, n.d.). Third, we examine participation in unique career pathways, i.e., a sequence of aligned courses within one of the sixteen clusters. At the national level, there were seventy-nine recognized pathways in 2023 (Coalition for Workforce Development through CTE, 2024). Fourth, we look at career-focused education opportunities at different types of schools in the state, thereby allowing for an examination of exactly where these experiences take place. Fifth, the report analyzes data by student group, including several of the Perkins V “special populations.”
Current Study
Ohio provides a valuable case study site to explore changes in CTE participation and delivery at the secondary level given the state’s investment in career-focused education programming and the range of school types that deliver this programming. Prior work has explored changes in CTE participation over time, but most of these studies have focused on the national level and on changes related to the reauthorization of Perkins IV or prior (e.g., Dougherty & Macdonald, 2020; Gottfried et al., 2021; Kreisman & Stange, 2020; Plasman et al., 2020; Theobald et al., 2022). Additionally, these prior reports have typically focused on CTE participation only through the one-course definition or, occasionally, looking at concentration (taking multiple courses in a single field of study). With that in mind, most of these studies do point to increased participation among Perkins-defined special populations over time. However, a number of broad questions remain unanswered:
1. How has CTE participation and concentration changed over time and across different populations of students and fields of study?
2. How has credential earning changed over time to meet the needs of the labor market?
3. What are the characteristics of students in different types of schools that deliver CTE programming and what fields are they pursuing?
4. What does WBL participation look like in Ohio?
This report responds to these research questions through descriptive analyses of trends over time using data from the Ohio Department of Education and Workforce (Ohio DEW). The report is structured around the different measures of CTE participation and delivery as defined above and proceeds as follows. First, we explore changes in characteristics of CTE participants and concentrators. This section also discusses changes in participation by career cluster over the past ten years. The second section focuses on credentials. Here we look broadly at all credential earning as well as earning within IWIP-designated fields. We examine these trends broadly across all students and all credentials, as well as across student groups and unique credentials. Third, we present a description of CTE participation (as measured by CTE participants, concentrators, and credential earners) across types of schools in Ohio. Specifically, we identify whether there are observable differences between traditional high schools, vocational high schools, and career-tech centers. Finally, we examine a snapshot of WBL participation in the state.
The appendixes provide a more detailed discussion of the data used to respond to each of the above questions as well as supplemental findings that may be of interest to some readers but are not the main focus of the report. Additionally, there are three sidebars (here, here, and here) throughout the report that provide clarification around topics that are important but adjacent to the main report and deserve more focus than a footnote. Throughout the report, we refer to the fiscal year. For example, any mention of the year 2016 refers to the 2015–16 academic year.
Measuring the number of CTE participants and concentrators is the most common indicator of overall CTE participation. These numbers are reported at the federal level using very comparable definitions across states. As mentioned above, a majority of research exploring trends in CTE participation uses these measures. Additionally, much of the literature evaluating the impact of CTE participation on a wide variety of student outcomes focuses on one (or both) of these measures as predictors. For example, prior work has linked secondary CTE participation to improvements in high school graduation (e.g., Dougherty, 2018; Gottfried & Plasman, 2018; Kemple & Snipes, 2000), postsecondary enrollment (e.g., Dougherty, 2016; Plasman & Gottfried, 2018), and later success in the labor market (e.g., Brunner et al., 2023; Kemple & Willner, 2008; Plasman, 2019. As such, we begin our analyses with an exploration of changes in the number of CTE participants (i.e., course takers) and concentrators.
Research Question: How has CTE participation and concentration changed over time across different populations of students and fields of study?
The first step in understanding the present state of CTE in Ohio is an exploratory look at how participation in CTE coursework has changed over time. To examine this question, I rely on data from Ohio DEW as provided through the Ohio Longitudinal Data Archive at The Ohio State University. For the purposes of these analyses, I focus on the academic years of 2014–15 through 2022–23.
The data include records for every student who was enrolled in an Ohio public high school during this time period. This dataset includes an indicator identifying a student as a CTE participant, which is defined as any student who took at least one CTE course.[5] Following the analysis of participants, we turn to trends in concentrators, which identifies students who complete at least two courses in a single career pathway. The findings below describe how the numbers of CTE participants and concentrators have changed during the study period and examine data by key populations, including “special populations” as defined in the federal Perkins Act. Analyzing these data by specific student groups allows us to gauge whether pupils of varying backgrounds participate in different CTE programs at different rates.
CTE participants
Finding 1: The total number of CTE participants per year in Ohio has steadily increased over the past decade.
Between academic years ending in 2015 and 2023, there was a nearly 30 percent increase in the total number of Ohio students (in grades 9 through 12) who participated in at least one course during the identified school year. Figure 1 below presents the overall trend during this period. Three years saw particularly sharp increases in overall participation rates. The largest increase was observed between 2016 and 2017, with an increase of more than 20 percent (approximately 21,000 students). There was another large jump in participation from 2019 to 2020, with more than 10,000 additional participants in 2020. The only observed decrease year over year occurred from 2020 to 2021, which likely reflects disruptions related to the COVID-19 pandemic. There is evidence this was indeed the case, as participation numbers bounced back in 2022 to above pre-pandemic levels. In 2023, almost 137,000 students participated in at least one course. To put that into perspective, there were approximately 573,000 high school students in Ohio in that year, indicating that about one in four (24 percent) of them participated in at least one course that year.[6] Comparatively, in 2015, only 98,000 of the 610,000 high school students—just under one in six—participated in CTE (approximately 16 percent).
Figure 1. Total CTE participation over time
Finding 2: There are modest though evident changes in participation among certain student groups from 2015 to 2023.
Figure 2 presents trends related to participation by students from different racial/ethnic backgrounds over the past decade. White students accounted for eight of every ten CTE participants in 2015. By 2023, this proportion was down slightly to about seven and a half. Though not a large change, Black students increased from just under 12 percent of participants in 2015 to nearly 13 percent in 2023. Hispanic students made up only 3 percent of CTE participants in 2015 but accounted for nearly 6 percent in 2023. The participation rates for these two groups indicate a slight underrepresentation when compared to the makeup of Ohio’s entire school-aged population enrolled in public schools. Specifically, Black students made up 17 percent of the total student body and Hispanic students accounted for 7 percent of the student body in 2023.
Figure 2. CTE participation by race/ethnicity
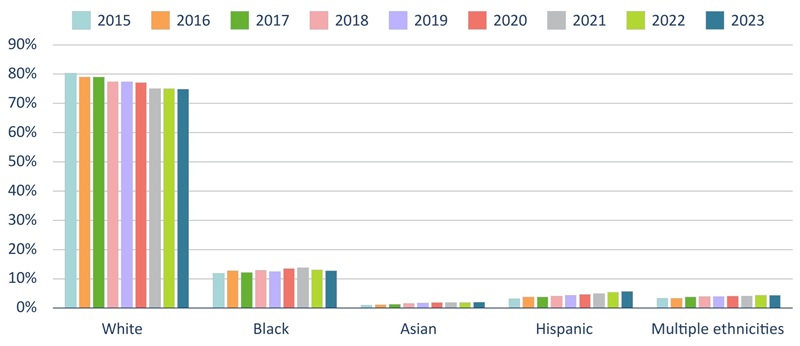
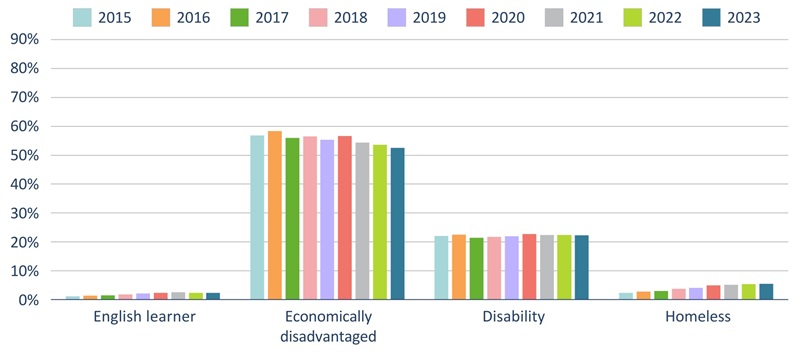
Figure 3 highlights four special populations identified in Perkins V: English Learner students, economically disadvantaged students, students with a disability, and homeless students.[7] The proportion of CTE participants with disabilities has remained relatively constant over time, however, at approximately 22 percent. Students with disabilities are slightly overrepresented as CTE participants, as 17 percent of total public school students statewide were identified as having a disability in the 2022–23 school year. The proportion of CTE participants from economically disadvantaged backgrounds decreased from a high of 58 percent in 2016 to just over 52 percent in 2023. Despite this decrease, the CTE participation rate for economically disadvantaged students remains slightly above the overall population of economically disadvantaged students in Ohio, which was 50 percent in the 2022–23 school year. For each identified population, it is important to recognize that while the proportion of participants may have decreased, the absolute number of participants increased overall, reflecting the broader CTE participation trends.
Figure 3. CTE participation by Perkins-defined special populations
Concentrators
Finding 3: Over time, there has been a sizable increase in the number of students identified as concentrators, from 28,000 in 2015 to more than 44,000 in 2023.
For more than a decade under Perkins IV (2006–2019), states were given leeway to define concentrators using a definition that best fit the local context. Under this context, Ohio defined concentrators as students who completed at least two courses in a single career pathway and were also enrolled in a third. Under Perkins V, which went into effect in the 2019–20 school year, concentration received a national definition as a student who completed at least two courses in a single career pathway. Additionally, CTE courses taken in middle school can now be counted toward concentrator status provided the courses are taught at a high school level. Though a subtle change, the new definition removed the qualification for enrollment in a third course in Ohio, which impacts the numbers presented here.
Under federal reporting guidelines, a student can be counted as a concentrator in multiple years—a student could be counted in the first year they earned concentrator status, potentially before freshman year, as well as subsequent years (again as a sophomore, junior, and senior). In this study, however, we identify only unique concentrators within a beginning ninth-grade cohort such that a student is only counted once as a concentrator.[8] For instance, Figure 4 shows that 28,123 students in the graduating class of 2015—students entering ninth grade in fall 2011—achieved concentrator status.
We observe a relatively steady level of concentration in total numbers from 2015 through 2019. However, following that period, there is a noticeable shift upward, peaking in 2022. Given an average cohort size of approximately 135,000 students, this equates to roughly one in three students in the most recent high school cohorts achieving concentrator status.[9]
Figure 4. Total CTE concentration
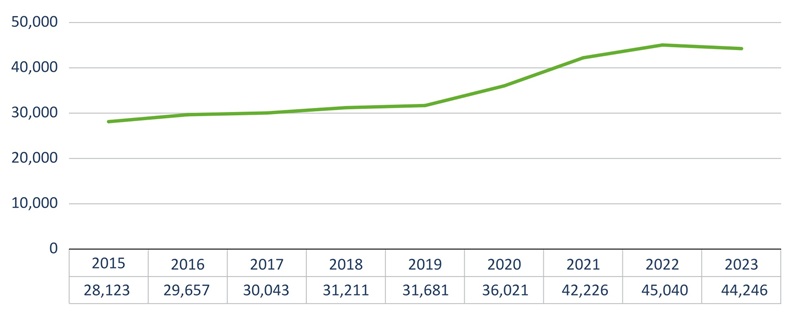
While the trend in concentration is clearly upward, three important points contextualize this finding. First, as noted above, Perkins V created for the first time, starting in 2019–20, a federal definition of a concentrator which uses a slightly more liberal threshold than Ohio had been doing. Second, Ohio altered its graduation requirements multiple times from 2015 to 2023, affording students more additional opportunities to meet state graduation requirements through CTE-based options. (Box 2 provides additional description related to the current iteration of graduation requirements.) Third, as described in the previous section, there was a substantial increase in overall CTE participation from 2015 to 2023, which likely explains some of the overall concentration increase.
Finding 4: Concentration across racial and ethnic minorities and Perkins-defined ‘special populations’ aligns with increases in overall CTE participation.
Concentration by key student populations mirrors quite closely the findings for CTE participants. Table 1 shows the overall breakdown of concentrators from 2015–2023 with an emphasis on the graduating cohort from the identified year. Each of the racial/ethnic groups, including Black students, Asian students, and students identifying as multiple ethnicities, has maintained very consistent concentration rates over time, which are nearly identical to the proportions of CTE participants. Hispanic students do show steady growth in overall makeup of concentrators, which again mirrors CTE participant data. However, as with overall participation, the concentration rates for Black students and Hispanic students were slightly below the overall demographic makeup for those groups in 2022–23. Black students made up 12 percent of concentrators and 17 percent of the full public school population; Hispanic students made up 6 percent of concentrators and 7 percent of the full public school population.
Each of the special population groups shows consistent concentration rates. Unlike CTE participants, however, concentrators identified as economically disadvantaged did not exhibit a notable decrease in proportion over time. Students with disabilities consistently made up a slightly larger proportion of concentrators than CTE participants. The proportion of English Learner concentrators aligns nearly perfectly with English Learner CTE participants. The proportion of homeless concentrators also aligns with homeless CTE participants and shows a steady increasing trend over the past decade.
Table 1: CTE concentration by population
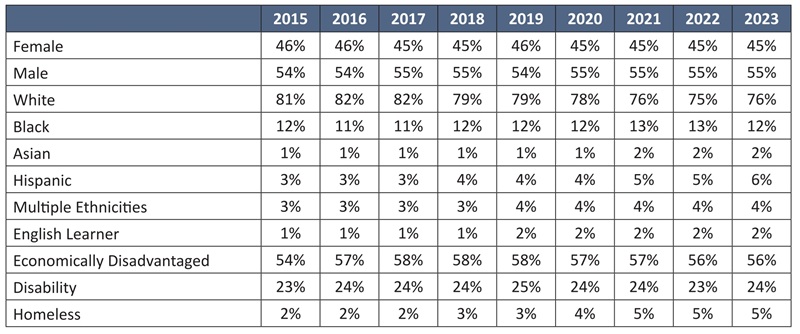
Finding 5: Two career clusters—Agriculture and Environmental Systems and Health Science—have consistently been the two most popular in Ohio over the past decade.
Advance CTE (a national CTE advocacy group) maintains a framework that separates CTE broadly into sixteen career clusters that are recognized by the federal government (U.S. Department of Education, n.d.).[10] Though Ohio recognizes all sixteen clusters, the government and administration cluster had no offered pathways during the period covered by this report. Within each cluster, there are one or more career pathways that focus on the skills needed for specific industries (see Table B1, B2 and Figure B1 in Appendix B for detail). Looking at concentration across these career clusters, Table 2 presents the proportion of Ohio students identified as concentrators within each cluster (sorted on the 2022–23 school year).[11] By 2023, concentration in the top four most popular clusters (Agriculture and Environmental Systems; Health Science; Engineering and Science Tech; and Construction Tech) accounted for more than 50 percent of all concentrators that year.
Table 2: CTE concentration by cluster
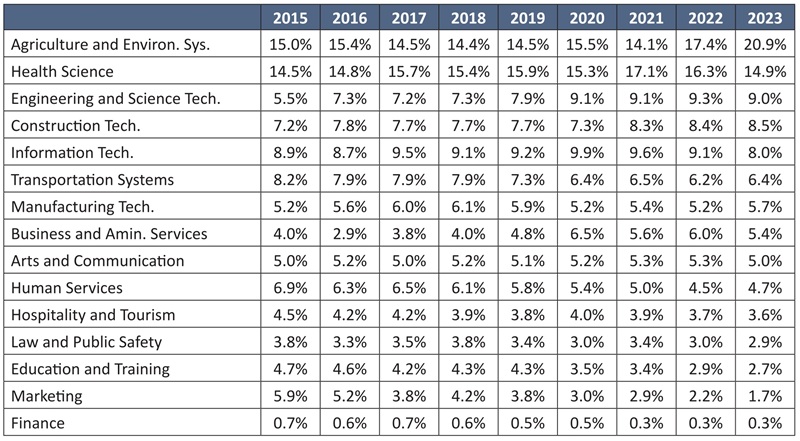
Figure 5 shows trends in concentration in the six clusters that made up at least 6 percent of all concentrators by 2023. Here we see a sharp increase since 2021 in the proportion of concentrators in the Agricultural and Environmental Systems cluster, overtaking Health Science as the most popular career cluster by a healthy margin.
Figure 5. CTE concentration over time, top clusters
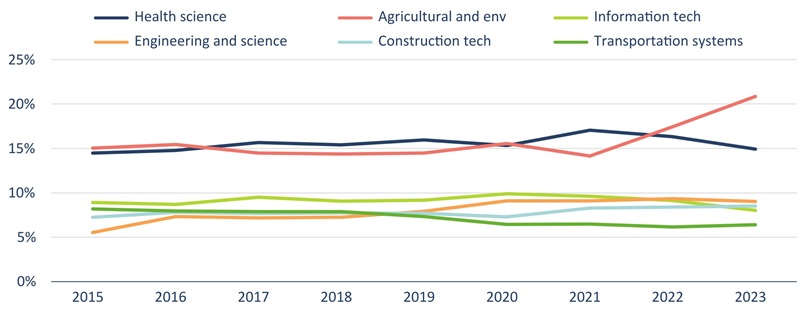
While traditional measures of CTE participation have focused on completing a single CTE course (CTE participants) or completing a series of CTE courses (CTE concentrators), credentials have become extremely popular in recent years and warrant exploration. To date, there is very little research examining the efficacy of credentials. What little work exists shows relatively mixed results with respect to associated outcomes. There is some evidence from Texas that credentials relate to increased short-term earnings and odds of postsecondary enrollment, but the benefits appear to be limited only to a small handful of available credentials (Giani, 2022). Additionally, work out of Florida shows a link between earning a credential and graduating from high school (Glennie et al., 2024). Given these potential benefits, it is worth exploring questions related to who is earning credentials and which credentials they are earning.
Research question: How has industry-recognized credential earning changed over time to meet the needs of the labor market?
Ohio has changed the graduation requirements multiple times during the period of these analyses. Box 2 below provides details regarding the most current requirements. Of note, one of the options to earn a high school diploma revolves around earning credentials. Further, Ohio’s IWIP initiative underscores the state’s growing emphasis on linking career-focused education opportunities more directly to the needs of the local labor market. These statewide policy changes come under the backdrop of the federal Perkins legislation that identifies credential earning as one potential metric for tracking accountability, though Ohio does not use this indicator in its Perkins accountability reporting.[12]
With this policy backdrop in mind, it is helpful to determine how and whether there are observed differences in the number of students earning such credentials, the types of students earning them, and which credentials are earned. Of particular interest in Ohio, it is important to identify whether the IWIP initiative is linked to more students pursuing identified high-priority credentials.[13]
Finding 6: The number of unique credential earners and the total number of credentials earned both showed substantial growth from 2015 to 2022.
In addition to CTE participation and concentration, the Ohio DEW also tracks and reports the number of industry-recognized credentials earned and the field in which they were earned. Here, we identify both the number of individual students who earned at least one such credential (i.e., the number of students across any grade level from ninth to twelfth who earned a credential in a given year) as well as the total number of credentials earned.
Figure 6 below shows the overall increase in both these measures. From 2015 to 2022, the number of unique credential earners nearly tripled from approximately 10,000 to more than 27,000. To put that number into context, about 5 percent of Ohio’s approximately 567,000 high school students earned at least one credential in 2022 compared to less than 2 percent of the 610,000 high school students in 2015—nearly triple the proportion of high school students earning a credential over the course of this eight-year period. However, it does not account for the fact that students can earn multiple credentials during high school. Thus, it is important to look also at the total number of credentials earned. Over this same period, the total number of credentials earned nearly quintupled from 14,500 in 2015 to almost 70,000 in 2022.
Figure 6. Industry-recognized credentials, unique earners and total earned
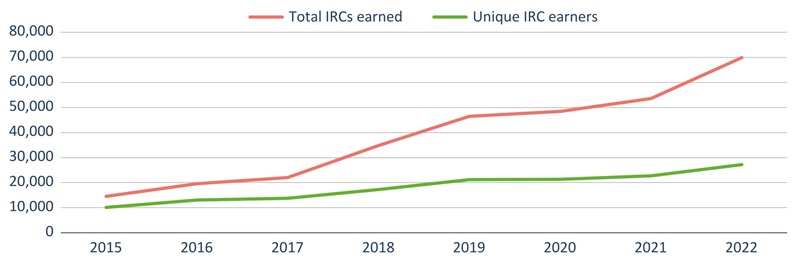
The outsized rate of growth for credentials earned (relative to unique IRC earners) resulted in a higher number of credentials earned per student. In 2015, the average credential earner was awarded approximately 1.44 credentials during high school. By 2022, the average credential earner was awarded approximately 2.57 credentials.
As with measures of concentration discussed previously, the changes in Ohio’s graduation requirements along with expansion of credential offerings likely play a role in explaining these changes. Not only did the new requirements implemented in 2018 allow students to earn a credential to meet one of the graduation pathway options, but policymakers also defined a point system related to credentials. Specifically, to meet the credential graduation requirement, a student needs to earn credentials worth at least twelve points within a single career cluster. Some credentials alone provide this point total, while others may be worth fewer points. As such, students may need to earn multiple credentials to meet this twelve-point threshold, which likely drove the growth in the number of credentials earned as well as the credentials earned per student.[14]
Finding 7: A number of student populations showed substantial increases in their proportion of total credential earners, including Black students, homeless students, and economically disadvantaged students.
Consistent with CTE participation and concentration, the total number of credential earners across all student groups increased over the identified period. However, certain groups showed more substantial growth than others. Figure 7 highlights two groups that started out representing relatively small proportions of credential earners but showed significant increases in that share. The share of Black students earning credentials more than doubled during this time period, while the share of homeless students earning credentials more than quadrupled. Figure 8 highlights two additional groups that made up a substantial proportion of credential earners but exhibited opposite trends. Notably, the proportion of credential earners identified as economically disadvantaged students increased substantially. Female students, meanwhile, have made up a progressively smaller share of all credential earners over this time period.
Figure 7. Changes in IRC by population, Black students and homeless students
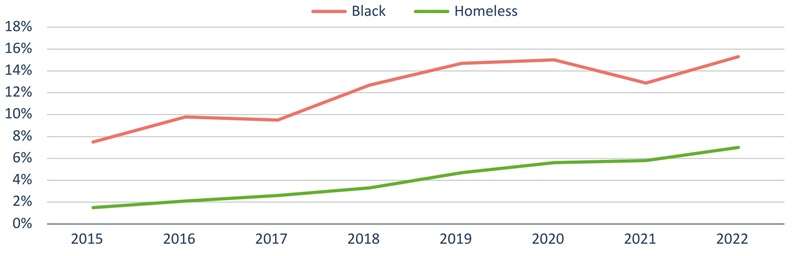
Figure 8. Changes in IRC by population, female and economically disadvantaged students
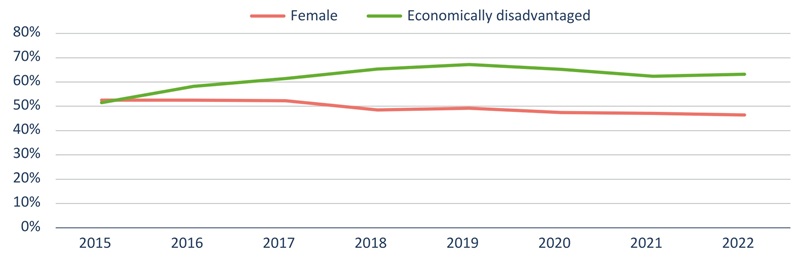
Finding 8: Since the introduction of IWIP incentive payments in the 2019 fiscal year, the proportion of high-priority credentials earned compared to total credentials earned has more than doubled.
Using publicly available reimbursement records from Ohio DEW on IWIP payments, the first analysis here identifies changes in the proportion of IWIP credentials earned compared to total credentials earned.[15] As of 2024-2025, there were 208 unique IWIP credentials across eight different CTE career clusters.[16] With these records, it is possible to identify both the total number of payments distributed to schools for IWIP credentials earned as well as the number of payment reimbursements for each individual IWIP credential.
Figure 9 (left axis) presents the change in proportion of IWIP credentials compared to the total number of credentials earned (which include non-IWIP credentials that can be used for graduation), as illustrated by the darker line. In 2020, only 8 percent of credentials were IWIP (3,031 IWIP compared to 38,315 total credentials earned). By 2023, this proportion more than doubled to nearly 17 percent of credentials (19,175 IWIP compared to 114,211 total credentials). Meanwhile, the right axis provides a visual interpretation of the number of different IWIP credentials earned each year since the program’s inception. As illustrated by the light-gray line, from 2020 to 2023, the total number of unique IWIP credentials-earned nearly tripled from 36 to 105. Both offerings and proportion of IWIP saw particularly sharp increases beginning in 2022, which may be explained by the introduction of the implementation grant (which was not run in the initial years of the program) as well as schools becoming more familiar with the program and having more opportunities to support credential pursuit coming out of COVID. These increases indicate the growing emphasis on ensuring students are participating in state-defined high-priority areas that are intended to be better aligned to workforce needs in Ohio.
Figure 9. IWIP credential changes over time
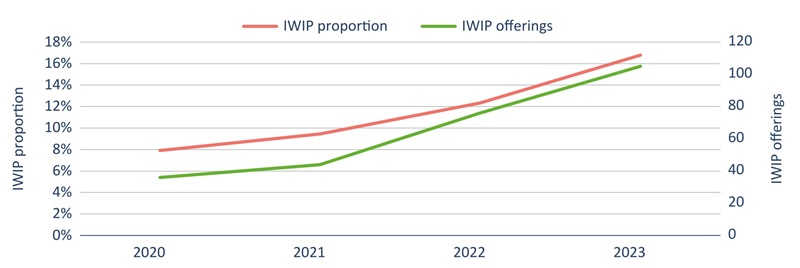
Though the total number of IWIP credentials earned and offered has increased substantially over the past few years, there remains room for improvement. Table 3 presents a snapshot of the ten most popular credentials at key timepoints.[17] There are a few elements worth highlighting here. First, IWIP-designated credentials made up fewer of the top ten credentials in 2022 than they did in 2015 (two in 2022 versus four in 2015). Additionally, they have moved lower on the list with respect to ranking; in fact, none of the top six most popular credentials in 2022 were IWIP-designated. Second, the top ten credentials in 2022 were worth fewer points on average than they were in 2015. In 2015, half of the most popular credentials were worth a full twelve points, while only one credential was worth twelve points in 2022. Some of this is likely explained by the overall increase in credential earning, but it raises questions as to how schools are prioritizing growth in credential offerings.
Table 3: Ten most popular IRCs at selected time points
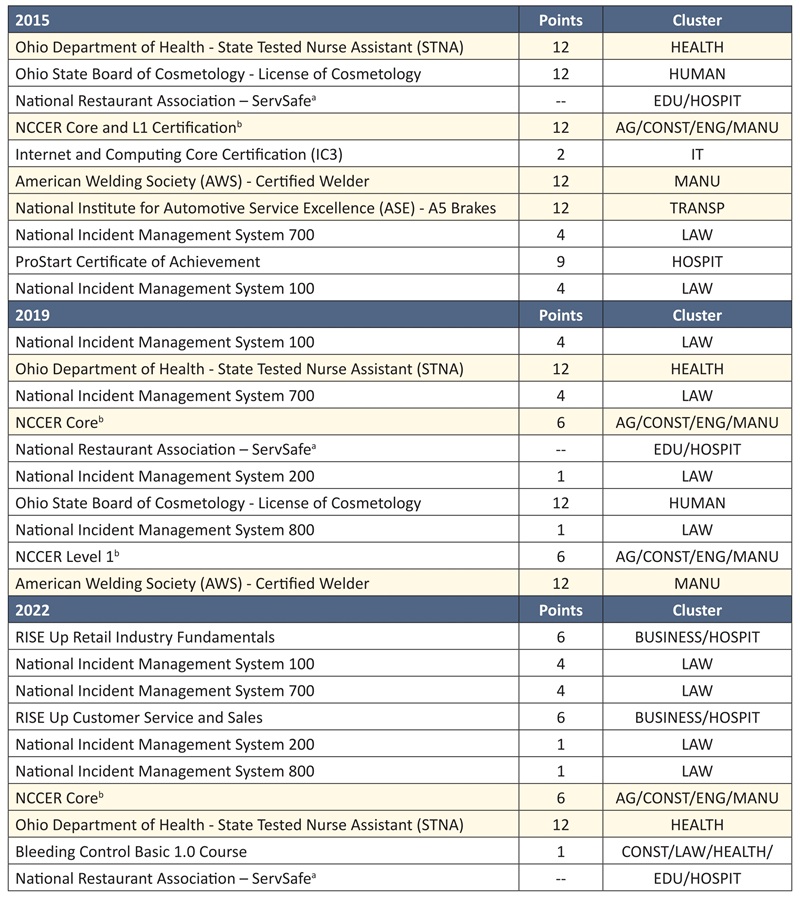
Clearly there has been expansion in CTE participation in Ohio as measured by the number of participants, concentrators, and credentials earned. However, given the variety of CTE providers across the state, it is worth examining how students in various types of schools may experience CTE.[18] Given the focal aspects of career-tech center and vocational schools on providing career-specific programming, any major differences in student characteristics or programs of study are worth noting.
Research question: What are the characteristics of students in different types of schools that deliver CTE programming and what fields are they pursuing?
Ohio provides numerous opportunities for high school students to pursue CTE. Across the state, a vast majority of CTE programming occurs in two types of schools: traditional high schools and joint vocational school districts (JVSDs, which are also often referred to as career centers). More than 90 percent of CTE participants attend one of these two types of schools (see Appendix Table B3). Traditional high schools are situated within public school districts, while JVSDs are standalone career-focused schools and often serve students from multiple surrounding districts. Some school districts also offer CTE programming through dedicated vocational schools, though they serve far fewer students than either JVSDs or traditional high schools. However, these schools are worth discussing since they have similar aims as JVSDs—to provide students with dedicated, career-focused education programming.[19]
Finding 9: There are evident differences in the characteristics of CTE participants at these different schools.
There are three groups for which there are sizeable differences between traditional high schools, vocational schools, and JVSDs: Black students, economically disadvantaged students, and students with disabilities.[20] Table 4 presents these differences along with overall enrollment trends across these schools. Of note, traditional high schools served more CTE participants through 2016, but have since been overtaken by JVSDs, which now serve nearly 13,000 more CTE students across the state than traditional high schools. Another interesting trend in overall enrollment relates to vocational schools, which saw a large jump in student population in the 2019–20 school year (a more than 20 percent increase in enrollment).
Table 4: CTE participation by school type and key student characteristics
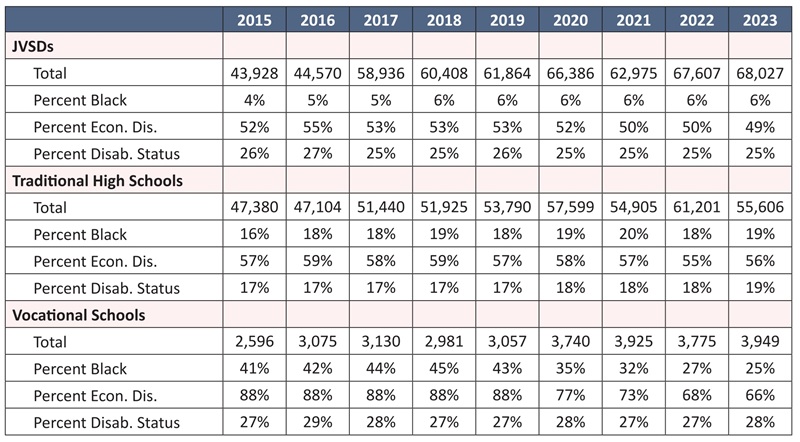
The student population makeup at each of these types of schools is also quite different. Traditional high schools are made up of a substantially larger proportion of Black students, while the JVSD population consists of a larger proportion of students with disabilities. Traditional high schools also serve a higher proportion of students from economically disadvantaged backgrounds, though the differences are less stark than across other characteristics. Vocational schools historically served an oversized proportion of either Black or economically disadvantaged students, but with the overall enrollment increase in enrollment beginning in 2020, these proportions have moved closer to reflecting the makeup of traditional high schools. However, vocational schools still serve relatively large proportions of historically underserved populations.
As mentioned above in footnote 20, these differences are likely due to the broader populations served by different types of schools. JVSDs are often situated outside urban centers, while traditional high schools with large numbers of CTE participants are more likely to be in urban areas.
Finding 10: Career centers were more likely to provide CTE programming in the IWIP priority areas.
IWIP identifies high-priority career fields in which students may earn industry-recognized credentials. Specifically, there were six career clusters into which a vast majority of these IWIP credentials fall, which for the purposes of this study are defined as high-priority fields.[21] Here, the focus is on whether CTE students in career centers versus traditional high schools were more likely to concentrate—a coursetaking metric—and/or earn a credential in a high-priority IWIP field.
Figure 10 presents the results of these analyses for concentrators. Figure 11 presents the results for IWIP credential earners.[22] With respect to concentration (Figure 10), the JVSD career centers have shown a good deal of growth in the proportion of concentrators studying in an IWIP field. In 2023, just over half of concentrators at JVSDs did so in a high-priority career field. At traditional high schools, there was a slight upward trend in IWIP field concentration until 2023, which saw a substantial downturn. In 2023, roughly two in five concentrators at traditional high schools did so in a high-priority career field.
Figure 10. CTE concentrators in IWIP fields by school type
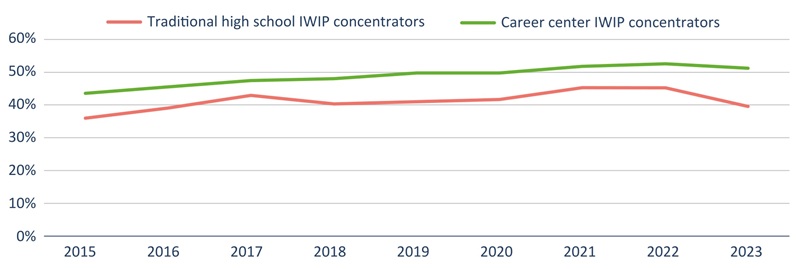
Turning to Figure 11 and credential earning, we see that a greater proportion of credential earners in traditional high schools earned what would have been deemed an IWIP credential in 2015. However, by 2022 (the most recent year with individual student credential data), the proportion of IWIP credentials in career centers greatly increased while the proportion in traditional high schools dipped slightly. These results suggest that students in JVSD career centers are more likely to have access to programming in IWIP high-priority areas.
The observable dip in IWIP credentialing at traditional high schools in 2020 and 2021 is almost certainly due to the COVID-19 pandemic. However, this dip is not evident in JVSDs. This is likely due to multiple factors. On one hand, all JVSD students participate in CTE programming, and as such the focus for these schools is by necessity on finding ways for students to complete CTE requirements. Traditional high schools, meanwhile, are likely to have many competing priorities for students, considering many do not pursue CTE programs of study. Further, JVSD career centers may be able to adapt more nimbly when it comes to introducing new programming options as they are likely to have more CTE-designated resources available. This is not a surprising finding given the differing foci of traditional high schools and career centers, but it is worth mentioning given the differences in student populations served at each type of school. One point that may be hidden in looking at proportions is that the lower percentage in traditional high schools is a combination of two factors. First, fewer students in traditional high schools earned IRCs in general compared to students in JVSDs. Additionally, a smaller number of these were identified as IWIP eligible. Ultimately, this suggests that less-advantaged students may have less access to CTE programming in high-priority career fields and may also be pushed into non-IWIP fields.
Figure 11. IRC earners in IWIP fields by school type
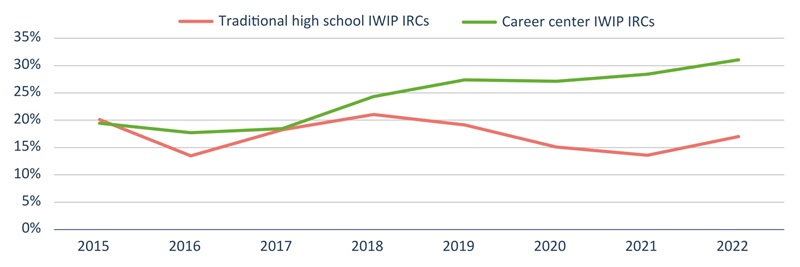
Table 5 presents a detailed breakdown of the proportion of populations that earned an IWIP credential as well as the proportion of all IWIP earners that group represented in 2022. To illustrate using Black students in JVSDs as an exemplar, Column 1 shows that the total enrollment of Black students in 2022 was 4,116 and 269 earned an IWIP credential. Column 2 shows this represents 7 percent of Black students earned an IWIP credential. Column 3 shows that of all IWIP earners (there were 5,266 in JVSDs), 5 percent were Black.
Comparing JVSDs and traditional schools, the most notable point is the difference in the total number of students earning IWIP credentials. This difference in total numbers is further backed by the proportion of the student body that earned an IWIP. At traditional high schools, less than 2 percent of all CTE participants earned an IWIP credential, while at JVSDs, 8 percent of all students earned an IWIP credential. Both these percentages are small, but the differences are noteworthy. An additional point worth mentioning is that only 1 percent of students with disabilities pursuing CTE in traditional high schools ultimately earned an IWIP credential, compared to 7 percent in JVSDs. However, economically disadvantaged students and Black students comprised a larger proportion of IWIP earners in traditional high schools than they did in JVSDs. Given differences in the goals of traditional high schools and JVSDs, IWIP earning in vocational schools is also shown here.
Table 5. IWIP credentials by student group
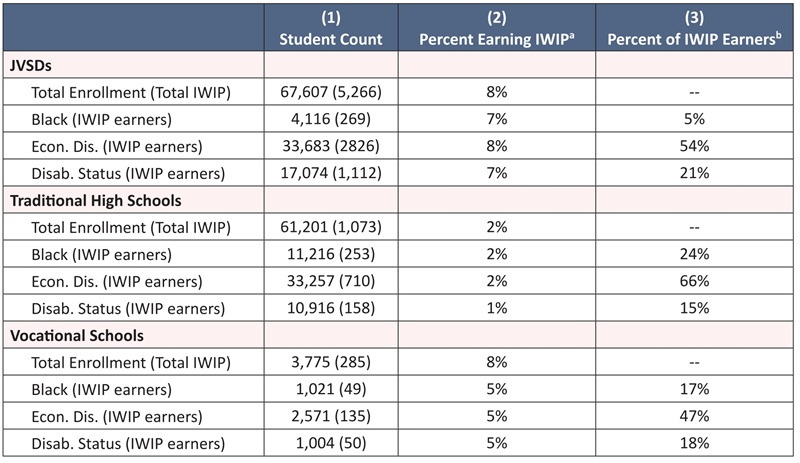
One of the goals of CTE, whether delivered at a traditional high school, a vocational school, or in a career-tech center, is to prepare students to succeed in the workforce. An important aspect of this success is having the opportunity to experience a true workplace setting. Work-based learning (WBL) is designed to provide this opportunity. As such, WBL is another important measure of career-focused education that is not equivalent to coursework or earning credentials, but it is certainly related. As with these other measures of CTE participation, there is evidence that WBL is related to benefits such as high school completion (e.g., Hemelt et al., 2019, Sun & Spinney, 2017), postsecondary enrollment (e.g., Buzzeo & Cifci, 2017), and later labor market earnings (e.g., Plasman & Thompson, 2023).
Research question: What does WBL participation look like in Ohio?
When the Perkins legislation was reauthorized in 2018, the federal government indicated an emphasis on including WBL opportunities as a core component of high-quality career pathway programs. Prior to this time, though WBL was taking place in Ohio, these opportunities were not reported in a standardized manner, and it is only since 2022 that WBL reporting has become fully institutionalized. As such, any information on WBL participation prior to the 2021–22 school year contributes little to the understanding of trends in this area.
With this in mind, all analyses associated with WBL focus on the two cohorts of students from 2022 and 2023. Like concentrator status, we look at WBL participation over the full high school experience. As such, the 2022 analyses identify WBL participation for the incoming ninth grade cohort of 2018–19 while the 2023 analyses highlight students from the 2019–20 ninth grade cohort. To add further clarity to the overall discussion of WBL, one must understand that, beginning with the graduating class of 2023, WBL participation became an option under the career experience and technical skill competency portion of the state graduation requirement. To meet this measure, a student would need to complete an experience providing at least 250 hours of programming cumulatively throughout high school.
This section explores the current state of WBL in Ohio.[23] Unlike CTE participants and concentrators or credential earners, we are unable to explore changes over time. As such, this section should be viewed as a current snapshot of WBL in Ohio.
Finding 11: More than 26,000 students from the 2019 freshman cohort earned hours for participating in WBL.
Among students from the 2023 cohort, more than 26,000 students (about 19 percent of the cohort) earned some number of WBL hours. Of this group, approximately 21,040 were also identified as concentrators, which represents just under half of all concentrators (44,246 in 2023). This is up from about 17,000 students (just over 12 percent of the cohort) from the 2022 cohort (14,500 were also concentrators, representing less than one-third of the 45,040 total concentrators that year). See appendix Table B5 for a breakdown of WBL participation by student groups.
Turning to participation in WBL by cumulative hours earned, Figure 12 shows the breakdown across these different options. The cumulative hours earned for each student was reported by each school in the final reporting period. Of the 26,279 students who earned WBL hours from the 2023 graduating cohort, less than half (12,567) achieved the 250-hour threshold, though this is still approximately 50 percent higher than the number of students meeting this threshold in 2022. A final point focuses on the prevalence of students finishing high school with fewer than forty hours of WBL. In the 2023 cohort, more than 6,000 students earned fewer than forty hours of cumulative WBL—more than double the number of students who finished high school at this level in 2022.
Figure 12. WBL participation by hours earned, classes of 2022 and 2023
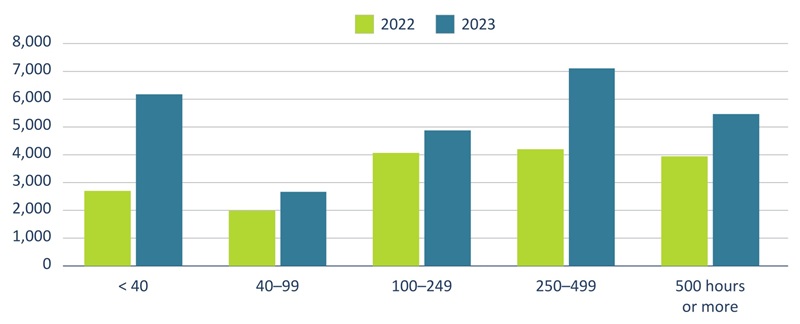
In the spring of 2023, Ohio Governor Mike DeWine pledged to invest approximately $300 million in additional funds to ensure CTE in the state is meeting the high demands of industry (Poiner, 2024). This amount comes on top of the more than $52 million in federal funds through Perkins V as well as $16 million in reimbursements for credentials ($10.5 million through IWIP and $5.5 million for non-IWIP credentials) and the existing CTE operating budget (Perkins Collaborative Resource Network, 2023). These massive investments highlight the seriousness with which Ohio is working to become a true workforce development hub for the twenty-first century. However, given the size of these investments, this report brings up important considerations that should be addressed as policymakers and taxpayers look for accountability, an assurance of a strong return on investment, and provision of high-quality career-focused education for Ohio’s youth.
First, through this report, we have made clear that there are many ways to measure CTE participation and define what it means to be a CTE student. The federal accountability guidelines require that states report the number of CTE participants (students who complete at least one course in a CTE program of study) and concentrators (students who complete at least two courses in a single CTE program of study). These definitions ensure standardized reporting at the federal level but are much less meaningful for the state of Ohio. With the introduction of a federal concentrator definition under Perkins V, many of the state-level performance indicators with respect to CTE drastically changed. Importantly, this new concentrator definition likely does not identify the same level of investment by a student in a specific CTE career pathway as under the prior definition (i.e., the prior definition included the stipulation that a student be enrolled in a third course). As such, some concentrators (those identified under the new Perkins V definition) may not have the desire to participate in WBL or excel in technical assessments (key career-focused indicators within the state of Ohio) if they are not truly interested in pursuing a CTE career pathway.[24] In this report, we provide evidence of this potential disconnect between concentration and a student’s interest in pursuing CTE given the prevalence of students who do not meet the 250-hour WBL requirement.
Second, the push to increase access to credentials and to align credentials to high-quality, high-demand fields is certainly a commendable objective. In this report, we present solid evidence that these efforts are having an impact, as evidenced by the increase in the numbers of credentials students earned in recent years. The IWIP initiative is a great step forward in working to better align the needs of the state with credentialing opportunities available to students. However, these opportunities do not appear to be equally available to or pursued by students, depending on where they receive their CTE programming. Students from urban areas who are more likely to be Black or Hispanic and low-income—appear to have less access to IWIP programs at their local high school. Future iterations of IWIP should consider additional data from local and regional labor market projections to identify areas of focus. Relatedly, little is known about the efficacy of these credentials and whether the investment in credentials through various reimbursement mechanisms is seeing a strong return on investment. Outside Ohio, numerous states, including Texas and Florida, have examined the prevalence of credentials and what the potential effects of earning these credentials may be (Giani, 2022; Glenn et al., 2020; Glennie et al., 2024). The evidence has been mixed, and to date there is no definitive evidence of links between credentials earned in high school and later labor market effects.
Third, it is clear that traditional high schools and JVSD career centers serve students from districts that have very different demographic makeups. However, the flexibility of career centers to update and upgrade programs and program offerings raises issues about access to high-quality CTE for some student groups. We see this particularly with respect to the growth in concentration and credential earning in high-priority areas as identified by IWIP. Specifically, career centers have seen substantially more growth in the numbers of concentrators in IWIP fields and IWIP credential earners than traditional schools. Given the differences in populations served (traditional schools are more likely to serve Black students, economically disadvantaged students, and homeless students), it will become increasingly important for policymakers to ensure equitable access to these opportunities for all students. The evidence presented in this report—that CTE students in traditional high schools are less likely to concentrate in a target field and less likely to earn an IWIP credential—suggests that something may need to change. In the 2023–24 school year, a NAF academy (a career-focused academy, often within an existing high school) was approved in the Columbus City School District.[25] Such academies are aimed at providing high-quality career pathways in high-demand fields through strong partnerships between secondary, postsecondary, and business institutions in conjunction with rigorous curricula integrated with career learning opportunities. Traditional high schools may look to embrace similar strategies to provide students with additional opportunities to pursue career-focused education.
Ultimately, there is good reason for optimism about Ohio’s commitment to workforce development through CTE opportunities in high school. Given the speed of advancements in technology and the labor market in general, it is imperative this level of commitment to and enthusiasm for CTE at the state level remains high. While the federal government requires reporting of concentrators using the federal definition, Ohio policymakers need to consider whether this definition of concentration is meaningful for the state. In practice, a more comprehensive approach to reporting in this area would focus on students completing a CTE pathway. A measure that includes an indicator of completing a rigorous CTE course sequence in conjunction with completing 250 hours of WBL and earning high-quality credentials could provide a more meaningful look at the true benefits of participating in a comprehensive CTE program of study and preparation for rewarding postsecondary and employment. In order to stay competitive and ensure students are receiving the best educational opportunities, Ohio needs to continue working to build strong career pathways for students—and track exactly how many students complete them.
Fordham Acknowledgments
Many individuals contributed their time and expertise to this project. First, I wish to thank Dr. Jay Plasman for digging into the data and authoring a fine report. Special thanks also to Eben Dowell and Kelsey Stephens of the Ohio Department of Education and Workforce who provided technical assistance and reviewed an early draft. On the Fordham team, Michael J. Petrilli, Chester E. Finn, Jr., and Chad L. Aldis offered thoughtful feedback during the drafting process, and Jeff Murray provided report production support. Lastly, I thank Kathi Kizirnis for copyediting the document, and Dave Williams for laying out the report.
About the author
Jay Plasman is the Director of Research of the Dennis Learning Center in the College of Education and Human Ecology and an associate professor in the Workforce Development and Education in the Department of Educational Studies at The Ohio State University. Prior to joining The Ohio State University, he was a postdoctoral fellow in the Institute of Education Policy at Johns Hopkins University. His research focuses broadly on education policy and explores the pipeline of career and technical education between high school and college along with the role this type of education has on high school dropout rates and college considerations. He formerly worked as a teacher at the elementary, middle and high school levels. Dr. Plasman also served as the Director of Education at a vocational training school for several years prior to earning his doctorate from the University of California Santa Barbara.
Brunner, E. J., Dougherty, S. M., & Ross, S. L. (2023). The effects of career and technical education: Evidence from the Connecticut technical high school system. Review of Economics and Statistics, 105(4), 867–882.
Buzzeo, J., & Cifci, M. (2017). Work experience, job shadowing and workplace visits. The Careers and Enterprise Company.
Coalition for Workforce Development through CTE. (2024). National career clusters framework. Retrieved from https://cte2workforce.org/about/acte-clusters/.
Dougherty, S. M. (2016). Career and Technical Education in High School: Does It Improve Student Outcomes? Thomas B. Fordham Institute.
Dougherty, S. M. (2018). The effect of career and technical education on human capital accumulation: Causal evidence from Massachusetts. Education Finance and Policy, 13(2), 119–148.
Dougherty, S. M., & Harbaugh Macdonald, I. (2020). Can growth in the availability of STEM technical education improve equality in participation? Evidence from Massachusetts. Journal of Vocational Education & Training, 72(1), 47–70.
Giani, M. (2022). How attaining industry-recognized credentials in high school shapes education and employment outcomes. Thomas B. Fordham Institute.
Glennie, E., Dalton, B., Studley, R., & Lauff, E. (2024). The influence of earning industry certifications on high school graduation: Evidence from Florida. Educational Policy. Online first: https://doi.org/10.1177/08959048241292625.
Glennie, E., Ottem, R., & Lauff, E. (2020). The influence of earning and industry certification in high school on going to college: The Florida CAPE Act. Journal of Career and Technical Education, 35(1), 17–35.
Gottfried, M. A., & Plasman, J. S. (2018). Linking the timing of career and technical education coursetaking with high school dropout and college-going behavior. American Educational Research Journal, 55(2), 325–361.
Gottfried, M., Plasman, J. S., Freeman, J. A., & Dougherty, S. (2021). Who’s Taking What? “Applied STEM” Coursetaking Patterns for High School Students with Learning Disabilities. AERA Open, 7.
Hemelt, S. W., Lenard, M. A., & Paeplow, C. G. (2019). Building bridges to life after high school: Contemporary career academies and student outcomes. Economics of Education Review, 68, 161–178.
Kemple, J. J., & Snipes, J. C. (2000). Career Academies: Impacts on Students’ Engagement and Performance in High School. MDRC.
Kemple, J. J., & Willner, C. J. (2008). Career Academies: Long-Term Impacts on Labor Market Outcomes. MDRC.
Kreisman, D., & Stange, K. (2020). Vocational and career tech education in American high schools: The value of depth over breadth. Education Finance and Policy, 15(1), 11–44.
OCTAE. (2018). Carl D. Perkins Career and Technical Education Act of 2006: Report to Congress on state performance program year 2014–2015. U.S. Department of Education; Office of Career, Technical, and Adult Education; Division of Academic and Technical Education.
Ohio Department of Education. (2020). Ohio work-based learning pathway options. Retrieved from https://education.ohio.gov/getattachment/Topics/Career-Tech/Career-Connections/Work-Based-Learning/Ohio-Work-Based-Learning.pdf.aspx?lang=en-US.
Ohio Department of Education and Workforce. (2023). Enrollment by student demographics (state)—Overview. Retrieved from https://reports.education.ohio.gov/report/report-card-data-state-enrollment-by-student-demographic.
Ohio Department of Education and Workforce. (2024). Industry-recognized credentials FAQs. Retrieved from https://education.ohio.gov/Topics/Ohio-s-Graduation-Requirements/Contacts-and-Resources/Industry-Recognized-Credentials/Industry-Recognized-Credentials-FAQs.
Ohio Department of Education and Workforce. (2025). Data and accountability guidebook. Retrieved from https://education.ohio.gov/getattachment/Topics/Career-Tech/CTE-Data-and-Accountability/Data-and-Accountability-Guidebook-2024_Feb-25-Target-update.pdf.aspx?lang=en-US.
Perkins Data Explorer. (n.d.). CTE participant enrollment. U.S. Department of Education.
Perkins Collaborative Resource Network. (2023). Ohio state profile. U.S. Department of Education.
Plasman, J. (2019). Linking Occupational Concentration to Hourly Wages for Non-College Going Individuals. Journal of Career and Technical Education, 34(1), 29–51.
Plasman, J. S., & Gottfried, M. A. (2018). Applied STEM coursework, high school dropout rates, and students with learning disabilities. Educational Policy, 32(5), 664–696.
Plasman, J. S., Gottfried, M., & Hutt, E. (2020). Then and Now: Depicting a Changing National Profile of STEM Career and Technical Education Coursetakers. Teachers College Record, 122(2), 1–28.
Plasman, J. S. & Thompson, C. (2023). The Value of Informal Learning within Work-Based Learning: The Economic Benefits of WBL. International Journal of Training and Development, 27(3-4), 305–326.
Poiner, J. (2024). Ohio is investing hundreds of millions to strengthen and expand access to CTE. Thomas B. Fordham Institute.
Poiner, J. (2024). Ohio must measure the value of industry-recognized credentials. Thomas B. Fordham Institute.
Sun, J., & Spinney, S. (2017). Transforming the American High School Experience: NAF’s Cohort Graduation Rates from 2011–2015. ICF International
Theobald, R., Plasman, J. S., Gottfried, M., Gratz, T., Holden, K., & Goldhaber, D. (2022). Sometimes Less, Sometimes More: Trends in Career and Technical Education Participation for Students with Disabilities. Educational Researcher, 51(1), 40–50.
U.S. Department of Education. (n.d.). Career clusters and programs of study. Retrieved from https://www.ed.gov/media/document/career-clstrs-prgrms-study-fs080528qa-kcdoc-37498.doc
[1] This report does not contain a rigorous evaluation of CTE programs. However, a forthcoming study by Dr. Plasman will tackle questions about impacts on students, including their early-career workforce outcomes.
[3] A selective career field is one with a credential that is eligible for IWIP.
[4] Collectively, Perkins V refers to these groups as “special populations.” Under this legislation, students in nontraditional fields refers to students enrolled in a CTE program in which the opposite gender makes up more than 75 percent of the workforce in that field. In addition to these five identified groups, “special populations” also include single parents, out-of-workforce individuals, foster care students, and youth with a parent in the military.
[5] There are slight differences for a CTE participant between Perkins IV and Perkins V. Under Perkins IV, a CTE participant is defined as a student who earned a credit in a CTE course. Under Perkins V, a participant is a student enrolled for at least 90 percent of a CTE course.
[6] Enrollment is calculated as the total number of students enrolled in from the October headcount data provided by the Ohio Department of Education and Workforce.
[7] While homeless individuals were one of the groups added to the Perkins V “special populations” definition, they have been included as a unique group since at least 2015, allowing for a view of changes in participation.
[8] See technical appendix for additional discussion of definitional and coding decisions.
[9] Students are more likely to participate in CTE coursework as juniors or seniors in high school, which explains why the proportion of concentrators (one of three in a given cohort) appears to be larger than the proportion of CTE participants (one of four across the high school enrolled population).
[10] This framework was updated in 2024 to reflect the cross-disciplinary nature of some of the clusters and develop a new cluster. See Table 2 for identification of Ohio Career Clusters.
[11] In this calculation, a student could be counted more than once if they concentrated in more than one field.
[12] Though Ohio does not report on this measure at the federal level, credentials are included on state report cards. Both Perkins IV in 2006 and Perkins V in 2018 include industry-recognized credential earning as one potential accountability metric. Perkins refers to a broader “recognized postsecondary credential” indicator that includes other sub-baccalaureate credentials as well.
[13] Note that the numbers reported by the Ohio Longitudinal Data Archive (OLDA—see Technical Appendix A) and those reported in the Ohio Department of Education and Workforce reimbursement report may differ since the year in which IWIP reimbursements were distributed does not always align with the year in which the credentials were earned. OLDA data only included credential information through the 2021–22 school year.
[14] The Ohio DEW maintains a database of all potential credentials with their associated point values and associated career clusters. Table 3 presents the point values for selected credentials.
[15] Excel files containing IWIP incentive payment information is available at this link (note the FY indicator).
[16] Two clusters—Education and Training, and Transportation—had only one identified high-priority credential each. Construction Technologies included 48 credentials; Engineering and Science Technologies included 65; Health Science included 43; Information Technology included 47; Law and Public Safety included 8; and Manufacturing Technologies included 87 (some credentials were associated with multiple clusters). See this link for a full list of IWIP-identified credentials.
[17] 2015 represents the first year of available data; 2019 represents the year before IWIP took effect; and 2022 is the most recent year.
[18] See the Thomas B. Fordham Institute report on Ohio’s Career-Technical Education Landscape for additional description of these options.
[19] CTE programming is also delivered in charter schools (referred to as community schools in Ohio), correctional institutions, and through compact districts. See this link for more information.
[20] It is worth noting that CTE participants in traditional high schools and CTE participants in JVSDs are being pulled from populations that are likely very different (see appendix Figure B2). While this likely explains much of the observed difference here, it is worth noting given the potential differences in resources for CTE at these two types of schools. As per the Ohio DEW, the statewide average base cost per CTE student in 2023 was $8,891, while it was $7,352 for non-CTE students. CTE students are funded at this higher amount regardless of school type, but a larger proportion of students at JVSDs are CTE students. See appendix Table B4 for additional funding differences.
[21] Construction Technology; Engineering and Science Technology; Health Science; Information Technology; Law and Public Safety; and Manufacturing
[22] Though IWIP was introduced in 2019, it is possible to look back from that point to see whether students were previously participating in those fields.
[23] There are multiple indicators related to work-based learning experiences as identified through participation in a career-technical program, including: internship completion, apprenticeship acceptance, apprenticeship completion, work experience and career exploration, Jobs for Ohio’s Graduates (JOG), Tech Prep, and hours of WBL completed. For the purposes of this report, we focus on the total hours completed during high school.