Mobile Navigation

  • National
    • Policy
      • High Expectations
      • Quality Choices
      • Personalized Pathways
    • Research
    • Commentary
      • Gadfly Newsletter
      • Flypaper Blog
    • Events
    • Scholars Program
  • Ohio
    • Policy
      • Priorities
      • Media & Testimony
    • Research
    • Commentary
      • Ohio Education Gadfly Biweekly
      • Ohio Gadfly Daily
  • Charter Authorizing
    • Application
    • Sponsored Schools
    • Resources
  • About
    • Mission
    • Board
    • Staff
    • Career
Home
Home
Advancing Educational Excellence

Main Navigation

  • National
  • Ohio
  • Charter Authorizing
  • About

Ohio Menu

  • Topics
    • Accountability & Testing
    • Advanced Education
    • Career & Technical Education
    • Charter Schools
    • Curriculum & Instruction
    • ESSA
    • Evidence-Based Learning
    • Governance
    • Personalized Learning
    • Private School Choice
    • School Finance
    • Standards
    • Teachers & School Leaders
  • Research
  • Policy
  • Commentary
    • Ohio Gadfly Newsletter
    • Ohio Gadfly Blog
    • Events

The Education Gadfly Weekly

Sign Up to Receive Fordham Updates

We'll send you quality research, commentary, analysis, and news on the education issues you care about.
Thank you for signing up!
Please check your email to confirm the subscription.

Ohio Gadfly—Here’s where lawmakers should land on school funding and other education issues in the state budget

Volume 19, Number 13
6.20.2025
6.20.2025

Ohio Gadfly—Here’s where lawmakers should land on school funding and other education issues in the state budget

Volume 19, Number 13
view
6 ed issues for conference committee blog image
School Funding

Here’s where lawmakers should land on school funding and other education issues in Ohio’s state budget

As usual, Ohio’s biennial state budget process has been an education policy rollercoaster. It began in February with Governor DeWine unveiling his proposals, which largely built on prior initiatives (e.g., science of reading, high-quality choices, and career pathways).

Aaron Churchill 6.20.2025
OhioOhio Gadfly Daily

Here’s where lawmakers should land on school funding and other education issues in Ohio’s state budget

Aaron Churchill
6.20.2025
Ohio Gadfly Daily

Ohio lawmakers should preserve career awareness and exploration funds

Jessica Poiner
6.17.2025
Ohio Gadfly Daily

Senate budget takes a crack at untangling Ohio’s byzantine property-tax system

Aaron Churchill
6.12.2025
Ohio Gadfly Daily

The Senate budget would solve Ohio’s teacher data problem

Jessica Poiner
6.13.2025
Ohio Gadfly Daily

Examining school and community factors to support students experiencing homelessness

Jeff Murray
6.24.2025
Ohio Gadfly Daily

Historical trends of the college wage premium

Jeff Murray
6.19.2025
Flypaper
view
career awareness dollars blog image

Ohio lawmakers should preserve career awareness and exploration funds

Jessica Poiner 6.17.2025
Ohio Gadfly Daily
view
Senate property taxes blog image

Senate budget takes a crack at untangling Ohio’s byzantine property-tax system

Aaron Churchill 6.12.2025
Ohio Gadfly Daily
view
Senate teacher shortage data blog image

The Senate budget would solve Ohio’s teacher data problem

Jessica Poiner 6.13.2025
Ohio Gadfly Daily
view
Supporting homeless students SR image

Examining school and community factors to support students experiencing homelessness

Jeff Murray 6.24.2025
Ohio Gadfly Daily
view
Graduation cap and money

Historical trends of the college wage premium

Jeff Murray 6.19.2025
Flypaper
view
6 ed issues for conference committee blog image

Here’s where lawmakers should land on school funding and other education issues in Ohio’s state budget

Aaron Churchill
6.20.2025
Ohio Gadfly Daily

As usual, Ohio’s biennial state budget process has been an education policy rollercoaster. It began in February with Governor DeWine unveiling his proposals, which largely built on prior initiatives (e.g., science of reading, high-quality choices, and career pathways). The budget then moved into the legislature where numerous modifications—some positive, others less so—have been made. The conference committee is now hammering out the final bill, which is expected to pass at the end of June.

Recent Fordham pieces covered how lawmakers should settle issues in charter school policy, teacher data, property taxes, career exploration, and performance funding. This post examines several other issues still in play and weighs in on where lawmakers should land in the final budget.

School funding: General framework

One of the biggest questions going into this budget was the future of the school funding formula, the mechanism that allocates state aid to districts and charter schools. Would lawmakers stick with the politically popular but expensive Cupp-Patterson plan? Would they make modifications to it, or go an entirely different direction? The governor, House, and Senate all made clear their discomfort with the formula’s escalating costs by resisting pressure from school groups to “update the inputs,” a move that carries a hefty price tag. But apart from that, the Governor and Senate kept the general formula framework intact and proposed its full phase-in. The House, however, made a strong break from Cupp-Patterson by introducing a “bridge” plan that installs a massive guarantee to ensure no district receives less state aid than it currently does, regardless of enrollment declines or other factors. While the House’s frustration with Cupp-Patterson is understandable, its alternative is worse, as it moves from a formula-driven system to one almost exclusively based on a guarantee.

Recommendation: Following the Governor and Senate, fully phase-in Cupp-Patterson but constrain its costs by holding constant the base-cost inputs, or incrementally increasing them at a rate determined by the legislature.

School funding: Guarantees

Despite past efforts by state leaders to root out guarantees, they remain entrenched in Ohio’s school funding system. In his budget proposal, Governor DeWine kick-started another attempt by scaling back guarantees in the Cupp-Patterson plan. This was a promising start, but, as noted above, the House went backwards on this issue. It put in place a system-wide guarantee for the next two years, which is bad enough, but its proposal also sets up Ohio for more problems over the long-term. The House “moves up” the historical funding level that a district’s current funding cannot fall below under a guarantee. Instead of FY20 and FY21 being the baselines (as currently), the House updates it to FY25—a goalpost change that will make it harder to sunset guarantees down the road. Think of it this way: If the baseline were 1980 funding levels, no district would be on the guarantee. While that hypothetical guarantee might technically be on the books, it would be irrelevant due to steady funding increases over time. As for the Senate, it removed a smallish guarantee known as supplemental targeted assistance (so did the House), but did not follow the governor’s proposal to ratchet back the system’s main guarantees based on the FY20 and FY21 funding baselines.

Recommendation: Following the governor, reduce the guarantee “bases” to 95 and 90 percent of districts’ FY20 and FY21 state funding levels; following the Senate, repeal supplemental targeted assistance. Reject the House’s proposed “update” to the guarantee benchmark.

School funding: Disadvantaged pupil impact aid (DPIA)

A simmering problem in Ohio’s school funding system is its misallocation of aid intended for low-income students. As discussed in prior pieces, the issue hinges on faulty data about the number of “economically disadvantaged” students—the enrollment basis for a funding element known as DPIA. Due to inflated headcounts (tied to expanding subsidized meals eligibility), the state now sends fewer DPIA dollars to schools that are high-poverty and more to mixed-income schools. That undermines the intent of the element and dilutes the funding available to serve students who most need the extra resources. In its budget plan, the Senate proposed to gradually phase-out the inaccurate meals-based disadvantaged rates, and phase-in more accurate numbers that identify low-income pupils via direct certification (i.e., through other means-tested programs such as SNAP or Medicaid). If enacted, the Senate’s move would begin to more effectively steer DPIA dollars to the state’s neediest schools.

Recommendation: Following the Senate, move toward direct-certification-based enrollments to allocate DPIA. Lawmakers should consider further speeding the transition to direct certification so that direct-certified numbers are the full basis for DPIA by FY27. In addition, it’s critical that they increase the base per-student DPIA amount (currently $422). This would compensate for the lower but more accurate direct-certified rates and ensure that high-poverty schools receive sufficient supplemental funds to effectively educate low-income students. If the base is not boosted, the amount going to support low-income students in Ohio will be significantly reduced.

Private school choice

While the past couple of budget seasons have produced landmark wins for private school choice, the current cycle has been quieter on this front. So far, the most notable advancement is a modest bump in the state’s special-needs scholarship amounts. The EdChoice and Cleveland scholarships, however, remain flat-funded, even as proposed funding for public schools ticks slightly upward. Meanwhile, the House put forward a questionable ESA program for students attending lightly regulated (and non-scholarship eligible) non-chartered private schools. The Senate wisely scratched this idea. Overall, there is still room to advance private school choice in responsible ways despite limited action thus far. One sensible idea, already put forward in standalone Senate legislation (SB191), would provide private schools with additional funding—effectively a “weighted” scholarship—when they enroll low-income students. The enhanced amount would recognize the greater needs of low-income students—as is done for public schools via DPIA—and give private schools a stronger incentive to admit and serve them. In conjunction with the sliding scale that pares back amounts for higher-income students, this idea would promote an equitable scholarship system across the entire income spectrum.

Recommendation: Conference committee should add a weight to state scholarship programs to provide additional resources to support low-income students. It should also turn down the ESA proposal for non-chartered private schools.

Education governance: State and local

Governance was a hot topic during the last budget cycle, as Ohio lawmakers overhauled the state-level governance system. Instead of a fractured, nineteen-member State Board of Education (SBOE) trying to lead the way, the legislature empowered the governor to assume more leadership. The SBOE still exists, but its scope and responsibilities are now more limited, mainly to matters of educator licensing and territory transfers. Understandably, this budget does less on governance. But two issues are worth noting. First, the House proposed to reduce the size of the state board to five appointed members. The Senate, however, dropped that proposal and reverts to its current structure. The House version makes better sense on this issue, as the current size of the SBOE and its selection process (a mix of appointees and elected members) still makes for clumsy leadership in areas of educator policy. Second—and this deals with local governance—the Senate proposed to include the party identification of candidates running for district school boards on the ballot. Instead of making candidates’ political affiliations a state secret, this proposal would increase transparency at the ballot box and assist voters being asked to choose local government officials.

Recommendation: Following the House, reduce the size of SBOE to five appointed members. Following the Senate, require local school board candidates’ party identification to appear on the ballot.

Research and evaluation

States such as Kentucky, North Carolina, and Texas have become national models for data transparency and rigorous education research. While Ohio has solid data systems and a decent record of supporting research—including various Fordham studies—the state still has significant room to improve. Too often, state and local leaders fly blind or make decisions based on anecdote rather than evidence. For example, too little is known about why chronic absenteeism remains so high after the pandemic, or which attendance interventions have proven most effective. And virtually nothing is known about the improvement efforts in Ohio’s lowest-performing schools, much less what specific initiatives are making a difference. To encourage evidence-based policymaking in these and other areas, the Senate proposed the creation of an Education and Workforce Data Insights Board. The board, which would include representatives from early childhood, K–12, higher education, and business/workforce development, would be responsible for facilitating research and other data tools, and helping to publicize them. If enacted and implemented well, this idea has the potential to unlock the power for data to drive smart policy and practices. 

Recommendation: Following the Senate proposal, create the Education and Workforce Data Insights Board.

* * *

The budget process is always a journey, with a multiplicity of education ideas put forth and spirited debates about which ones should be put into action. As state lawmakers finalize the budget, they should ratify provisions that continue to move Ohio towards an education system that is responsive to communities and parents, and puts more students on pathways to success.


view
career awareness dollars blog image

Ohio lawmakers should preserve career awareness and exploration funds

Jessica Poiner
6.17.2025
Ohio Gadfly Daily

Over the last few years, Ohio policymakers have made expanding and improving career pathways a priority. Included in their efforts are career awareness and exploration funds, which were established in the 2021 state budget to do exactly what their name suggests—support career awareness and exploration opportunities for students. The Department of Education and Workforce (DEW) calculates annual funding amounts for the program based on the K–12 enrollment in traditional districts, charters, STEM schools, and joint vocational school districts. During fiscal year 2024, the state set aside $12.3 million and schools were awarded $7.50 per student.[1] For fiscal year 2025, the state set aside $16.3 million and schools’ per-pupil amount rose to $10.

Governor DeWine clearly recognizes the importance of career exploration and awareness, as his version of the bill requires students’ graduation plans to identify career goals and align students’ high school experiences to them. He also called for schools to report to DEW how they spend their career awareness funds—a welcome move that would improve transparency—and eliminated waivers that exempt districts from providing career-technical education (CTE) to seventh and eighth graders. But these new expectations weren’t accompanied by increased funding. Instead, the executive budget maintained current funding levels at $16.3 million for fiscal years 2026 and 2027.

It’s a tight budget year, so DeWine’s decision made sense, even if it was disappointing for advocates. It was shocking, though, when the House decided to eliminate the funding entirely. The Senate restored some of the dollars in its version, which is good news. But it limited the amount to just $5 million for each fiscal year, a sizable cut relative to current funding levels.

Policymakers will soon have to decide which of these proposals to include in the final budget. They should go with the executive version for three reasons.

First, career awareness and exploration funds are Ohio’s only dedicated state-level investment in general career readiness for all students, from elementary to high school. Over the last few years, policymakers have made significant funding investments in CTE programs that can help students explore and prepare for a variety of careers. But the vast majority of Ohio students don’t participate in CTE programs. During the 2022–23 school year, nearly 137,000 secondary students were CTE participants, meaning they completed at least one CTE course that year. That’s less than a third of Ohio’s total public high school enrollment. Most teenagers depend on their schools to provide exploration opportunities outside of CTE programs like career fairs, field trips, and job shadowing. Without a dedicated funding stream to cover costs, it’s unlikely schools will make providing these opportunities a priority—and students will pay the price.

Second, funding is necessary to implement several budget provisions. Both the executive and Senate versions require students’ graduation plans to identify career goals. All three versions eliminate middle school CTE waivers. If these policies make the final cut, public schools will be required to provide more career exploration, advising, and instruction to students than ever before. Yet both the House and Senate slashed funding that would help schools implement these changes. If lawmakers can’t find the means to raise per-pupil amounts, they should at least follow the governor’s lead and maintain current funding. Otherwise, implementation of new expectations could be ineffective.

Third, bolstering career awareness and readiness is crucial to Ohio’s future. Companies like Intel, Google, and Honda have invested billions in the state’s economy. And a 2024 report found that Ohio can expect a whopping 295,000 additional jobs by 2031. But educators, advocates, and employers are increasingly concerned that students aren’t prepared for these opportunities. In fact, many might not even know they exist, as thousands graduate each year with no idea how to pursue their interests or even what they’re interested in. To fix this problem, students need opportunities to explore careers.

Providing career exploration opportunities will require an investment from the state. Cutting these funds might save money now, but it won’t help students—or Ohio—in the long run. As they finalize the state budget, lawmakers should restore dedicated funding for career awareness and exploration.


[1] DEW is required to prorate the awards if earmarks aren’t sufficient.

view
Senate property taxes blog image

Senate budget takes a crack at untangling Ohio’s byzantine property-tax system

Aaron Churchill
6.12.2025
Ohio Gadfly Daily

With Ohioans facing sticker shock from tax bills tied to real estate inflation, property tax reform is top of the mind for state lawmakers. Last year, a joint committee held extensive hearings on property taxes and produced a report with findings and recommendations. Legislators have put forward various proposals that would shield homeowners from tax hikes, while also attempting to make Ohio’s byzantine local tax system more intelligible to the average citizen. Frustration with the system has led to a grassroots push to repeal property taxes altogether via a statewide ballot initiative.

It’s clear that something needs to change. The Senate version of the budget bill proposes important steps forward on property taxes. If enacted, these provisions would reduce some of the unnecessary complexity of the system and better equip voters to make informed decisions about education funding. Greater simplicity and transparency could also ameliorate voter irritation (and nip the urge to simply dump the system) and should help foster more productive dialogue between district leaders and citizens about the resourcing needs of local schools and students.

Specifically, the Senate addresses four structural problems by:

  • Eliminating the emergency levy moving forward. State law permits school districts to raise property tax revenues through special “emergency” levies. At face value, it might seem okay to allow a cash-strapped district to put out an urgent call to citizens for financial help through an emergency measure. However, as discussed previously on this blog, a district does not have to be in any stage of state-defined fiscal distress to put this type of levy on the ballot—all it has to do is claim the levy is needed to “avoid an operating deficit.” Today, 207 districts (about one in three) impose an emergency levy,[1] despite school funding being at record levels and districts sitting on billions in cash. This suggests that districts have exploited the policy, likely to use charged language to gain an edge at the ballot box, and as discussed next, to stay at the millage floor. The Senate plan encourages more “truth in advertising” by prohibiting districts from seeking emergency levies moving forward.
      
  • Requiring existing emergency levies to count toward the 20 mill tax floor. A well-known feature of Ohio property tax law is the “HB920 tax reduction factors.” Enacted in the 1970s, this policy shields homeowners from most of the tax increase associated with rising property values. Yet under a lesser-known policy, districts whose effective tax rates are at the 20 mill (or 2 percent) floor capture inflation-driven tax increases. As of 2023, more than 400 school districts are at this floor in at least one class of property (residential or commercial), meaning that taxpayers feel the pinch as their property values rise. One peculiarity, however, is that emergency levies do not count towards the 20 mill calculation. This exemption allows districts to pass emergencies levies, while also maintaining a tax rate that allows them to reap inflationary revenue gains. By incorporating provisions from a standalone bill (SB66), the Senate budget would close this loophole.
     
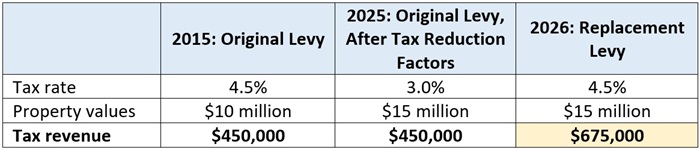
  • Repealing the replacement levy, moving forward. Following a House-passed standalone bill (HB28), the Senate eliminates the “replacement” levy. This special type of levy allows school districts to extend an existing levy, but at the tax rate voters originally approved sometime in the past. The issue here is that voted property tax rates—due to HB920 reduction factors—decline over time, such that the effective rate property owners actually pay is lower than the voted rate. The upshot: When districts pass replacement levies, they gain a windfall—and conversely, homeowners face a tax hike. The table below illustrates how this happens. When replacement levies pass, the tax rate resets, with districts generating additional revenue due to inflationary increases in property values.

    Table 1: Simplified illustration of how replacement levies generate additional tax revenueSenate property taxes blog table 1Voters may not be aware that the innocuous-sounding “replacement” levy actually constitutes a tax hike. In bill sponsor testimony, Representatives Adam Mathews and Thomas Hall drove home that point: “This incongruity can lead to surprises [higher tax bills] by voters when they think they had just voted to keep things as they were.” The Cleveland Plain Dealer editorial board has called for discontinuing the replacement levy on grounds of voter confusion, as have groups such as the Buckeye Institute and Ohio Chamber of Commerce. In sum, replacement levies are on the chopping block, and rightly so. Their elimination would add clarity at the ballot box, as districts would need to seek more transparent “additional” levies when they ask voters for a property tax increase.
     
  • Adding transparency and guardrails about district cash reserves when citizens are asked to vote on tax measures. One of the most-discussed issues this budget cycle has been school districts’ massive cash reserves. At the end of FY2024, districts sat on nearly $11 billion—the highest amount on record—with some districts having six months to more than a year’s worth of cash on hand. Lawmakers have voiced serious concerns about the size of these reserves at a time when Ohioans are feeling the pain of higher school taxes. In their budget proposals, both the House and Senate included a controversial idea to return some of those dollars to taxpayers when reserves exceed a certain level.[2] The concept is understandable, but has downsides, including the likelihood that districts would blow through their reserves just to get underneath the threshold.

    A couple Senate provisions would take a more tactful approach to addressing “excess” reserves, but through the ballot box rather than a hammer-like cap/refund policy. First, the Senate would prohibit districts from ballot measures when their reserves are above a year’s worth of spending. That’s sensible: Such districts are sitting on a lot of cash, and shouldn’t be going to voters asking for more money. Second, it would require disclosure of districts’ cash reserves on the actual ballot (assuming they’re under the reserve threshold). If—based on this information—voters believe their district is inappropriately asking citizens to pay higher taxes, they can vote “no” right then and there.

Ohio’s property tax system is complicated. That complexity makes it all the harder for citizens to understand their tax liabilities, what they are being asked to vote on at the ballot box, and how to hold local schools accountable for wisely stewarding their hard-earned money. Reforming the local tax system in ways that ensure fairness to schools and taxpayers will be heavy lift. But passing these commonsense provisions in this year’s budget will make that load just a touch lighter.


[1] Sixty-nine districts impose a “substitute” levy, which continues an expiring emergency levy. Substitute levies would also be repealed under the Senate budget, and existing ones would count toward the 20 mill tax floor.

[2] The proposed cash reserve thresholds are 30 and 50 percent of a district’s annual budget in the House and Senate plans, respectively.

view
Senate teacher shortage data blog image

The Senate budget would solve Ohio’s teacher data problem

Jessica Poiner
6.13.2025
Ohio Gadfly Daily

Teacher shortages have been making headlines in Ohio for years. Policymakers and parents are right to be concerned about such reports, given that teachers matter more to student achievement than any other element of schooling. But hard data about shortages—where they exist, how long they persist, and whether they’re concentrated in certain grades, subjects, or schools—are hard to come by because Ohio doesn’t collect detailed data on teacher vacancies. Without this information, it’s difficult for policymakers to effectively address potential shortages.

This year’s state budget could change that. Governor DeWine kicked things off in February by calling for the Department of Education and Workforce (DEW) to annually collect school employment and vacancy data and then summarize and publish them online. In April, House lawmakers opted not to include his proposal in their budget. The Senate, however, recently restored DeWine’s proposal and strengthened it.

The Senate’s version is definitely the best option on the table. Why? Let’s examine three key provisions that set it apart.

1. It requires DEW to collect data from all public schools.

DeWine’s initial proposal only required DEW to collect vacancy data from traditional districts. That’s understandable, as the vast majority of Ohio students attend district schools. But focusing only on traditional districts means overlooking the tens of thousands of Ohio students who attend public schools that aren’t district-run, including charters, Joint Vocational School Districts (JVSDs), and STEM schools. It’s crucial for DEW to collect data from all public schools to shed light on vacancies across the entire school system—and that’s exactly what the Senate version does.

2. It requires DEW to disaggregate data at the district and school level.

The governor’s proposal would require DEW to disaggregate vacancy data in a variety of ways, including by broad geographic area. This is important because schools in different regions have different needs. But in a state as large as Ohio, limiting data tracking to regions could mask significant shortages in specific districts and schools. For example, a shortage of math teachers in central Ohio doesn’t mean all districts in that region are facing hiring challenges. The shortage could be limited to big districts like Columbus, Olentangy, or South-Western, which could skew the regional data because of their size. Smaller districts might have completely different needs, like science or special education. Meanwhile, within larger locales, shortages could be concentrated in specific schools or neighborhoods rather than across the entire district.

To effectively address shortages, state and local leaders must be equipped to pinpoint exactly where they exist. It’s sort of like fixing a leak in your house; until you find the spot in the roof that needs repair, the leaks will continue. That’s why it’s so important that the Senate’s budget requires DEW to report vacancy data at the state, district, and school level. Doing so will help leaders find and repair the leaks.

3. It requires DEW to track teacher supply along with demand.

Teacher shortages are about supply and demand. Collecting vacancy data addresses demand by identifying which districts and schools have vacant positions that must be filled. But tracking supply—including the number of individuals entering the profession—is equally important because it’s the only way to get a complete picture of the labor market. For example, if vacancy data show that Ohio needs more math teachers, lawmakers could implement policies like state-funded scholarships, refundable tax credits, or bonuses in an effort to bolster recruitment and retention. But if Ohio’s teacher preparation programs already have enough math teachers coming down the pike to fill existing vacancy gaps, then it might be wiser to focus those policies on other areas, like special education or career-tech. 

The Senate’s budget would shed light on supply-side numbers by requiring DEW to collect and report the enrollment and completion rates of teacher preparation programs, the number of new educator licenses issued annually, and data on teacher retention and demographics. This information, when combined with vacancy data, will give state and local leaders the complete picture they need to make informed policy decisions.

***

There’s no way to know which teacher data proposal will make it into the final budget. But enacting the Senate’s version would equip state leaders with the in-depth information they need to implement effective policy solutions. For too long, Ohio has struggled to understand potential teacher shortages. It’s time to finally get some answers.

view
Supporting homeless students SR image

Examining school and community factors to support students experiencing homelessness

Jeff Murray
6.24.2025
Ohio Gadfly Daily

Students who experience homelessness are at high risk for a number of negative academic outcomes—including chronic absenteeism, course failure, and low test scores—to say nothing of the physical and emotional toll. But these negative outcomes are not a foregone conclusion. Hundreds of millions of dollars are invested annually to support students and their families through schools, nonprofit organizations, religious groups, and government programs. A new study tries to tease out the school and community resources that have the most positive influence on young people who experience periods of homelessness, with an admirable focus on academics.

Michigan State University researcher Tasminda Dhaliwal looks at data from public schools across the Great Lakes State between 2011 and 2018, focusing on six specific factors she theorizes may help students who experience homelessness achieve in school despite their trying situations. She conducts a series of fixed-effect regressions to map their impacts both individually and in combination.

Primary data come from the Michigan Department of Education and cover 2 million students attending public schools in the state over the seven school years. (While Dhaliwal specifically notes that cyber charter school students are excluded, she does not categorically state that brick-and-mortar charter students are included; the sum of the information provided in the report seems to indicate that they are.) The data include indicators that denote whether a student has ever experienced a period of homelessness, as required under the McKinney-Vento Act and using the criteria and definitions established in that federal legislation. Academic outcome data include attendance (share of days attended of the total enrolled) and scores on the state’s standardized achievement tests for grades 3–8 and 11 in English language arts (ELA) and math. School-level data include the average years of teaching experience, share of teachers with a master’s or doctoral degree, share of teachers who have two or fewer years of experience, and support-personnel-to-student ratios (counselors, social workers, psychologists, and teacher aides). Neighborhood characteristics such as percentage of college-educated citizens, racial composition, and employment levels come from the American Community Survey, while information on businesses and organizations related to health and social assistance (everything from hospitals and clinics to food pantries and family shelters) come from a resource called ReferenceUSA.

Dhaliwal identifies and tests six broad categories of school- and neighborhood-based factors that should provide supports for students experiencing homelessness. They are peer socioeconomic advantage, teacher qualifications and experience, school support personnel, neighborhood advantage, neighborhood educational and occupational attainment, and neighborhood social services. Each one has several sub-factors that are also analyzed via regression. Students who were ever identified as experiencing homelessness are compared with those who weren’t.

Her findings indicate that availability of school support personnel, teacher qualifications and experience, and neighborhood educational and occupational attainment operate as positive supports for all students—whether they experience homelessness or not—boosting all three academic outcomes of interest over students who do not have these advantages. The better-resourced school and community are, the higher all students perform in school. Only two factors were seen to benefit homeless students more than non-homeless students—peer socioeconomic advantage and neighborhood socioeconomic advantage—and even these only impact attendance measures, not the two test scores. In fact, peer socioeconomic advantage is actually a drag on both math and ELA test scores for students experiencing homelessness. Dhaliwal theorizes that students of higher socioeconomic status—especially ones with better and more consistent attendance—could attract “resources” like the time and attention of the most experienced teachers to the detriment of more transient peers. But she does note that all of the significant effect sizes observed are small in magnitude and reflect a complex interplay of factors—including any number of variables unaccounted for in the data despite the rigor of the analysis conducted.

Dhaliwal concludes by recommending further research, not only into the nuances of the various factors (and indeed into the various lengths and circumstances around bouts of homelessness), but also into actual efforts implemented to support these students and their families. One hopes that detailed school choice data could be a specific feature of any future research, rather than lumping charter and district students together, since more than half of all students in Flint and Detroit, for example, attend charter schools rather than their zoned district schools. Does decoupling school attendance from residential address help or hurt homeless students’ attendance? Which neighborhood’s “factors” impact students who live in one place but attend school in another? Could cyber charter students experiencing homelessness have an advantage over brick-and-mortar school peers because they can access their school from any location, regardless of transportation availability, and often at non-traditional times of day? School choice is intended to decouple education from residential address (albeit for a different reason than supporting homeless students). Leaning into that fact would help expand this already-useful research.

SOURCE: Tasminda K. Dhaliwal, “Promoting Resilience? The Role of Schools and Neighborhoods in Supporting the Success of Students Experiencing Homelessness,” Educational Researcher (May 2025).

view
Graduation cap and money

Historical trends of the college wage premium

Jeff Murray
6.19.2025
Flypaper

The “college wage premium” is typically defined as the difference between average wages earned by workers with a four-year degree versus those earned by workers with a high school diploma. For decades, the premium for degree completers has been substantial, and remains so today. However, research shows the gap has recently plateaued and a new working paper tries to pinpoint the causes.

Researchers Zachary Bleemer and Sarah Quincy (from Princeton and Vanderbilt, respectively) start by confirming the existence and trends of the college wage premium using data going all the way back to 1900. Sources include the U.S. Census, military test score records, and a raft of  longitudinal surveys from the U.S. Bureau of Labor Statistics. College data come from IPEDS, College Scorecard, and previous research. While their findings confirm generally positive wage returns for college completion over the last century, not all students benefit equally. They determine that the college wage premium received by lower-income Americans completing degrees has halved since 1960, a troubling trend they call “regressivity.”

Their analysis largely rules out student readiness as a major factor, showing that the rich-poor test-score gap within the college-going population has been roughly flat (about 10 percentage points) since 1965. They conclude that ability-based selection is unlikely to explain this regressivity to any great degree. Instead, Bleemer and Quincy zero in on three factors that they say combine to explain 80 percent of the observed regressivity.

First, the institutions where lower-income students are concentrated—what they call “teaching-oriented public universities”—have declined in funding, student retention, and economic value for graduates since 1960, relative to research-oriented public institutions.

Second, lower-income students have been disproportionately enrolling in community and for-profit colleges since 1980 and 1990, respectively, rather than in higher-value four-year non-profit institutions. The main problem with increased community college enrollment for lower-income students (the gap between bottom- and top-tercile student enrollments has been 20 percentage points for decades) is that capable students shun higher-value four-year institutions to their detriment, while the poor outcomes of for-profit college students—including a sky-high dropout rate and post-graduation earnings that are often lower than individuals with only a high school diploma—are well documented.

Third is the difference in major choices among higher- and lower-income students. Students from the bottom parental income tercile declared majors of similar value to their top-tercile peers in the 1980s and 1990s, but they are today declaring majors that annually pay about 4 percentage points less, including those in the humanities.

What does all this mean? Bleemer and Quincy are not overly pessimistic in their assessment, saying that regressivity is likely “not a permanent feature” of postsecondary education, given the “wide range of policy changes affecting both college supply and demand” in recent years. They note the contraction of community college enrollment since its peak in 2012, the phase-in and phase-out of race-based affirmative action, the boom-and-bust cycle of for-profit colleges (although they could boom again), and ongoing changes in federally-subsidized financial aid programs. The authors recommend additional research to “disentangle the importance of each policy to the various channels that have generated regressivity” over time.

However, while the paper’s findings might indicate a putative end to regressivity, they aren’t necessarily good news for the college wage premium generally. Any number of other connected factors could serve to render college degrees less valuable in the future—an end to the historic signaling function of college degrees among employers, the impacts of K-12 grade inflation on true college readiness versus readiness “on-paper,” and the receding of the old “college for all” mentality. To solve both problems, perhaps we should encourage community colleges to return to their previous incarnation as tech schools, and make sure that students of all socioeconomic statuses who want a traditional college experience go to the four-year schools that are good at providing high-value degrees.

SOURCE: Zachary Bleemer and Sarah Quincy, “Changes in the College Mobility Pipeline Since 1900,” NBER Working Papers (May 2025).

Fordham Logo

© 2026 The Thomas B. Fordham Institute
Privacy Policy
Usage Agreement

National

P.O. Box 110
Burke, VA 22009

202.223.5452

[email protected]

Ohio

P.O. Box 82291
Columbus, OH 43202

614.223.1580

[email protected]

Sponsorship

130 West Second Street, Suite 410
Dayton, Ohio 45402

937.227.3368

[email protected]