

Standards & Accountability
Dumping U.S. history and government exams is the last thing Ohio should do
Schools have a responsibility to educate students about what it means to be an American.
Schools have a responsibility to educate students about what it means to be an American.

Schools have a responsibility to educate students about what it means to be an American. Students should exit high school with an appreciation for our nation’s values, among which include freedom, liberty, and justice for all—and the knowledge of how we’ve failed at times to live up to them. They should come away understanding how free-market principles have raised living standards to unseen heights. And how our ancestors fought tyranny overseas and won. Schools should teach students how democratic institutions protect our unalienable rights and give voice to all Americans today.
Yet various data indicate that schools are failing in this important task. Consider recent surveys revealing troubling attitudes among young people about our nation and its ideals.
Besides these glum views, the Nation’s Report Card (NAEP) reveals major deficiencies in students’ knowledge about America. In 2022, just 13 and 20 percent of eighth graders scored proficient on national U.S. history and civics exams, respectively. Other survey data uncover similar knowledge deficits among young people, whether in high school or college.
Ohio lawmakers should be doing more to make sure that students are well-educated in American history and government. Yet a recent proposal from House lawmakers would hit the brakes. What do they propose, and how would it undermine civics education? And what could lawmakers do instead that would give students a stronger understanding and appreciation for our nation?
First, the bad idea. Tucked in a larger bill aimed at public school deregulation, Representatives Gayle Manning and Adam Bird seek to eliminate Ohio’s U.S. history and government end-of-course exams. Though these high school tests are not required under federal law—likely why they’re being targeted—the proposal would erode accountability for civics education. Results from these exams are reported publicly and count towards schools’ state ratings, as they are included in performance index and value-added scores. These checks help ensure that high schools, at least,[1] prioritize civics education, alongside math and reading.
Dumping the U.S. history and government tests would actually turn back the clock by more than two decades, as the state has long administered high school social studies exams.[2] Without a history assessment, Ohio would no longer check whether students know something about the New Deal, World War II, and the Cold War—all topics outlined in the state’s high school history standards and which may appear on the state exam. Lacking a government exam, students’ understanding of the Declaration of Independence, Northwest Ordinance, and U.S. Constitution could go untested.
Lawmakers should resist the urge to cut U.S. history and government exams, but also consider constructive steps that can improve civics instruction from elementary to high school. This is a bigger discussion than what space affords here, but let’s consider three starter ideas:
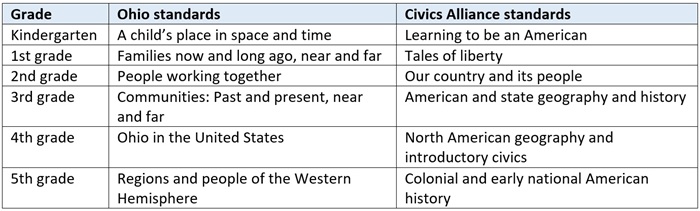
1. Beef-up instruction about American history and civics in elementary schools. As a 2021 national Fordham analysis pointed out, U.S. history and government content is lacking in Ohio’s elementary social studies standards. Having read these standards (and Ohio’s model curriculum) myself, I cannot help but concur. It is indeed thin gruel in the earliest grades. In grades K–3, the only clear expectation that schools teach children about their country comes in kindergarten. There, schools are prompted to teach that “symbols and practices of the United States include the flag, Pledge of Allegiance, and the National Anthem.” Nowhere else do we find expectations in those grades that schools introduce children to crucial events (e.g., American Revolution), influential figures (e.g., Abraham Lincoln), important places (e.g., Ohio River), or founding documents (e.g., Constitution). Instead, we discover mostly vague, uninspiring statements such as a first grade history standard urging schools to teach that “the ways basic human needs are met have changed over time.”
To put a finer point on it, consider the stark contrast between Ohio’s social studies standards and those developed by the conservative Civics Alliance. In its K–3 standards, the emphasis rests on teaching children about their nation. Meanwhile, Ohio’s early elementary standards are organized around family and community, topics worthy of inclusion, but don’t introduce American history and government in a serious way until fourth grade. To be clear, I am not suggesting that Ohio rush out and adopt the Civics Alliance framework, as policymakers would need to address concerns or be ready to stand firm against progressives’ pushback.[3] Still, it’s worth reading the two sets of standards side by side (and other quality standards) and judging for yourself whether Ohio does enough to promote knowledge about America during elementary school.[4]
Table 1: The main theme of Ohio and Civics Alliance social studies standards, grades K–5
2. Ensure the U.S. history exam covers all the nation’s history, from 1492 to present (not just 1877 through today). Surprisingly, Ohio’s U.S. history exam doesn’t cover the full sweep of the nation’s history. Why? Ohio’s social studies standards split American history into two courses: an eighth-grade course that covers history until 1876, and then a high school course that covers 1877 to the present. This means that the high school U.S. history exam only covers “part II” of American history.[5] And since there is no eighth-grade social studies assessment, students’ knowledge about colonial America, the Revolutionary War, westward expansion, and slavery and the Civil War goes untested. Lawmakers should make sure that students have a firm understanding of all American history, which—assuming the state maintains its current social studies framework—means adding an eighth grade U.S. history exam to its high school test.
3. Require students to pass the U.S. history and government exams (or the citizenship test, as an alternative) as a condition of graduation. Students passing U.S. history and government exams earn one of the two “seals” needed for graduation. That’s an OK start. But since students have a dozen seal options—and course grades may substitute for test passage—they can easily graduate without demonstrating proficiency on U.S. history and government exams. State lawmakers should insist that students pass these exams or the citizenship test, as GOP gubernatorial candidate Vivek Ramaswamy has proposed. This would push American history and government to the forefront in schools’ priorities, motivate students to learn valuable content, and help ensure that all Ohio students leave high school with the knowledge necessary for responsible citizenship.
* * *
Ohio schools should be places where students learn what it means to be an American. Standards and accountability measures help ensure schools carry out this important responsibility. These policy levers aren’t the only ones that matter, of course, but they are essential if we are to graduate young people knowledgeable about our nation and the values that have held it together for almost two hundred and fifty years.
[1] State lawmakers in 2021 ditched the fourth and sixth grade social studies exams, so there is no assessment-based civics accountability before high school.
[2] In previous iterations of the state testing program, this consisted of a ninth-grade citizenship test and, later, a tenth-grade social studies Ohio Graduation Test.
[3] House Bill 103 of the 135th General Assembly proposed a task force charged with revising social studies standards with an eye toward using the Civics Alliance framework as a baseline. The bill did not move out of committee (for proponents and opponents, see here).
[4] Some elementary schools may introduce American history and government through strong, knowledge-rich ELA curricula such as Core Knowledge Language Arts and Wit and Wisdom.
[5] The only exception is that high school U.S. history covers founding documents (e.g., Constitution and Declaration of Independence), as does eighth grade history.

In September, the Ohio Department of Education and Workforce (DEW) released the latest round of school and district report cards, which cover the 2024–25 academic year. Here at Fordham, we’ve been digging through the data to provide some overarching analysis. Some of it, like disappointing early literacy results and Ohio’s persistent chronic absenteeism problem, are cause for concern. Other findings, like the comparative success of charter schools, provide reasons for optimism.
Nestled between these two extremes are Ohio’s math results. There are glimmers of good news, to be sure. But there’s also a lot of work to be done and no time to waste. Here are three big takeaways that will hopefully inspire state leaders to take action on policies that can boost math achievement.
1. Math proficiency improved incrementally since last year.
Chart 1 shows the number of students who scored proficient or above on the state’s math exams during the two most recent school years. In the final column, which identifies the difference between 2024 and 2025 results, green shading indicates improvement and red indicates a decline.
Chart 1. Percentage of students scoring at least proficient on math state tests in 2024 and 2025
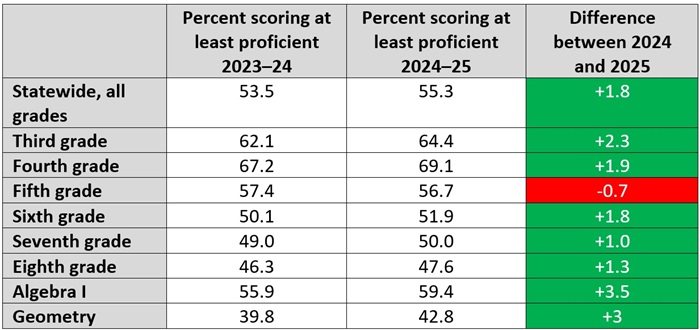
For the most part, the year-to-year differences are positive. The overall statewide proficiency rate went up by 1.8 percentage points, which is much better than the measly half a percentage point the state managed between 2023 and 2024. In elementary and middle school, third grade registered the largest improvement in proficiency, with a jump of 2.3 percentage points. But it was the high school exams of Algebra I and geometry that produced the largest gains overall (3.5 and 3 percentage points, respectively). Meanwhile, the only grade level to see a drop in proficiency was fifth, though it was by less than 1 percentage point.
Although the year-to-year differences are positive, it’s important to recognize that there are significant numbers of students who aren’t meeting grade level standards. On two tests, eighth grade math and geometry, proficiency was below 50 percent. Last year’s eighth grade results are especially worrisome, as these are students who are now in their first year of high school. In less than four years, they’ll be out in the world as adults—and less than half of them are currently proficient in math. Third and fourth grade results are encouraging, as proficiency is around or above 65 percent. But even in these areas, there are still tens of thousands of students who aren’t proficient.
2. Proficiency rates still haven’t returned to pre-pandemic levels.
Ohio’s state report card summary celebrates that we’ve seen “encouraging improvements” in statewide math proficiency over the past five years. And as outlined above, proficiency has improved in nearly every grade level. But limiting comparisons to the past five years means setting the 2020–21 school year as the baseline for improvement. That’s the same academic year that state test results cratered courtesy of the pandemic. In fact, in the majority of grades and subjects, 2021 test scores are the lowest on record over the last decade. When scores are that low during the baseline year, it’s not difficult to show improvement.
To get a complete picture of math achievement in Ohio—and to put improvements into the proper perspective—it’s crucial to compare recent results to pre-pandemic proficiency rates. Chart 2 shows the number of students who scored proficient or above on the state’s math exams during the 2018–19 and 2024–25 school years. The final column identifies the difference between the two, with red shading indicating that the proficiency rate hasn’t returned to pre-pandemic levels.
Chart 2. Percentage of students scoring at least proficient on math state tests pre- and post-pandemic
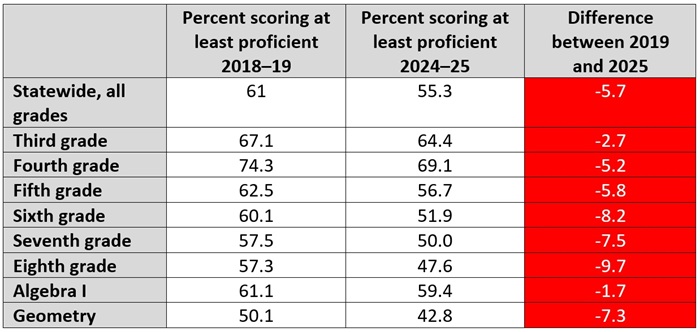
It should worry policymakers, advocates, and families that the entire final column is red. Statewide and in every grade level, math achievement has yet to bounce back to pre-pandemic levels. But it’s the size of these discrepancies that should shift the worry meter into overdrive. Fourth and fifth grade have a gap of more than 5 percentage points. Seventh grade and geometry have a gap of approximately 7 percentage points. Sixth grade clocks in at just over 8 percentage points. And eighth grade has a whopping 9.7 percentage point difference. Remember, the statewide proficiency rate jumped less than 2 percentage points this year. If Ohio doesn’t start improving at a more rapid pace, it will take another five years to close all of these gaps.
3. More than a fourth of students are scoring limited in most grades.
When students take Ohio’s state exams, their results fall into one of five performance levels: limited, basic, proficient, accomplished, and advanced. The top three levels (proficient, accomplished, and advanced) are considered passing scores, while the lowest (limited) is a red flag that students are far behind and at serious risk of falling further still.
Chart 3 shows the percentage of students who scored limited during the last two academic years. The good news is that the number declined in every grade except eighth. The bad news is that even with these declines, there are still significant numbers of students scoring limited. In elementary and middle school, the percentage ranges from 23 percent in fourth grade to an eye-popping 38.5 percent in eighth. Algebra I posted the smallest percentage, perhaps because the exam is part of Ohio’s graduation requirements and has higher stakes attached. Even so, a fifth of students are still scoring limited in a subject that’s critical for future success.
Chart 3. Percentage of students scoring limited on math state tests

***
Ohio has a math problem. Too many students aren’t meeting grade level standards. Achievement has yet to bounce back to pre-pandemic levels. Tens of thousands of kids are scoring in the lowest achievement category. And while proficiency rates did improve compared to last year, an average bump of less than 2 percentage points isn’t enough. It’s time for state leaders to buckle down and take the math crisis in Ohio seriously. Students are counting on it.

Last month, when the state released data from the 2024–25 school year, the Ohio Department of Education and Workforce’s State Report Card touted the fact that test scores are at five-year highs. It’s true that achievement has risen from the disastrous lows right after the pandemic. Yet the department’s cheery depiction of student performance elides other truths: Achievement remains well below pre-pandemic marks, and achievement gaps remain unacceptably large.
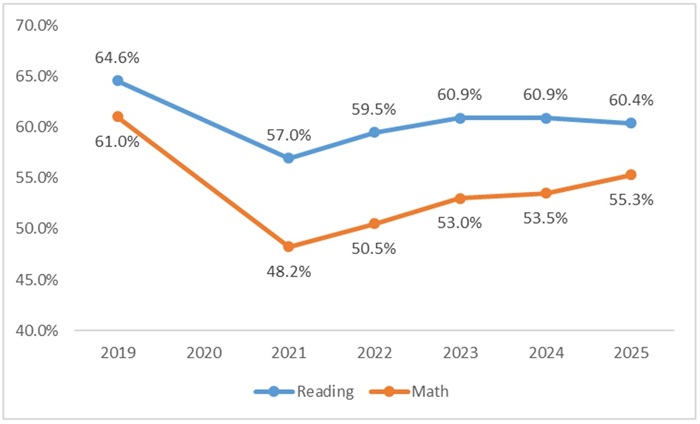
Let’s take a closer look at where student achievement stands—using a pre-pandemic baseline, not just a post-pandemic one. Figure 1 starts with the overall picture, showing statewide math and reading proficiency rates across all state exams (tests and proficiency standards were constant during this timeframe). In reading, proficiency last year was still 4.2 percentage points below the pre-pandemic proficiency rate of 64.6 percent. Math proficiency, despite trending upward over the past few years, continues to lag well behind the pre-pandemic mark. Last year, 55.3 percent of Ohio students achieved math proficiency, 5.7 percentage points below the rate in 2018–19.
Figure 1. Statewide proficiency rates in math and reading, 2018–19 (pre-pandemic) to 2024–25
The uneven “K-shaped” academic recovery, whereby disadvantaged students lost more ground during the pandemic and have made weaker progress since then, has been a much-discussed pattern nationally. Has this happened in Ohio, too? Yes and no.
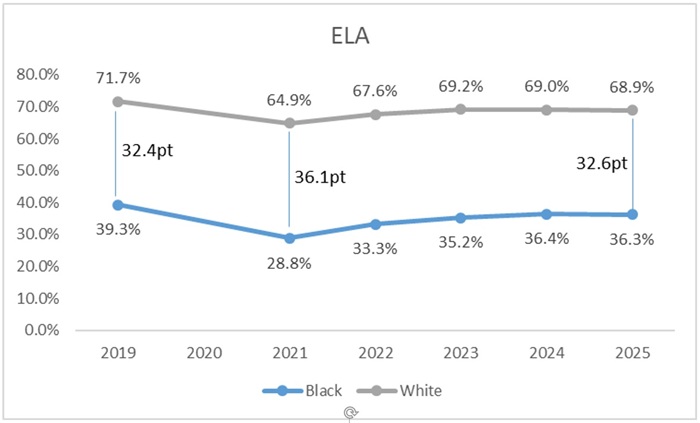
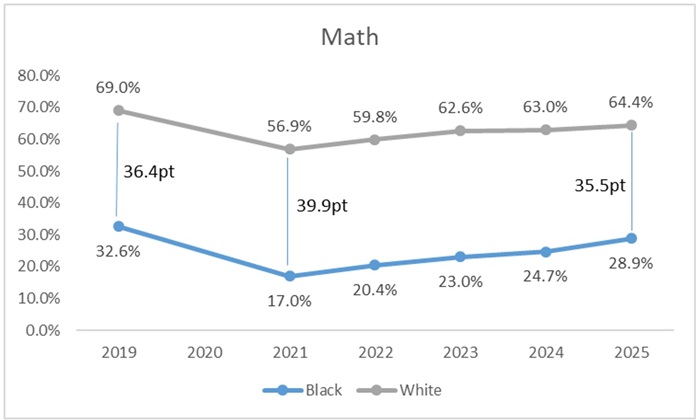
The charts below show proficiency rates for Black and White students, who together represent about four in five Ohio students overall. At a baseline, Ohio struggled with massive achievement gaps prior to the pandemic: In 2018–19, Black students’ proficiency rates lagged 32 and 36 percentage points behind in reading and math, respectively. The gap widened during the pandemic, reflecting prolonged closures, chronic absenteeism, and overall poor educational delivery in urban schools during those years. Since then, Black students’ proficiency rates have risen at a slightly faster clip than White students, which has narrowed the gap relative to 2020–21. That’s a bright spot, especially given concerns about weaker recovery for less advantaged student groups. Nevertheless, fewer Black students achieve proficiency today than Black students pre-pandemic: 36 versus 39 percent in reading and 29 versus 33 percent in math.
Figure 2. The Black-White achievement gap, 2018–19 to 2024–25
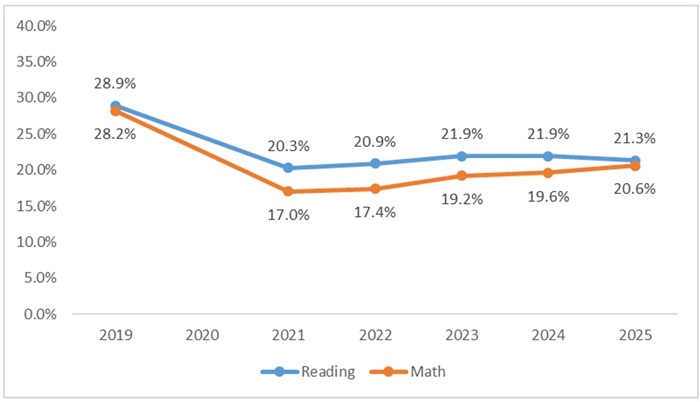
Representing just over 15 percent of Ohio pupils, students with disabilities are another group that experienced substantial declines during the pandemic. But we see almost no recovery in reading and only sluggish progress in math. Proficiency rates for students with disabilities continue to trail far behind the state average (35 to 40 percentage points below), and remain depressed relative to the pre-pandemic proficiency rates of students with disabilities (8 points behind).
Figure 3: Math and reading proficiency rates of students with disabilities, 2018–19 to 2024–25
Achievement gaps between low-income students and their peers are also commonly examined and discussed. However, Ohio’s data on this student group are no longer accurate, as the state now identifies large numbers of middle- and high-income students as “economically disadvantaged” due to changes in federal subsidized meals policy.[1] Proficiency rates for economically disadvantaged students have risen rapidly since the pandemic and now match pre-pandemic levels in reading and nearly do so in math. The gains, however, likely reflect to a large extent the changing—more affluent—composition of the student group.
* * *
Thankfully, schools have returned to in-person learning and their normal routines. Yet the pandemic continues to cast its shadow over the educational outcomes of Ohio students. Five years later—and with billions in federal Covid cash spent—Ohio remains underwater relative to pre-pandemic achievement in math and reading. Achievement gaps are still unacceptably large.
Much ink has been spilled about how to accelerate academic recovery. Proposals include going all-in, as Ohio is doing, on evidence-based reading instruction, giving struggling students more time and interventions (e.g., summer school or high-dosage tutoring), and pushing hard for school attendance. But even these ideas are unlikely to get students entirely back to the pre-pandemic square one—and then some. That will take further initiatives like strengthening accountability measures—such as third-grade retention and state intervention in poor-performing schools—to add urgency to math and reading improvement efforts. It’ll also require policies aimed at dramatically improving math instruction, an issue that Ohio has not yet addressed in a serious way. Bolder moves toward equitable charter school funding would better support the thousands of needy students attending those public schools. And an overhaul of archaic teacher policies that protect incompetent educators (tenure) and fail to reward our best classroom teachers is also needed.
With two in five Ohio students falling short of proficiency, and large majorities of minority and special-needs students struggling in math and reading, it’s hard to put a sunny face on 2024–25 exam results. Yes, there’s been progress since the darkest days of the pandemic. But there is a whole lot more that needs to get done. Let’s get cracking.
[1] In 2018–19, 49.9 percent of Ohio students were deemed economically disadvantaged. In 2024–25, the percentage was 62.1 percent.

Much like fashion and music trends, public policy can be cyclical. When reconsidered with fresh eyes, ideas once left for dead can take on new life. In education policy, the latest example is teacher merit pay.
Research demonstrates that merit pay programs are associated with a statistically significant increase in student test scores. They also have the potential to decrease teacher turnover and increase recruitment. That same research, however, indicates that success depends on design and context. If state leaders want merit pay to be successful in Ohio, then getting the details right matters. And since Ohio doesn’t have a teacher merit pay policy, getting things right means learning from others.
Enter the Lone Star State. In 2019, Texas officials began implementing a teacher performance pay program known as the Teacher Incentive Allotment (TIA). This statewide initiative provides districts and schools with the option to create and use a local designation system to identify top educators. Employing those teachers generates additional state funding for participating districts, as they receive an annual allotment based on a teacher’s designation level. Designated teachers can then receive sizable pay bumps. (For a more in-depth look at how TIA works, see here.)
Participation in TIA is voluntary and growing exponentially—from 35 districts in 2019 to more than 800 by 2025, roughly two-thirds of all Texas school systems. That level of popularity should pique the interest of Ohio leaders, given previously unpopular efforts to establish merit pay. But it’s the program’s impact on students and teachers that really deserves attention. And according to a statewide analysis conducted by Texas Tech University,[1] the impact has been large and positive.
The analysis assesses the causal impact of TIA on 26 districts in the first cohort of participants. Collectively, they serve more than 414,000 students. Student-level data for the 2013–14 through 2022–23 school years come from the State of Texas Assessments of Academic Readiness (STAAR), which are annually administered to students in grades 3–8 in math and reading.[2] To measure the impact of TIA, the analysts employ the synthetic control method to construct a control group that mirrors the pre-treatment characteristics of TIA districts. They identify three key takeaways.
First, implementing TIA “moderately and meaningfully” impacted math and reading achievement. Test scores in both subjects dropped in the wake of the pandemic, but TIA districts produced smaller declines than observably similar districts. The authors note that this suggests TIA may have provided a “buffer” against pandemic disruptions. During the 2021–22 and 2022–23 academic years, TIA districts consistently outperformed the control group in math. Reading results were more volatile, but just as they did in math, TIA districts outperformed the control group in reading.
Second, TIA has mitigated teacher turnover.[3] During the 2020–21 academic year, immediately following TIA implementation, TIA districts registered a reduction in teacher turnover of approximately 5 percentage points compared to the control group. In other words, during an unpredictable year in the heart of the pandemic, TIA districts experienced “enhanced stability” among their teaching workforce. In the years that followed, TIA districts generally maintained lower turnover rates.
Third, there are “particularly pronounced” effects for teachers with three to five years of experience. During the 2020–21 school year, TIA districts demonstrated a significant reduction in turnover—approximately 7 percentage points—among this subset of teachers. Moreover, student achievement in the classes they taught showed “more marked improvements” in both math and reading compared to newer and more veteran teachers. According to the authors, these findings suggest that TIA may be most effective at improving stability and performance among early-career teachers.
The upshot? TIA has positively impacted both student achievement and teacher retention in Texas. There are some important nuances and implications, including that the effect magnitude differs across implementation years. But overall, this is compelling proof that TIA is worth the time, effort, and money that Texas leaders have invested. If Ohio leaders are serious about bringing teacher merit pay to the Buckeye State, TIA could well be the blueprint.
[1] Texas Tech plays a crucial role in the implementation of TIA. As part of the application process, districts submit teacher designations and performance data to Texas Tech for validation.
[2] Data from 2019–20 were excluded due to pandemic school closures. The analysis focuses on math achievement for grades 4–7 and reading for grades 4–8. Math achievement for eighth grade students was not evaluated because students enrolled in Algebra I in eighth grade take an end-of-course exam.
[3] Teacher turnover is defined as a teacher leaving Texas public schools entirely.
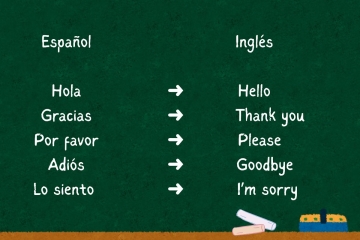
While potential cuts to federal funding for English learner (EL) services in schools are currently making noise, some timely new research takes a preliminary look at EL students whose parents choose to forgo the services they are entitled to under the Every Student Succeeds Act. How widespread is the practice? And who are the families opting out?
A research team led by Karen Thompson of Oregon State University looked at data from three states: Oregon, Texas, and Michigan. These include cohorts of students who entered ninth grade for the first time between 2011 and 2016; the total sample comprised over 116,000 EL students followed through 2020. They focus on grades 9–12 for this initial analysis because high schools saw the highest prevalence of students waiving services and because the limited prior research on the topic also focused on high school, allowing the team a reasonable comparison for their findings.
The majority of EL students in Oregon and Texas were Hispanic and reported speaking Spanish at home. In Michigan, about 40 percent of EL students were Hispanic (with about the same percentage reporting speaking Spanish at home) and just over 43 percent were White, with Arabic, English, and Albanian languages reported. There were slightly more males than females in all states, and more than 80 percent of EL families in every state were reported as economically disadvantaged.
The percentage of students whose families waived EL services varied widely across states: 2.1 percent in Michigan, 4.7 percent in Texas, and 14.3 percent in Oregon. Those rates remained relatively stable across high school years in Michigan and Texas; however, the rates rose sharply in Oregon, from 9.3 percent of freshmen to 26.3 percent of seniors. In all three states, families of students in special education, families of students considered long-term English learners (those who had received EL services for 7 or more years), and families of higher-income students were the ones most likely to waive services.
This is as far as the preliminary analysis goes for now (future studies will examine student outcomes), but the researchers do advance two broad possibilities to explain the opt-out patterns. First is variation in what services are provided for EL students. They offer the example of Oregon, where services at the time consisted of a single daily language course that did not result in credit toward a diploma. As graduation grew closer, it stands to reason that optional, non-credit-bearing courses would be jettisoned if students were in danger of not meeting their diploma requirements. By comparison, a majority of Texas EL courses provided graduation credit, and EL services in Michigan were largely provided via pullout interventions separate from course schedules. Of note, EL courses began bearing graduation credits in Oregon in 2021 in the wake of Covid disruptions, so subsequent analysis could bear out their supposition.
Second is variation in parental calculation of need or utility of services. They point to the subset of students who received both EL and special education services in all three states and suggest that waiving EL services would likely open up time for more special education courses or other interventions, which may have been attractive to families—especially, again, as high school graduation approached. They suggest further research on long-term ELs who also were identified with a disability in each state to investigate this possible mechanism.
There are more questions than answers here, obviously, but the avenues for further research seem clear and intriguing. Most relevant to the current political discussion: How do EL students fare academically with and without those services?
SOURCE: Karen D. Thompson, et al., “Waiving English Learner Services: Prevalence and Student Characteristics,” Educational Researcher (September 2025).

Except for cancelled proms and mothballed graduation celebrations, the class of 2020 largely escaped the negative impacts of pandemic school closures that wreaked havoc on younger students. As graduating seniors, their academic requirements were largely complete, and priority was given to making sure those who still needed a course or a credential got it, even if most other school functions were locked down or limited. Graduates who planned to go on to college, however, couldn’t escape Covid’s impact on post-high school plans. New research looks at California graduates to determine if and how their college enrollment patterns shifted.
A quartet of researchers from the University of California, Davis, and the University of Texas, Austin, link individual-level administrative data on hundreds of thousands of California high school graduates from 2016 to 2020 to FAFSA completion data from the California Student Aid Commission and college enrollment records from the National Student Clearinghouse. They create pooled mean data for the classes of 2016, 2017, and 2018, and compare that to the class of 2019 to craft a picture of pre-pandemic trends. These trends are then compared to enrollment pattern changes observed for the class of 2020. College enrollment data are measured at the spring semester following high school graduation (e.g., spring 2021 for 2020 graduates) to try to separate short term deferrals from actual lack of enrollment. The results are broken down by college type—in-state community colleges (two-year), the University of California system (four-year), other California state universities (also four-year), and everything else (California private colleges and any out-of-state institution, both two-year and four-year).
As may be expected, they find sizable negative effects on college enrollment for California’s graduating class of 2020. They estimate that Covid disruption lowered overall college enrollment by 7.6 percent by the spring of 2021, this on top of an already-declining rate from 2016 to 2019. Declines were largest in the community college sector (a 12.6 percent drop), for Black and Latino students (13.9 and 9.3 percent, respectively), for low-income students (10.3 percent), and for students from high schools with already-low college-sending rates. Interestingly, enrollment in the highly selective University of California system actually increased by a small but significant 4.5 percent over pre-pandemic rates. Gains were concentrated among Asian and White students and from schools that historically sent a large share of their graduates to college.
The authors conclude that those graduates who were most likely to go on to college in a normal year did not let the pandemic stop them in 2020, although many likely opted to stay closer to home than might otherwise have been the case. Many likely also deferred from fall entry to spring due to concerns over online learning or health worries, although detailed data on that question are not presented in the report. Of those graduates whose college matriculation was always less certain, however, many could well have chosen to forego the effort due to a myriad of pandemic concerns.
These findings furnish just a snapshot of the behavior of public school graduates in one state and thus may have limited generalizability. But the authors assert that California policymakers’ responses to Covid disruptions may be of wider interest. They note that the Golden State has recently passed legislation requiring all high school seniors to submit a FAFSA, expanding financial aid entitlement programs, and further increasing resources for community colleges (beyond federal aid)—all efforts to help institutions recover from the pandemic. The data indicate these are well-targeted investments…if recouping lost enrollment is the main goal. But the pandemic may have permanently altered who is going to college, what they are looking for from postsecondary education, and whether their future goals can be achieved by faster and cheaper non-institutional means such as apprenticeships or on-the-job training.
SOURCE: Scott Carrell et al., “College Canceled: What Happened to California’s High School Graduating Class of 2020?,” Educational Researcher (September 2025).

In 2023, through an amendment tucked into the biennial budget, Ohio lawmakers threw in the towel on state efforts to improve Lorain City Schools. They did so by dissolving the academic distress commission (ADC) that had overseen the 6,000-student district since 2013. The commission, along with its appointed chief executive officer, had been tasked with leading a districtwide turnaround. But after relentless complaints from district officials and unending drama between the ADC and the school board, lawmakers decided to walk back the accountability measure and return Lorain to local control.
The move set off celebrations among officials who had bristled under state oversight. Mark Ballard, a Lorain school board member, compared it to a national holiday: “It’s Independence Day. It’s the Fourth of July, but it’s independence for Lorain City Schools.” Superintendent Jeff Graham told the press that getting out of state supervision had been a “long road” and vowed that the district would “continue improving.”
Has the district improved in the wake of ADC dissolution? The short answer: An emphatic “no.” But don’t just take my word for it, take a look at Lorain’s 2024–25 report card.
Student achievement
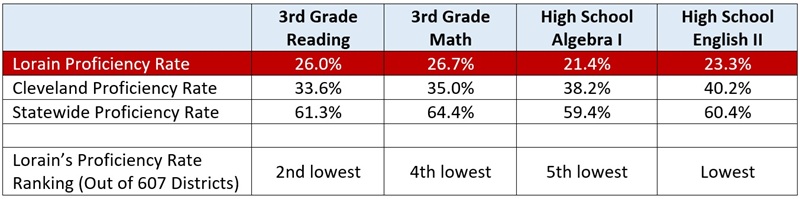
Starting with measures of achievement on state exams, we discover that just a quarter of Lorain students currently achieve proficiency in reading or math. These rates lag far behind the statewide average, and even fall noticeably short of proficiency rates in Cleveland, another nearby district that has struggled with low pupil achievement. In third grade reading, for instance, just 26 percent of Lorain students achieved proficiency, while 34 percent of Cleveland students reached this mark (and 61 percent did so statewide). As indicated in Table 1, Lorain’s proficiency rates in third grade and high school math and reading fall near, or at the very bottom, among all 607 of Ohio’s school districts.
Table 1: Lorain proficiency rates on selected state exams, 2024–25
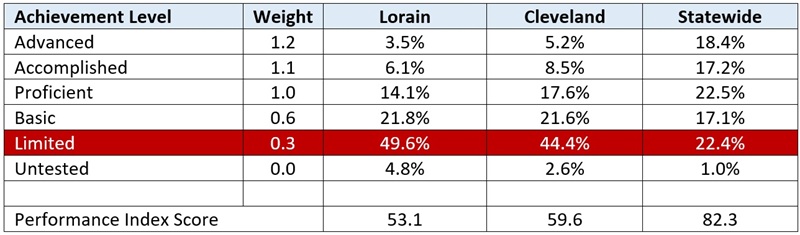
To gauge overall achievement, we turn to the state’s performance index, a composite measure across all state exams and one that awards more credit when students score at higher levels. Table 2 shows Lorain’s performance index score and the data underlying it. Here, we observe that a staggering half of Lorain students score at the lowest possible achievement level known as “limited.” On the other side of the spectrum, just one in ten Lorain students score in the advanced or accomplished categories, signifying they are on pace for college and career readiness. We also notice a somewhat large portion of untested students in Lorain (4.8 percent) compared to Cleveland and the state overall. This suggests problems with student engagement, an issue we’ll come back to in a moment. In total, Lorain’s performance index score was 53.1, more than six points below Cleveland and almost 30 points below the statewide average.
Table 2: Lorain’s performance index versus Cleveland and statewide, 2024–25
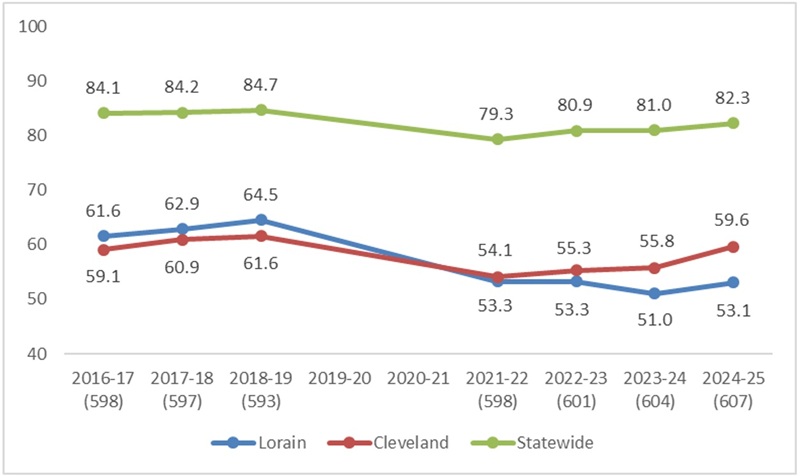
Perhaps these grim point-in-time statistics mask improving student achievement, albeit against an extremely low baseline. Yet Figure 1 reveals virtually no improvement over the past few years. Just prior to the pandemic—when Lorain was under ADC oversight—district scores were ticking upward, and its statewide ranking on the performance index was trending in the right direction. The pandemic took an immense toll on achievement statewide and in Lorain. But while performance index scores have recovered somewhat statewide and in Cleveland, they remain depressed in Lorain. In 2024–25, the district’s performance index score was no better than it was in 2021–22, and Lorain’s score now ranks dead last among all Ohio districts.
Figure 1: Performance index trend, Lorain versus statewide
Student academic growth
A more precise look at student learning over time comes via the state’s “value-added” measure (a.k.a. Progress ratings). This measure tracks pupil achievement gains (or losses) relative to similarly scoring peers, a statistical methodology that helps control for the influence of demographics on test scores and zeroes in on schools’ effectiveness.
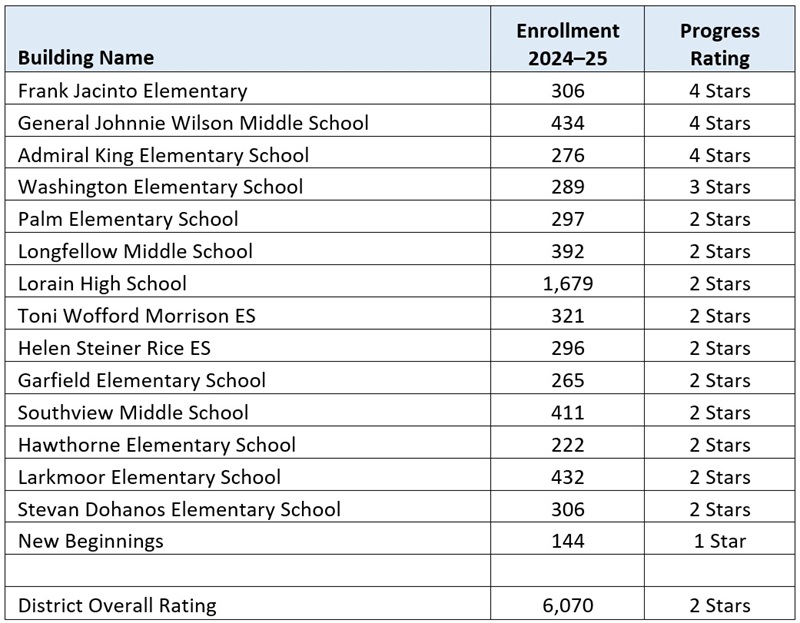
On this measure, Lorain lagged, as well. As Table 3 shows, only three Lorain schools received a four-star Progress rating, and none received five stars. Instead, a large majority of Lorain students are stuck in mediocre two-star schools where students are falling even further behind their peers. The districtwide two-star rating confirms the sluggish overall student growth across most of its schools.
Table 3: Lorain school districts’ Progress ratings, 2024–25
Student attendance
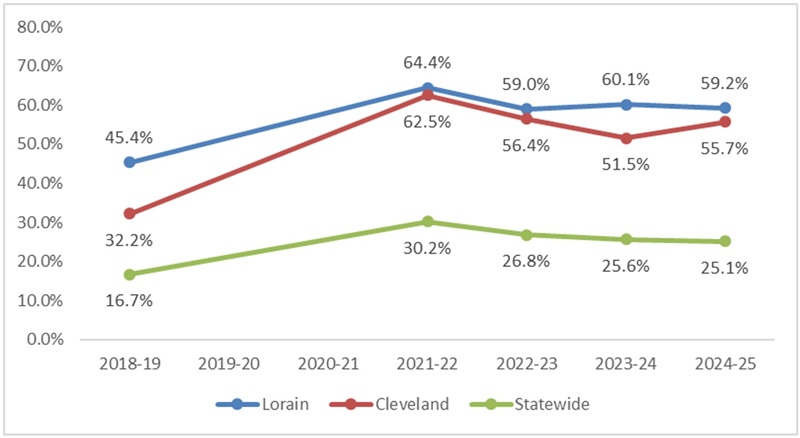
While not a direct measure of achievement, attendance correlates to improved learning outcomes and is an important proxy for student engagement. Given Lorain’s abysmal proficiency rates, one might expect the district to be aggressively promoting attendance to drive achievement. Is that happening? If it is, it’s not showing up in the data. Figure 2 reveals staggering rates of chronic absenteeism in Lorain, which are more than double the state average and exceed Cleveland’s rate. In fact, Lorain’s 59 percent chronic absenteeism rate is the highest of all districts statewide. Yikes.
Figure 2: Chronic absenteeism in Loran versus Cleveland and statewide
Graduation and post-secondary readiness
Consistent with ballooning graduation rates statewide, Lorain posted a seemingly impressive 80 percent four-year graduation rate, the highest number on record over the past decade. The district also received a three-star rating for readying graduates for college and career. But what does post-secondary readiness really look like in Lorain? Digging deeper into the data, we discover few students meeting college-ready targets, a consequence of the abysmal math and reading proficiency rates seen well before twelfth grade. Just 3 percent of Lorain’s class of 2024 reach the college-remediation free standard on the ACT/SAT. No students passed an AP exam, or even took a course, though 13 percent did earn dual-enrollment credits.
How did Lorain graduate four in five students and earn that three-star rating? Mostly through career-tech indicators: 39 percent of students in Lorain’s class of 2024 earned industry credentials and 32 percent passed career-tech assessments. These numbers—up significantly from the year prior—mirror those from other low-achieving districts, such as Cleveland and Youngstown, that have reported rapidly increasing numbers of students completing these measures. The rise comes in response to new graduation requirements that provide struggling students with a career-tech alternative, as well as the report card rating.[1]
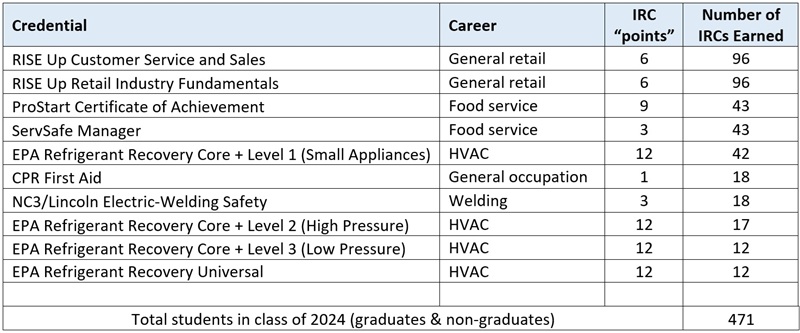
But are the industry credentials that Lorain students attain any good? Table 4 shows the most commonly earned credentials for its class of 2024. At the top of the list are a pair of retail and food-service certificates, which are unlikely to open doors to higher-paying occupations. More promising news comes further down the list, where we find some Lorain students earning refrigerant certifications, which could lead to more solid-paying, technically-skilled HVAC jobs.
Table 4: Industry credentials earned in Lorain City Schools, class of 2024
In sum, the post-secondary readiness of Lorain students is less rosy than its graduation rate or three-star college-and-career-ready rating might suggest. By my estimation, roughly one in four Lorain students in the class of 2024 graduated ready for life after high school by achieving college-ready indicators or earning high-value credentials. Lacking solid academic preparation or valuable technical credentials, what will happen to the remaining Lorain students?
***
Ohio lawmakers solved a political problem by abolishing the ADC and letting Lorain City Schools off the accountability hook. Yet by backing down when the going got tough, they did nothing to help solve the real problems plaguing the district, including woeful academic performance, rampant absenteeism, and graduates who are unprepared for the real world. Instead, the available data suggest that the district has gone in the wrong direction ever since the state cut and ran. Maybe Lorain administrators will get it together and turn the district around all on their own. Or, more likely, that’s just wishful thinking, and lawmakers—perhaps under leadership from a new governor—will have to find the courage to help the students of Lorain get on the right track.
[1] Schools receive credit toward their college and career readiness rating when students meet one of eleven indicators of readiness (including credentials and technical exams). Lorain received a one-star bump (from two to three stars) for its college-and-career-ready rating based on increasing numbers of students meeting the career-tech measures.