’Tis the season: Schools across Ohio are opening their doors to welcome back students for a brand-new academic year. As in years past, teachers and administrators will be responsible for educating an increasingly diverse group of students, including more students with disabilities than ever before. Not only will schools need to provide the services outlined in these students’ Individualized Education Programs (IEPs), they will also need to address the lingering impacts of the pandemic.
To ensure that schools are meeting the needs of Ohio’s hundreds of thousands of students with disabilities, state and local leaders, lawmakers, and families need access to accurate and detailed information. With that in mind, let’s take a closer look at some of the data that are currently available.
Enrollment
Chart 1 shows the number of students with disabilities who have enrolled in Ohio public schools[1] since 2016. During 2023, the most recent year of available data, more than a quarter million public school students were identified as students with disabilities. They made up more than 16 percent of all public school students in Ohio.
Chart 1: Enrollment numbers for students with disabilities in Ohio’s public schools
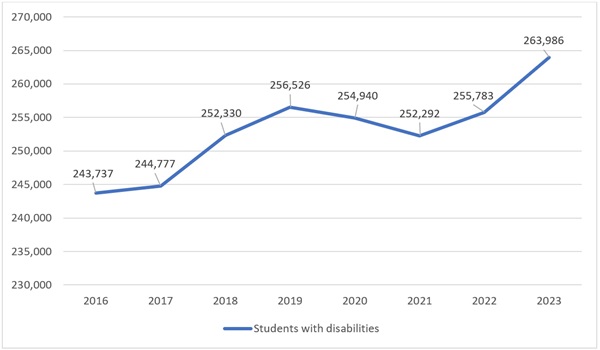
The significant jump in enrollment between 2021 and 2023 could be explained by several factors. Some families held off on enrolling their students in kindergarten because of Covid, either choosing to homeschool or to delay enrollment for a year (children aren’t legally required to begin school until they’re six, which gave parents of five-year-olds the option to wait). Meanwhile, remote learning may have made it more difficult for schools to identify students who were in need of special education services. It makes sense that once schools returned to in-person classes, the number of special education students would increase—thereby continuing the upward trend established prior to the pandemic.
Private schools have also seen a significant bump in the number of students with disabilities, perhaps in part because of remote learning. During the height of the pandemic, districts reported that complying with the Individuals with Disabilities Education Act (IDEA) and providing support to students with disabilities was substantially more difficult than before. Families tried to “have grace” for schools but were often left frustrated by the turmoil and struggling to cope with considerable challenges, including a lack of in-person services and support for their children. For many, private schools—which were more likely to offer in-person instruction than public district or charter schools—became a lifeline.
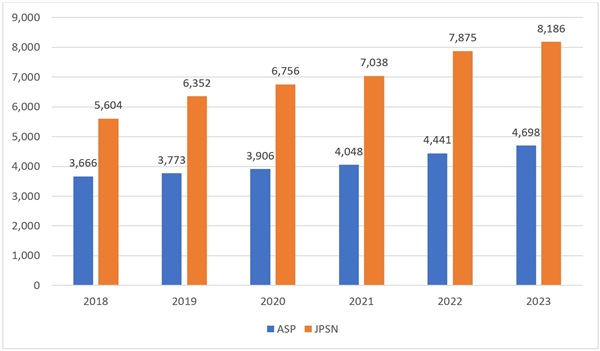
In Ohio, there are data indicating that an increasing number of families did, in fact, choose to enroll in private schools. Chart 2 shows the number of students participating in Ohio’s Autism Scholarship Program (ASP) and the Jon Peterson Special Needs (JPSN) Scholarship Program. Both allow families to use state-funded scholarships[2] to send children with special needs to education programs other than the one operated by their resident district. JPSN saw the biggest increase in enrollment, with more than 2,500 additional participants in 2023 than 2018. ASP participation also increased, though by fewer students, likely because a broader range of students are eligible for JPSN than for ASP.
Chart 2: Participation in Ohio’s voucher programs for students with special needs
Academic outcomes
Like the rest of the nation, academic achievement in Ohio suffered during the pandemic. For the most part, test scores are rebounding. But that rebound is much less robust for students with disabilities. Consider charts 3 and 4, which show the percentage of students with disabilities who were proficient on state exams in English language arts and math compared to the same results for all students. These data, and those that follow, are for public school students (including those in charter schools).
Chart 3: Percent proficient on state exams in ELA, grades 3–8
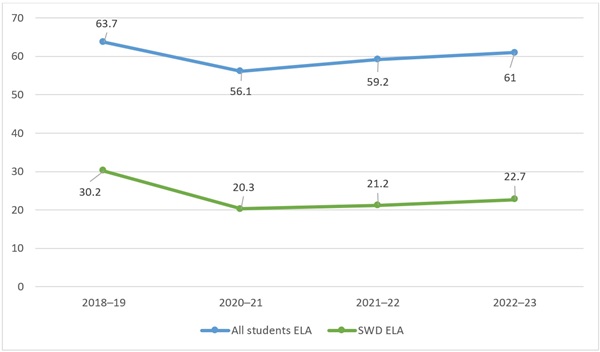
Chart 4: Percent proficient on state exams in math, grades 3–8
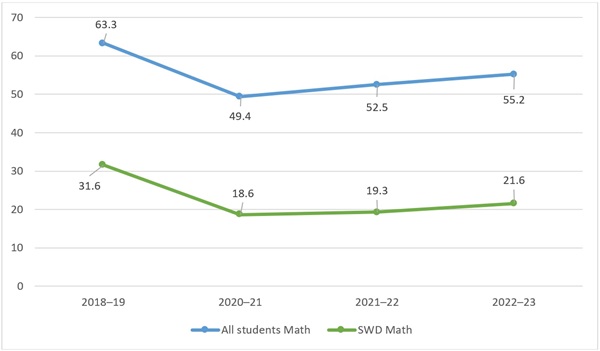
Statewide, achievement in ELA has almost returned to pre-pandemic levels. There’s still plenty of work to do in math to catch students up, but scores are steadily increasing from pandemic-era lows. For students with disabilities, however, the picture isn’t as rosy. In both subjects, achievement remains nearly 10 percentage points lower than it was prior to the pandemic.
Meanwhile, although students with disabilities are struggling to recover the academic ground they lost during the pandemic, graduation rates have not declined. In fact, they’ve increased. The table below identifies the four-year longitudinal graduation rate for students with disabilities, students without disabilities, and all students. Across all groups, and despite persistent learning loss, graduation rates have ticked upward.
Table 1: Four-year longitudinal graduation rates for Ohio students

Going forward
This year and for the foreseeable future, Ohio schools need to prioritize ensuring that their students with disabilities are catching up from pandemic learning loss. But there are two roadblocks that could stand in their way.
The first is chronic absenteeism, which is defined as missing at least 10 percent of instructional time. Not only does chronic absenteeism negatively impact both academic and social-emotional development, it’s also made pandemic recovery more difficult. Chart 4 shows the statewide chronic absenteeism rate compared to the rate for students with disabilities. Rates for both groups dipped during the first pandemic-impacted school year and then skyrocketed during the following two. The numbers slightly improved last year—which is good news—but they still haven’t returned to pre-Covid levels. And among students with disabilities, chronic absenteeism rates are even higher than the statewide average. More than a third of students with disabilities were chronically absent during the 2022–23 school year.
Chart 5: Chronic absenteeism rates in Ohio
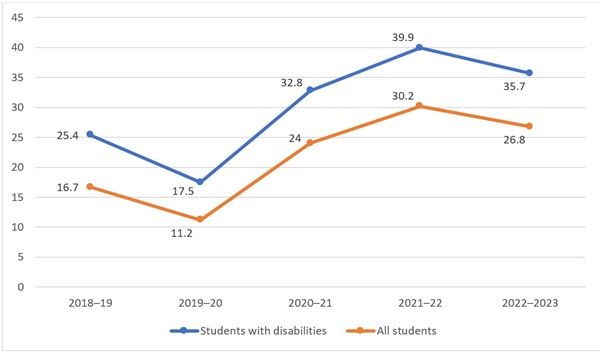
It’s important to recognize that for students with disabilities, attending school regularly can be far more difficult than it is for their peers. Chronic health conditions, side effects from medication, social issues like bullying, and attending necessary doctor or therapy appointments can all play a role in contributing to chronic absenteeism. A global pandemic likely exacerbated many of these issues for Ohio families. Going forward, it’s crucial for school staff to work closely with families to improve attendance while also recognizing extenuating circumstances.
The second roadblock is teacher shortages. Staff vacancies data collected by the National Center for Education Statistics (NCES) in March 2024 show that 51 percent of public schools nationwide reported that they would need to fill positions in special education before the start of the next school year. That’s up from 46 percent in June 2022. No other category of teaching is more in demand.
It’s difficult to get a handle on special education teacher shortages in Ohio. The NCES data are disaggregated by region, rather than at the state level, and Ohio doesn’t collect or publish data on teacher vacancies. (That needs to change, and soon.) But based on the data that are available for Ohio, special education is a likely shortage area, especially as the number of special education students rises.
***
The pandemic has impacted all students. But for Ohio’s growing number of students with disabilities, those impacts are lingering longer. Issues including chronic absenteeism and teacher shortages could make academic recovery more difficult. The upcoming release of state report cards will shed additional light on how students are progressing. But for now, schools should be laser-focused on meeting the needs of their students with disabilities.
[1] Public school enrollment includes traditional district, public charter, and independent STEM school students. It does not include students attending joint-vocational districts, educational service centers, non-public schools, or home-schooled students.
[2] The maximum scholarship amount for ASP for FY25 is $32,445. For JPSN, the amount of each scholarship is based on students’ Evaluation Team Report. For FY25, the maximum scholarship amounts ranges from $9,585 for speech or language impairment to $32,445 for autism, a traumatic brain injury, or students who are hearing and vision impaired.


