
Mobile Navigation

  • National
    • Policy
      • High Expectations
      • Quality Choices
      • Personalized Pathways
    • Research
    • Commentary
      • Gadfly Newsletter
      • Flypaper Blog
      • Events
    • Scholars Program
  • Ohio
    • Policy
      • Priorities
      • Media & Testimony
    • Research
    • Commentary
      • Ohio Education Gadfly Biweekly
      • Ohio Gadfly Daily
  • Charter Authorizing
    • Application
    • Sponsored Schools
    • Resources
    • Our Work in Dayton
  • About
    • Mission
    • Board
    • Staff
    • Career
Home
Home
Advancing Educational Excellence

Main Navigation

  • National
  • Ohio
  • Charter Authorizing
  • About

National Menu

  • Topics
    • Accountability & Testing
    • Career & Technical Education
    • Charter Schools
    • Curriculum & Instruction
    • ESSA
    • Evidence-Based Learning
    • Facilities
    • Governance
    • High Achievers
    • Personalized Learning
    • Private School Choice
    • School Finance
    • Standards
    • Teachers & School Leaders
  • Research
  • Commentary
    • Gadfly Newsletter
    • Flypaper Blog
    • Gadfly Podcast
    • Events
  • Scholars Program

The Education Gadfly Weekly

Sign Up to Receive Fordham Updates

We'll send you quality research, commentary, analysis, and news on the education issues you care about.
Thank you for signing up!
Please check your email to confirm the subscription.

The Education Gadfly Weekly: Charter school achievement in D.C. was decimated by the pandemic. Here’s what we can learn from that.

Volume 22, Number 39
9.22.2022
9.22.2022

The Education Gadfly Weekly: Charter school achievement in D.C. was decimated by the pandemic. Here’s what we can learn from that.

Volume 22, Number 39
view
Quality Choices

Charter school achievement in D.C. was decimated by the pandemic. Here’s what we can learn from that.

Nine percent. That’s how many Black boys met expectations in math in D.C.’s traditional public schools in 2022, down from 17 percent before the pandemic. It’s also how many met those expectation in the city’s charter schools, down from 22 percent. The word “disaster” is used a lot lately, but it is absolutely the right fit here. There are, however, lessons we can learn from this catastrophe.

Marc Porter Magee 9.22.2022
NationalFlypaper

Charter school achievement in D.C. was decimated by the pandemic. Here’s what we can learn from that.

Marc Porter Magee
9.22.2022
Flypaper

A pandemic back-to-school reminder: Friendships count

Bruno V. Manno
9.22.2022
Flypaper

High-quality schooling is a necessary component of economic growth, according to 60 years of international test data

Harry Anthony Patrinos
9.22.2022
Flypaper

Which factors best predict classroom placements of students with disabilities?

Amber M. Northern, Ph.D.
9.22.2022
Flypaper

Post-pandemic patterns indicate too little access to grade-level work

Jeff Murray
9.20.2022
Ohio Gadfly Daily

Education Gadfly Show #838: Was the charter sector too slow to reopen schools for in-person learning?

9.21.2022
Podcast

Cheers and Jeers: September 22, 2022

The Education Gadfly
9.22.2022
Flypaper

What we're reading this week: September 22, 2022

The Education Gadfly
9.22.2022
Flypaper
view

A pandemic back-to-school reminder: Friendships count

Bruno V. Manno 9.22.2022
Flypaper
view

High-quality schooling is a necessary component of economic growth, according to 60 years of international test data

Harry Anthony Patrinos 9.22.2022
Flypaper
view

Which factors best predict classroom placements of students with disabilities?

Amber M. Northern, Ph.D. 9.22.2022
Flypaper
view
TNTP Grade level work report SR image

Post-pandemic patterns indicate too little access to grade-level work

Jeff Murray 9.20.2022
Ohio Gadfly Daily
view
iStock / Getty Images Plus/ djedzura

Education Gadfly Show #838: Was the charter sector too slow to reopen schools for in-person learning?

Michael J. Petrilli, David Griffith, M. Karega Rausch, Amber M. Northern, Ph.D. 9.21.2022
Podcast
view

Cheers and Jeers: September 22, 2022

The Education Gadfly 9.22.2022
Flypaper
view

What we're reading this week: September 22, 2022

The Education Gadfly 9.22.2022
Flypaper
view

Charter school achievement in D.C. was decimated by the pandemic. Here’s what we can learn from that.

Marc Porter Magee
9.22.2022
Flypaper

While the NAEP results released earlier this month told us a lot about how students fared nationally, a new round of state tests is much closer to home. That makes it harder to talk about because these results are connected to individual decisions that leaders made during the Covid-19 crisis, as well as the children in specific communities we know and love.

These data shouldn’t be used as a hammer to punish decisions made in a difficult moment in time when our public health officials struggled to provide clear guidance to schools and prevent fear from overwhelming the facts. It can and should be used as a flashlight to help illuminate why student achievement dropped where it did and what it will take to get it back. Transparency is a core value of education reform that we need now more than ever.

In Washington, D.C., for example, one figure stands out: 9 percent. That’s how many Black boys met expectations in math on the recently released 2022 student achievement results in the city’s district schools. On the eve of the pandemic in 2019, 17 percent of Black boys in district schools met those same expectations. The word “disaster” is used a lot lately, but it is absolutely the right fit here.

But what about the other half of D.C.’s schools, the charter sector? Sadly, 9 percent is also the percentage of Black boys in D.C. charter schools who met math expectations in 2022. That’s down from 22 percent in 2019, an even sharper decline than in Washington’s district-operated schools.

The charter school sector in D.C., which has achieved so much success over the past decade, seems to have had a particularly difficult transition to an all-virtual environment. This shouldn’t be a total surprise, considering that virtual charter schools across the country have displayed weak results over the years. As 50CAN, of which I’m CEO and founder, wrote in our joint 2016 report with the National Alliance for Public Charter Schools and the National Association of Charter School Authorizers, “at the same time that full-time virtual charter public schools have seen significant growth, far too many have experienced notable problems... The well-documented, disturbingly low performance by too many full-time virtual charter public schools should serve as a call to action.”

Now that D.C. charter schools are back in person, they will need all the effort they can muster—and all the support we can provide—to help their students get back on track.

Indeed, a review of school-level data suggests that student achievement in some of D.C.’s most prominent charter schools dropped by previously unimaginable amounts. For example, four KIPP elementary schools that in 2019 led the D.C. charter sector in performance—and served as national models of excellence for schools around the nation—saw their percentage of students meeting math expectations drop 40 points or more. So the situation is grim, but D.C. should be commended for providing an honest accounting of where students stand.

So, what can we learn from these results?

The primary lessons from D.C. are the same ones that leaders will likely draw from most cities nationwide. As discussed below, the evidence increasingly points toward extended school closures as the biggest driver of the huge drops in student achievement we are seeing in district schools and charter schools on nearly every test—not only in D.C., but also across the country. Or as Mike Bloomberg put it in a recent Washington Post op-ed on the nationwide drop in student achievement: “Blame for these dismal results lies mostly with poorly designed and implemented remote instruction programs that stretched on far too long—and long after vaccines became available.” Bloomberg makes the case for funding “deeper and more aggressive interventions,” including in-person learning opportunities during the summer, after school, and on weekends.

Another core value of education reform is parental choice, and it’s worth exploring the challenges we experienced in trying to uphold this value in a time of crisis.

Polling in summer 2020 showed that about half of all families weren’t comfortable sending their children back to in-person learning for the start of the 2020–21 school year, with the other half wanting in-person learning or unsure what they wanted, which no doubt greatly complicated the reopening decisions of all schools. Yet it’s worth remembering that the decision facing school and district leaders at that time wasn’t whether to force all families into in-person learning or all families into virtual learning, but instead whether schools should provide all families with an option of in-person learning.

As Derrell Bradford and I argued in USA Today in August 2020, given the stakes involved, we couldn’t afford a one-size-fits-all mindset. Instead, every parent in America deserved the right to choose not just between district and charter schools, but between in-person and virtual learning for their children—and D.C. charters didn’t give families that choice.

If we ever face another health crisis that threatens to shut down schools, it will be wise to look to the example of America’s Catholic schools. Nationally, 92 percent of Catholic schools made the decision to offer their families the choice of sending their children back to their school buildings or continuing with a virtual option. That compares to only 43 percent of America’s district schools and just 34 percent of charter schools that gave their families the same choice.

We will never know exactly how many families would have chosen that in-person option if offered one, but the experience of urban Catholic schools that serve students from the same neighborhoods as charter and district schools suggests that once the option was made available, a large percentage of families likely would have chosen to send their children back to school. Steady leadership in a crisis can make all the difference.

With everything we have learned, where should we go from here? Now, more than ever, we need to put kids’ needs first. That means designating schools as essential services so that we never find ourselves in a situation where we close schools while keeping bars and restaurants open. It means investing in funding systems that provide families with the resources they need to choose in-person summer camps, tutoring, and after-school programs to help their kids catch back up.

Given the enormous gaps we need to fill, we should also make room in these investments for new programs and new approaches and quickly and rigorously assess their effectiveness. We should also explore ways to help families move across school sectors and school boundaries, particularly in moments of crisis when their needs aren’t being met.

Most of all, we need to continue to invest in objective data on student achievement and insist on keeping our expectations high even when we fall short.

Editor’s note: This essay was adapted from an edition of 50CAN’s “The New Reality Roundup.”

view

A pandemic back-to-school reminder: Friendships count

Bruno V. Manno
9.22.2022
Flypaper

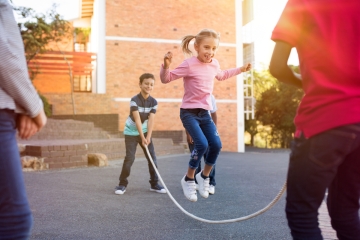
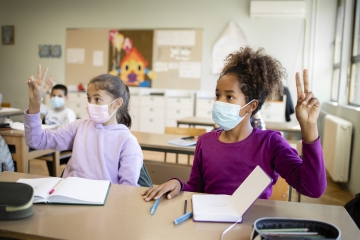
The school and college lockdowns that came with the pandemic brought formal education’s friend-making and relationship-sustaining roles front and center in a way few could have imagined. School-based friendships and other personal relationships—a form of social capital—help prepare young people to pursue opportunity and human flourishing. As young people return to schools and colleges for in-person learning, parents, educators, and policymakers should reflect on the importance of these social connections.

A massive new study by Harvard economist Raj Chetty and nearly two dozen colleagues published in the journal Nature provides ample food for thought on the importance of social relationships, including suggestions on how schools and colleges can foster them. It shows that economic connectedness, or the number of friendships between lower- and higher-income individuals, is a strong predictor of a community’s ability to support young people’s upward mobility in the income distribution. All this is especially relevant as young people return to the classroom.

The study examines 21 billion Facebook friendships based on data covering 84 percent of U.S. adults aged twenty-five to forty-four. The result is a detailed analysis of how friendships influence economic mobility, as well as a website where entering a zip code, high school, or college shows how common cross-class friendships are in those places. The analysis focuses on three forms of social capital—economic connectedness: the degree to which low- and high-income people interact with each other and become friends; social cohesion: the degree to which communities and social networks are tight knit; and civic engagement: how often individuals volunteer for community activities.

Economic connectedness

The study finds that economic connectedness, or the number of cross-class friendships, is the strongest available predictor of a community’s ability to foster upward income mobility—even stronger than other measures like school quality, job availability, family structure, or a community’s racial makeup. For example, if low-income children grow up in counties with similar economic connectedness to the typical child with high-income parents, their future income increases on average by 20 percent, equivalent to the effect of attending two or so years of college. It’s not necessarily the friendships in and of themselves that do this. They more likely have what Chetty calls a “downstream effect,” shaping our aspirations and changing our behavior.

Furthermore, this relationship between economic connectedness and upward mobility is independent of the place’s affluence or poverty. For example, outcomes for poor children are better, even in poorer zip codes, where poor people have more rich friends. The research team concludes that “Areas with higher economic connectedness have large positive causal effects on children’s prospects for upward mobility.”

How social bonds are formed varies by income and setting. For example, the affluent tend to make more friends in college; low-income individuals make more friends in their neighborhoods; middle-class individuals do so at work. In many cases, these tendencies work to limit cross-class friendships.

Differences across settings in the number of cross-class friendships low-income individuals develop stem from a roughly 50/50 blend of two factors. The first is simply the exposure to higher-income individuals that occurs in different settings and institutions that connect people, like schools, work, or religious organizations. But mere exposure is often not enough. Equally important is the extent to which the setting or institution reduces friending bias, or our tendency to develop stronger relationships with people of the same background. The rate at which lower-income individuals go beyond exposure to engagement and friendship with higher-income individuals varies across settings and institutions, suggesting interactions are encouraged or discouraged by how a setting is structured and an institution functions. For example, academic tracking within schools produces higher friending bias and limits cross-class friendships even in schools that are socioeconomically diverse.

In short: Exposure + Engagement = Economic Connectedness

Friending places: A personal detour

On a personal level, as I look back on growing up in Cleveland, Ohio, during the late 1950s and early 1960s, there were three places where my cross-class friendships took root and developed. One was the local YMCA—where friendships started to build around age ten, especially at its two-week away-from-home summer camp. Back then, it was unusual for someone like me who attended a Catholic elementary school to participate in the Y’s activities rather than those of the Catholic Youth Organization, or CYO. But mom and dad (both high school graduates but with no college degrees) thought it would be good to be with kids I didn’t know. It sounded good to me. Another place involved my late elementary and high school years as a youth volunteer and school delegate at the Northeast Ohio Red Cross headquarters in downtown Cleveland. The third place was the high school I attended, St. Joseph Catholic High School on Cleveland’s far east side.

At all three places, I met (and, during summer camp, lived with) young people and adults from five counties across Northeast Ohio. They had different racial and ethnic backgrounds and income levels. The camp counselors and staff included laborers, teachers, coaches, nonprofit leaders, lawyers, and doctors. I made cross-class friendships with many of these young people and adults. The range of friendships I developed opened my eyes to personal and vocational possibilities I never would have imagined if I had stayed in my cheerful but small Italian American neighborhood. I cherish these memories and remain friends today with some of the young people I met back then.

Friending places: The study

The study explores six places where we make friends or, as Chetty puts it, settings and institutions that can bring opportunity to people: high school, college, religious groups, recreational groups, workplaces, and neighborhoods. Religious institutions are especially strong settings for increasing exposure and reducing friending bias, with recreational groups and the workplace also important.

High schools have various levels of exposure and friending bias, even among nearby schools with similar socioeconomic makeup. For example, large high schools generally exhibit a smaller share of cross-class connections—or, worse, friending bias—as they have less mixing and more income-related cliques. So do more racially diverse schools and those with high Advanced Placement enrollment and gifted and talented classes. On the other hand, smaller and less racially diverse high schools have more friendships between students with different class backgrounds. Greater racial diversity and higher enrollment are associated with worse friending bias across colleges, as well.

Friending bias can be overcome. For example, large high schools can assign students to smaller and intentionally diverse “houses” or “hives.” Their cafeterias, libraries, and science labs can be organized to mix students when they socialize or learn. Extracurricular activities can be structured to blend students from diverse backgrounds.

Charter schools are another contrast. Using the study’s public data, my colleague Jeff Dean analyzed the 214 charter high schools in the database. On average, these charter schools perform better than 80 percent of traditional public schools on friending bias, raising questions to research. For example, do the autonomy, community-building, and institutional aspects of public charter schools contribute to this? Or can their results be explained simply by their smaller size?

Friendships’ power

This analysis is consistent with what experts have learned about two types of social capital. Bonding social capital grows in like-minded groups, while bridging social capital grows in groups that are mixed racially, professionally, socioeconomically, or in other ways. Social scientist Xavier de Souza Briggs observes that bonding social capital is for “getting by,” while bridging social capital is for “getting ahead.”

These forms of social capital create strong and weak ties, important to our social networking and ability to collect information about different opportunities we might have. Strong ties are friends who are mostly like us. They know the same places, information networks, and opportunities as we do. Weak ties are acquaintances we know but who are different from us. They are likely to connect us to new networks and opportunities. They are valuable when we’re looking for a new job since they provide us with connections and information we wouldn’t get through our usual networks.

Over time, this combination of new connections and information can have a powerful effect. For example, the researchers’ analysis shows that young people who move out of concentrated poverty and into an economically diverse neighborhood at an early age tend to do better economically and socially than those who move in at a later age. Chetty calls this a “dosage effect”—i.e., a greater dosage over time produces a greater effect.

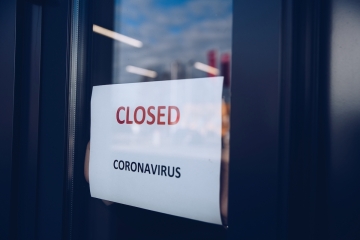
Closing schools, virtual learning, and the like during the heyday of the pandemic was a severe blow to the development of friendships in general and the types of cross-class friendships in particular that are crucial to a young person’s longer-term upward mobility and human flourishing.

As the Better Midler 1973 hit song says, “…you got to have friends.”

And we need to be exposed to and engaged with them across classes in diverse groups and institutional settings.

So as our young people return to school and college this fall, this research reminds us of the importance of cross-class friendships, social networks, and other personal connections to students’ success in both school and life.

That’s a welcome pandemic recovery back-to-school message.

Editor’s note: This was first published by Education Next.

view

High-quality schooling is a necessary component of economic growth, according to 60 years of international test data

Harry Anthony Patrinos
9.22.2022
Flypaper

International student assessments are commonplace today, though none existed before 1965, and few countries participated at the outset. Seven countries have participated in international assessments for almost sixty years—Australia, Finland, France, Germany, Japan, Netherlands, and the United States—and one of the lessons we learn from them is that education is correlated with economic growth. As schooling levels and academic achievement rose, so did national income.

We see in Figure 1, for example, that this in the case of Finland, Japan, and the United States.

Figure 1. Years of schooling and real income per capita for Finland, Japan, and the U.S., 1980 and 2010

h1

Source: Barro, R. and J.-W. Lee. 2013. “A New Data Set of Educational Attainment in the World, 1950-2010.” Journal of Development Economics 104: 184-198.

One of the likely reasons for this correlation is that economic growth and development considerations mattered deeply for many of these countries. Finland was a middle-income country at the outset. Germany and Japan were in a post-war boom; and then Germany had to reintegrate its Eastern part. These economies needed a skilled workforce to grow.

Therefore, policies to expand skills were undertaken. This caused, among other things, schooling levels to double between 1950 and 2010, according to the same research on which Figure 1 is based. On average, they rose from six to twelve years. Over this period, schooling levels almost doubled in Finland and France. Average years of schooling for all seven countries increased, and at the same time, the differences among them narrowed. Finland expanded the fastest with a focus on access and equity, starting with comprehensive schooling reforms in the 1960s and 1970s that included a gradual transition to a common, unified, compulsory curriculum, with track selection postponed to age fifteen or sixteen. This coincided with the expansion of secondary schooling in the late 1980s. Moreover, the disparity between countries in terms of schooling decreased. Schooling levels have become much more equal across them.

The results were significant, as Figure 2 shows, with the rate of return to investment in education—meaning the costs and benefits both for individual students and for each country as a whole—uniformly high in the seven countries. This can be interpreted as a rise in the demand for skills and a supply source unable to match it. In 1960, the returns on investment range from 10.4 percent in France to 14.0 percent in Australia. As schooling expanded, the returns slowly declined, consistent with economic theory. By 1995, the average returns to schooling were just 7.5 percent. However, those returns begin to rise in the 1990s and remained high into the 2000s, reaching 11.5 percent in 2010.

Figure 2. Average returns to schooling for Australia, Finland, France, Germany, Japan, Netherlands, and the U.S., 1960–2010

h2

Source: Montenegro, C.E. and Patrinos, H.A., 2021. A data set of comparable estimates of the private rate of return to schooling in the world, 1970–2014. International Journal of Manpower; Psacharopoulos, G. and H. Patrinos. 2018. Returns to investment in education: a decennial review of the global literature. Education Economics 26(5): 445-458.

While high returns despite high levels of schooling suggest growing inequality, they also point to demand for skills. Employers value education and are willing to pay for it. The countries examined here valued education and expanded it, and—for a considerable time—improved its quality. The quality of schooling and its expansion raised incomes, reflected in national economic growth and high personal returns.

In terms of national income growth, the impact of schooling is significant and large. As Table 1 shows, applying a simple regression model using panel data on the seven countries yields significant coefficients for schooling. On its own, years of schooling has a large, positive effect on GDP per capita over time. When estimating the effect of a measure of school quality—the harmonized learning outcomes (HLO) score (see a fuller definition here)—the effect is even larger. When observing both at the same time, it appears that quantity and quality of schooling matter to a large extent, but that quality matters more. In panel data estimates, schooling is statistically significant even when the regression analysis accounts for the accumulation of physical capital. Moreover, the estimated return to investments in schooling is consistent with those reported in labor studies or other macro analyses.

Table 1. Income level panel estimates: Dependent variable Log GDP per capita, 7 countries, 76 observations, sample period 1965–2015

h t1

Notes: Includes country fixed effects but not reported; t-statistics in parentheses. Capital per worker from Feenstra, R.C., R. Inklaar and M.P. Timmer. 2015. “The Next Generation of the Penn World Table.” American Economic Review 105(10): 3150-3182. * Variables signification at 5 percent level.

After 2005, however, scores started to diverge. The difference today is almost as high as it was in 1965. Raising schooling levels and sustaining the quality of education are not the same. Long-term convergence in quality is difficult to sustain. Japan is the only country that managed to improve consistently and maintain high learning outcomes since 1965, as Figure 3 shows.

Figure 3. Learning outcomes for Australia, Finland, France, Germany, Japan, Netherlands, and the U.S., harmonized average of reading, math and science scores, 1960–2010

h3

Source: Altinok, N., N. Angrist and H.A. Patrinos 2018. “Global data set on education quality (1965-2015).” World Bank Policy Research Working Paper No. 8314.

Nevertheless, schooling is of high quality in these countries compared to the rest of the world. The fact that quality matters in such countries shows just how important skills are for development. These high-performing, high-income countries focused on schooling to generate resources, and these efforts were correlated with significant returns. In other words, schooling, especially the quality of schooling, is a necessary component of economic growth.

view

Which factors best predict classroom placements of students with disabilities?

Amber M. Northern, Ph.D.
9.22.2022
Flypaper

A recent study from the Journal of Learning Disabilities sheds light on the vitally important question of which students with disabilities (SWDs) are placed primarily outside of general education classrooms. Specifically, analysts seek to document the level of racial or ethnic disparities in placement and whether those disparities are explained by bias or other factors.

Led by Paul Morgan from Pennsylvania State University, the team uses two waves of federal data from ECLS K 1998 and ECLS K 2011 that track a nationally representative sample of kindergarteners through the fifth or eighth grade. They focus on a subsample of those with disabilities totaling around 2,300 to 3,000 students in each wave. They investigate potential bias in classroom placement by statistically comparing SWDs of different races or ethnicity who share similar academic, behavioral, family, and school characteristics. ECLS is a rich dataset so they were able to use various controls in their model, such as the marital status of the primary caregiver, languages spoken at home, the child’s age, the poverty level of the school they attended, and so on. Morgan et al. use regression models to estimate special-education placement in first, third, and fifth grades using kindergarten predictors. One model used only race and ethnicity as explanatory factors, while the other used academic and behavioral indicators, as well as various student, family, and school covariates measured in kindergarten.

In the initial, unadjusted model, SWDs who were Black were about twice as likely as White students to be placed primarily outside of general education. This occurred more often in first grade. Results for Hispanic students, however, were not statistically significant. In the second model using various controls, they found that SWDs who were Black or Hispanic were no more likely than SWDs who were White to be placed outside of general education classrooms. Of all the factors analyzed, the one that most strongly predicted placement outside the general education classroom in the first, third, or fifth grade was reading or math difficulty in kindergarten (i.e., low test scores). Both waves revealed this same basic result.

To reiterate that important point: Controlling for additional explanatory factors—primarily academic struggles in kindergarten—explained nearly all of the placement disparities by race and ethnicity in eleven of the twelve various analyses they ran comparing SWDs who were Black or Hispanic versus White. Factors like having trouble “self-regulating” in kindergarten did not consistently predict placement.

Unfortunately, the analysts were not able to look at whether placement outside of general education was good or bad in terms of student outcomes, nor did they look at things like teacher quality. But their main finding—that race or ethnicity does not itself predict which SWDs will be placed outside of general education classes—supports the view that racial or ethnic differences in placement do not stem from systemic bias. This is the latest in a long line of studies from Dr. Morgan and team reiterating that diagnosing risk factors accurately matters a lot in ensuring that students with disabilities are properly identified and served in our schools. We should take their research-based advice seriously.

SOURCE: Paul L. Morgan et al., “Which Students With Disabilities are Placed Primarily Outside of U.S. Elementary School General Education Classrooms?” Journal of Learning Disabilities (2022).

view
TNTP Grade level work report SR image

Post-pandemic patterns indicate too little access to grade-level work

Jeff Murray
9.20.2022
Ohio Gadfly Daily

Helping students catch up from more than two years of school-closure-related learning loss will be an impossible task if they do not have regular access to grade-level work in their classrooms. While this may seem like a no-brainer, a new report from TNTP indicates that many of our neediest students may be missing out on this crucial opportunity.

TNTP partnered with ReadWorks, a free digital literacy resource used by more than 75,000 schools nationwide, to analyze how teachers were using the platform. Data in this analysis came from the 2018–19 to 2020–21 school years and included more than three million students in over 150,000 classrooms. ReadWorks offers K–12 teachers curated nonfiction passages they can assign to students as supplemental reading practice that can increase background knowledge and improve vocabulary across subjects. Each passage is accompanied by a text-dependent question set that provides practice in inferring, monitoring and clarifying, and questioning. Grade-level appropriateness is determined using qualitative and quantitative analyses of text complexity, and texts are aligned to Common Core State Standards. While the platform encourages teachers to assign grade-level passages to students, the choice is ultimately left up to teachers.

Overall, students working on the ReadWorks platform spent about one-third of their time engaging with below-grade-level texts and question sets, and teachers assigned 5 percentage points more below-grade-level content after pandemic disruptions than before. Students in schools serving more low-income students were assigned the most below-grade-level work. They spent about 65 percent more time on below-grade-level texts and question sets than did their peers in the most affluent schools. And while students overall were just as successful on grade-level work as they were on below-grade-level work, low-income students were given less access to grade-level work even after they had already shown they could master it. The TNTP analysts state, starkly, that “there seems to be nothing many students in high-poverty schools can do to ‘earn’ access to the grade-level work they need to be successful.”

It is important to note that this is supplemental work for students and the report should not be misinterpreted to be an analysis of what may or may not be going on in their actual classrooms. But pre-pandemic research already showed a troubling dearth of grade-level work for many of our neediest students, and poor pandemic era student achievement data clearly suggest that old patterns have persisted—and worsened.

The TNTP analysts are heartened to see that successful performance on grade-level work seems achievable for students—if only they could access it. Thus, they conclude with recommendations focused largely on school culture: Teachers and school leaders must give students as much high-quality grade-level work as possible, be well-prepared to support them in persisting and achieving, and must believe that their students will rise to the challenge.

SOURCE: “Unlocking Acceleration: How Below Grade-Level Work is Holding Students Back in Literacy,” TNTP and ReadWorks (August 2022).

view
iStock / Getty Images Plus/ djedzura

Education Gadfly Show #838: Was the charter sector too slow to reopen schools for in-person learning?

9.21.2022
Podcast


On this week’s Education Gadfly Show podcast, Karega Rausch, President and CEO of the National Association of Charter School Authorizers, joins Mike Petrilli and David Griffith to discuss what—if anything—charter schools could have done to reopen sooner during the 2020-21 school year. Then, on the Research Minute, Amber Northern discusses the long-term impacts of requiring high school seniors to pass a science test to graduate.

Recommended Content:

  • Karega’s essay for The 74: “High-Quality Charter Schools Can Help Drive Student Recovery from COVID — If They’re Allowed to Grow and Expand” (April 2022).
  • Marc Porter Magee's Fordham post on the devastating learning loss of D.C.’s charter schools: “Charter school achievement in D.C. was decimated by the pandemic. Here’s what we can learn from that.” (September 22, 2022).
  • The study that Amber reviewed on the Research Minute: Ann Mantil, John Papay, Preeya Pandya Mbekeani, and Richard J. Murnane, “Increasing High School Students’ Preparation and Interest in STEM Fields: Does a Graduation Requirement Make a Difference?” Retrieved from Annenberg Institute at Brown University (September 2022).

Feedback Welcome!

Have ideas for improving our podcast? Send them to our podcast producers Nathaniel Grossman and Lilly Sibel at [email protected] and [email protected]

view

Cheers and Jeers: September 22, 2022

The Education Gadfly
9.22.2022
Flypaper

Cheers

  • Some states are use ESSER funds for the adoption and implementation of high-quality instructional materials. —Education Week
  • “Federal judge strikes down mask, vaccine mandates for toddlers in public preschools.” —National Review
  • “Across the political divide, there is agreement on helping young people launch into the next phase of their lives.” —Paul Herdman
  • The Modern Apprentice program in New York City will allow thousands of students to explore business careers while completing high school. —The 74

Jeers

  • America’s education crisis is a national security threat. —Nicholas Eberstadt and Evan Abramsky
  • An argument that “most students are rising more or less to the level of their individual potential.” —Freddie deBoer
view

What we're reading this week: September 22, 2022

The Education Gadfly
9.22.2022
Flypaper
  • Almost one-third of American workers with a teaching degree were employed outside of the education field in 2020. —Washington Post
  • Donda Academy, a K–12 private school founded by Kanye West and named in honor of his late mother, opens in California. —Rolling Stone
  • In a sign of the city’s shifting demographics, several schools that serve Black communities in Oakland are closing due to low enrollment. —Washington Post
  • The learning loss caused by pandemic-era shutdowns is a national crisis and all levels of government should be mobilized to fight it. —Michael R. Bloomberg
  • “Redshirting” all boys by delaying the start of their first school year could yield academic and emotional benefits. —Richard V. Reeves
Fordham Logo

© 2020 The Thomas B. Fordham Institute
Privacy Policy
Usage Agreement

National

1015 18th St NW, Suite 902 
Washington, DC 20036

202.223.5452

[email protected]

  • <
Ohio

P.O. Box 82291
Columbus, OH 43202

614.223.1580

[email protected]

Sponsorship

130 West Second Street, Suite 410
Dayton, Ohio 45402

937.227.3368

[email protected]