A Crowded Table: Teacher Union Strength in 2026 shows what we have all seen transpire over the last several years, as the Janus decision, the post-Covid rise of right-wing parent advocacy groups, and the spread of private school choice have seemingly chipped away at the grip of teachers unions. The Fordham Institute report by Melissa Arnold Lyon, Sandy Frost Waldron, and Rebecca Jacobsen provides evidence that they have weakened, showing that membership rates have fallen across the board and the unions’ share of campaign contributions has declined since 2012, when Fordham released its first analysis of teachers union strength, How Strong Are U.S. Teacher Unions? A State-by-State Comparison. Most compellingly, the authors’ survey of stakeholders suggests that teachers unions are no longer the dominant force in education that they were back in 2012.
The new report updates and expands upon the data from How Strong Are U.S. Teacher Unions?, providing a more comprehensive array of measures to construct state rankings. Lyon et al. add, for example, information about the win rates of teachers union-endorsed candidates and the share of voters who belong to unions. While these additions add to the rankings’ validity, they also make it difficult to draw conclusions about change over time, a point made by the authors themselves. Yet we might be curious to know how teachers union strength has evolved when comparing the exact same information from 2012 and today.
I sought to examine change over time by creating identical indicators for 2012 and 2026. Specifically, I kept only the measures that both reports shared, and then I re-constructed rankings from both time periods.[1] While I was able to maintain most measures for each of the Resources and Membership, Involvement in Politics, Labor and Bargaining Policies, and Policy Wins and Losses categories, I was unable to compare Perceived Influence over time because question wording changed. Still, we can look at how the scores on the other four areas changed when comparing apples-to-apples. Table 1 displays the measures I used to create revised rankings for both time periods.
Table 1. Shared measures used to construct revised rankings
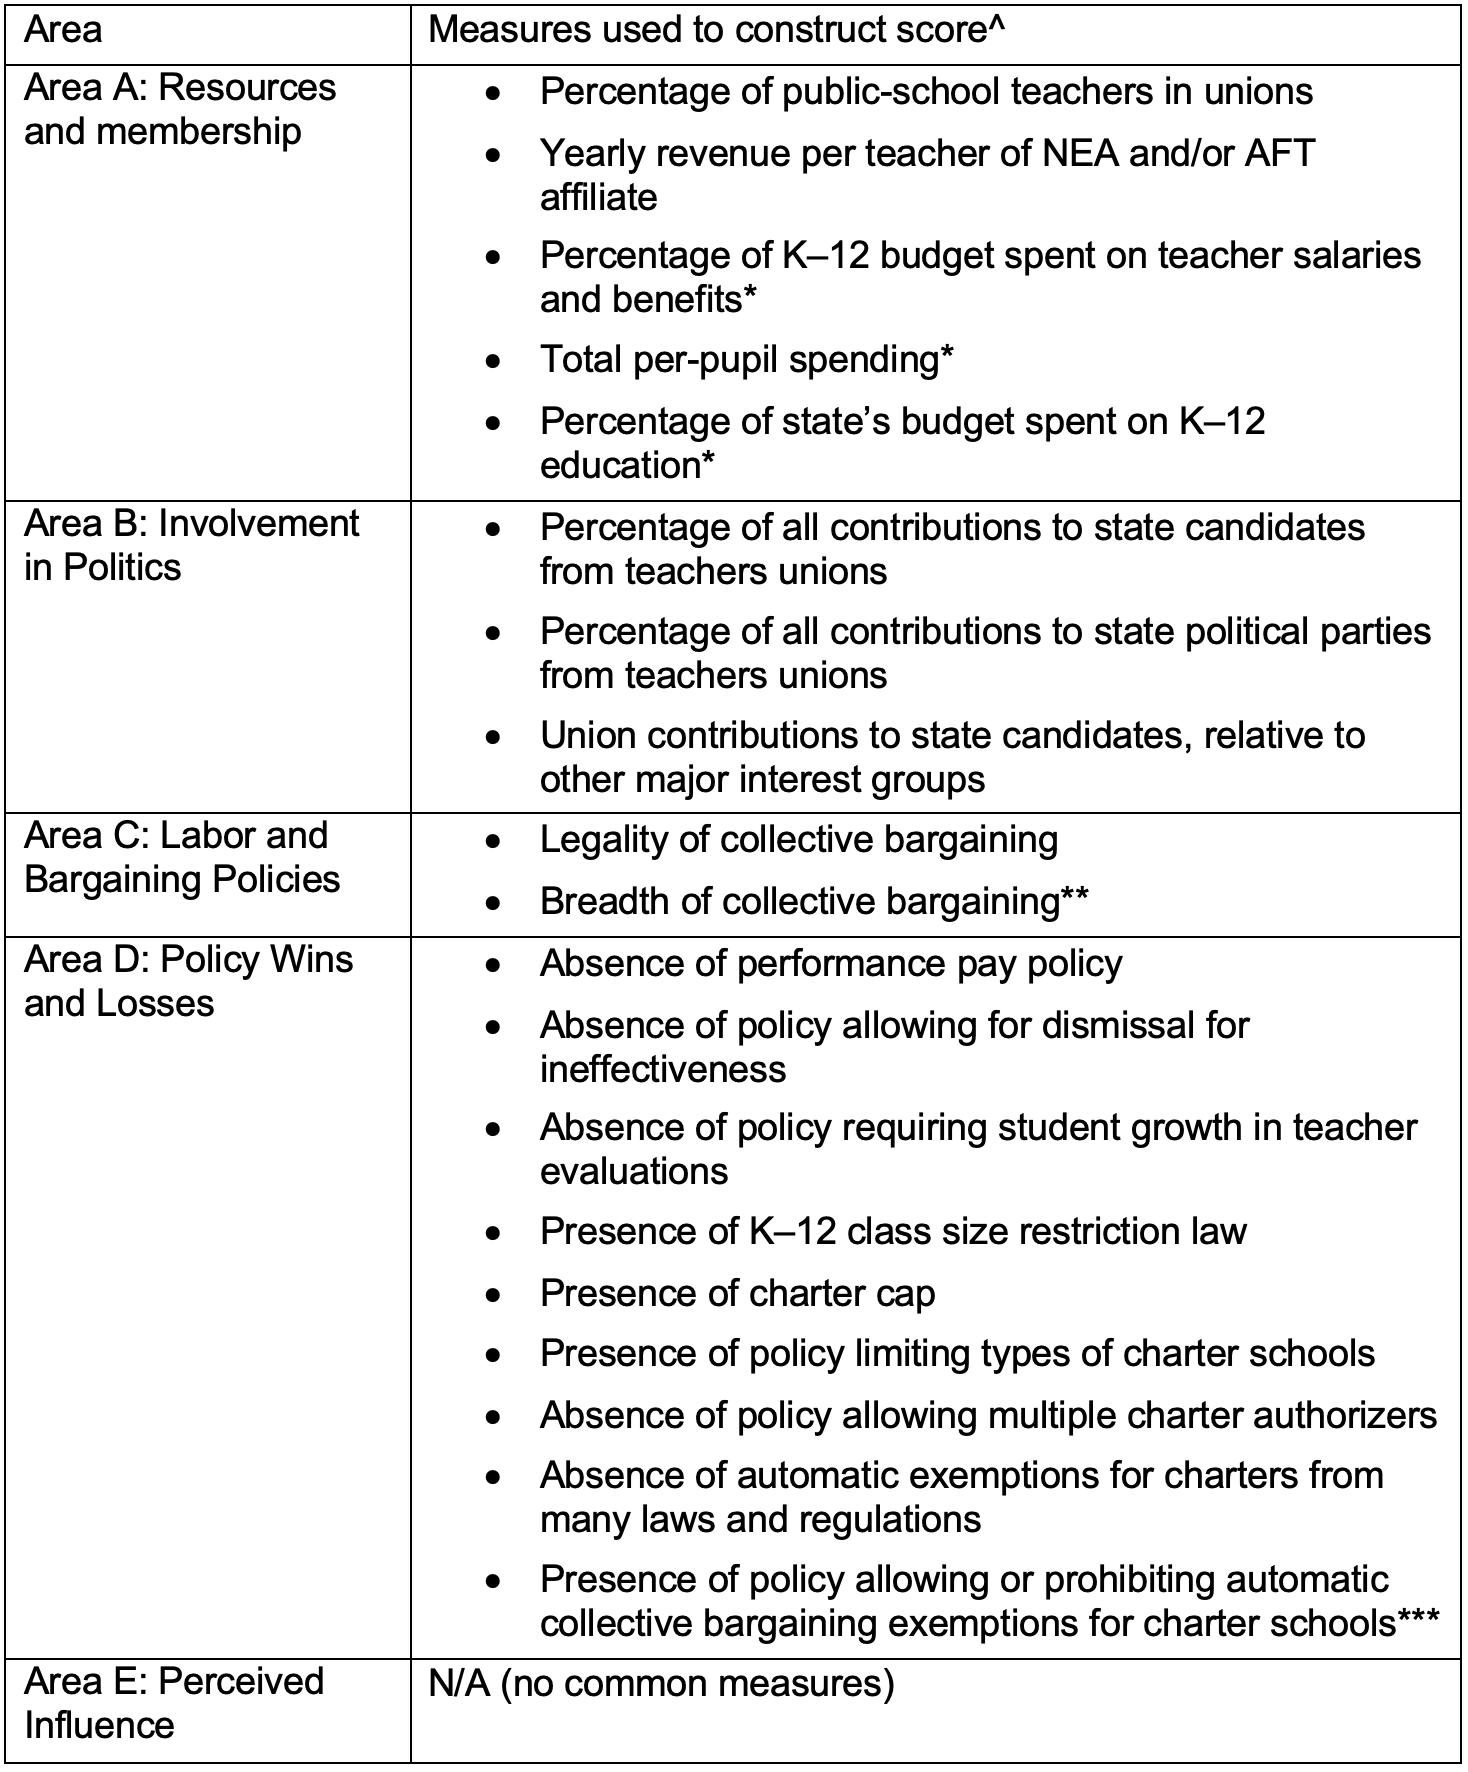
^Measures that the two reports do not share are listed in Appendix B of Lyon et al. (2026).
* While Winkler et al. (2012) included these measures in the Resources and Membership Area, Lyon et al. (2026) included them in Policy Wins and Losses. I include them in the former for purposes of the revised rankings.
**Lyon et al. (2026) include 16 areas, while Winkler et al. (2012) include 21 areas. Therefore, this area may not be identical across time, though it should be very similar.
***Lyon et al. (2026) include this in the Labor and Bargaining Policies area. I follow Winkler et al. (2012) and instead include it in Policy Wins and Losses.
Figure 1 displays how each state’s score in each area changed between the two reports on areas for which there are common measures. It is important to note that the score changes are relative, not absolute, since they are based on quantiles; in other words, the figure shows how each state’s indicator score changed relative to the other states. The size of the bars indicates how much scores changed in a particular area, while the location of the bars shows whether the score increased (right of 0) or decreased (left of 0) between 2012 and today. For example, Hawaii and Wisconsin’s yellow bars are both to the left of 0, which means their relative scores on Policy Wins and Losses fell between 2012 and 2026. The larger size of Hawaii’s bar, however, means that its score fell more than did Wisconsin’s. To take a counterexample, California’s score in that same area grew more than did Oklahoma’s, but both had relative scores that were higher in 2026, since the bars are to the right of 0.
Figure 1. State changes in indicator scores, sorted by degree of score increases
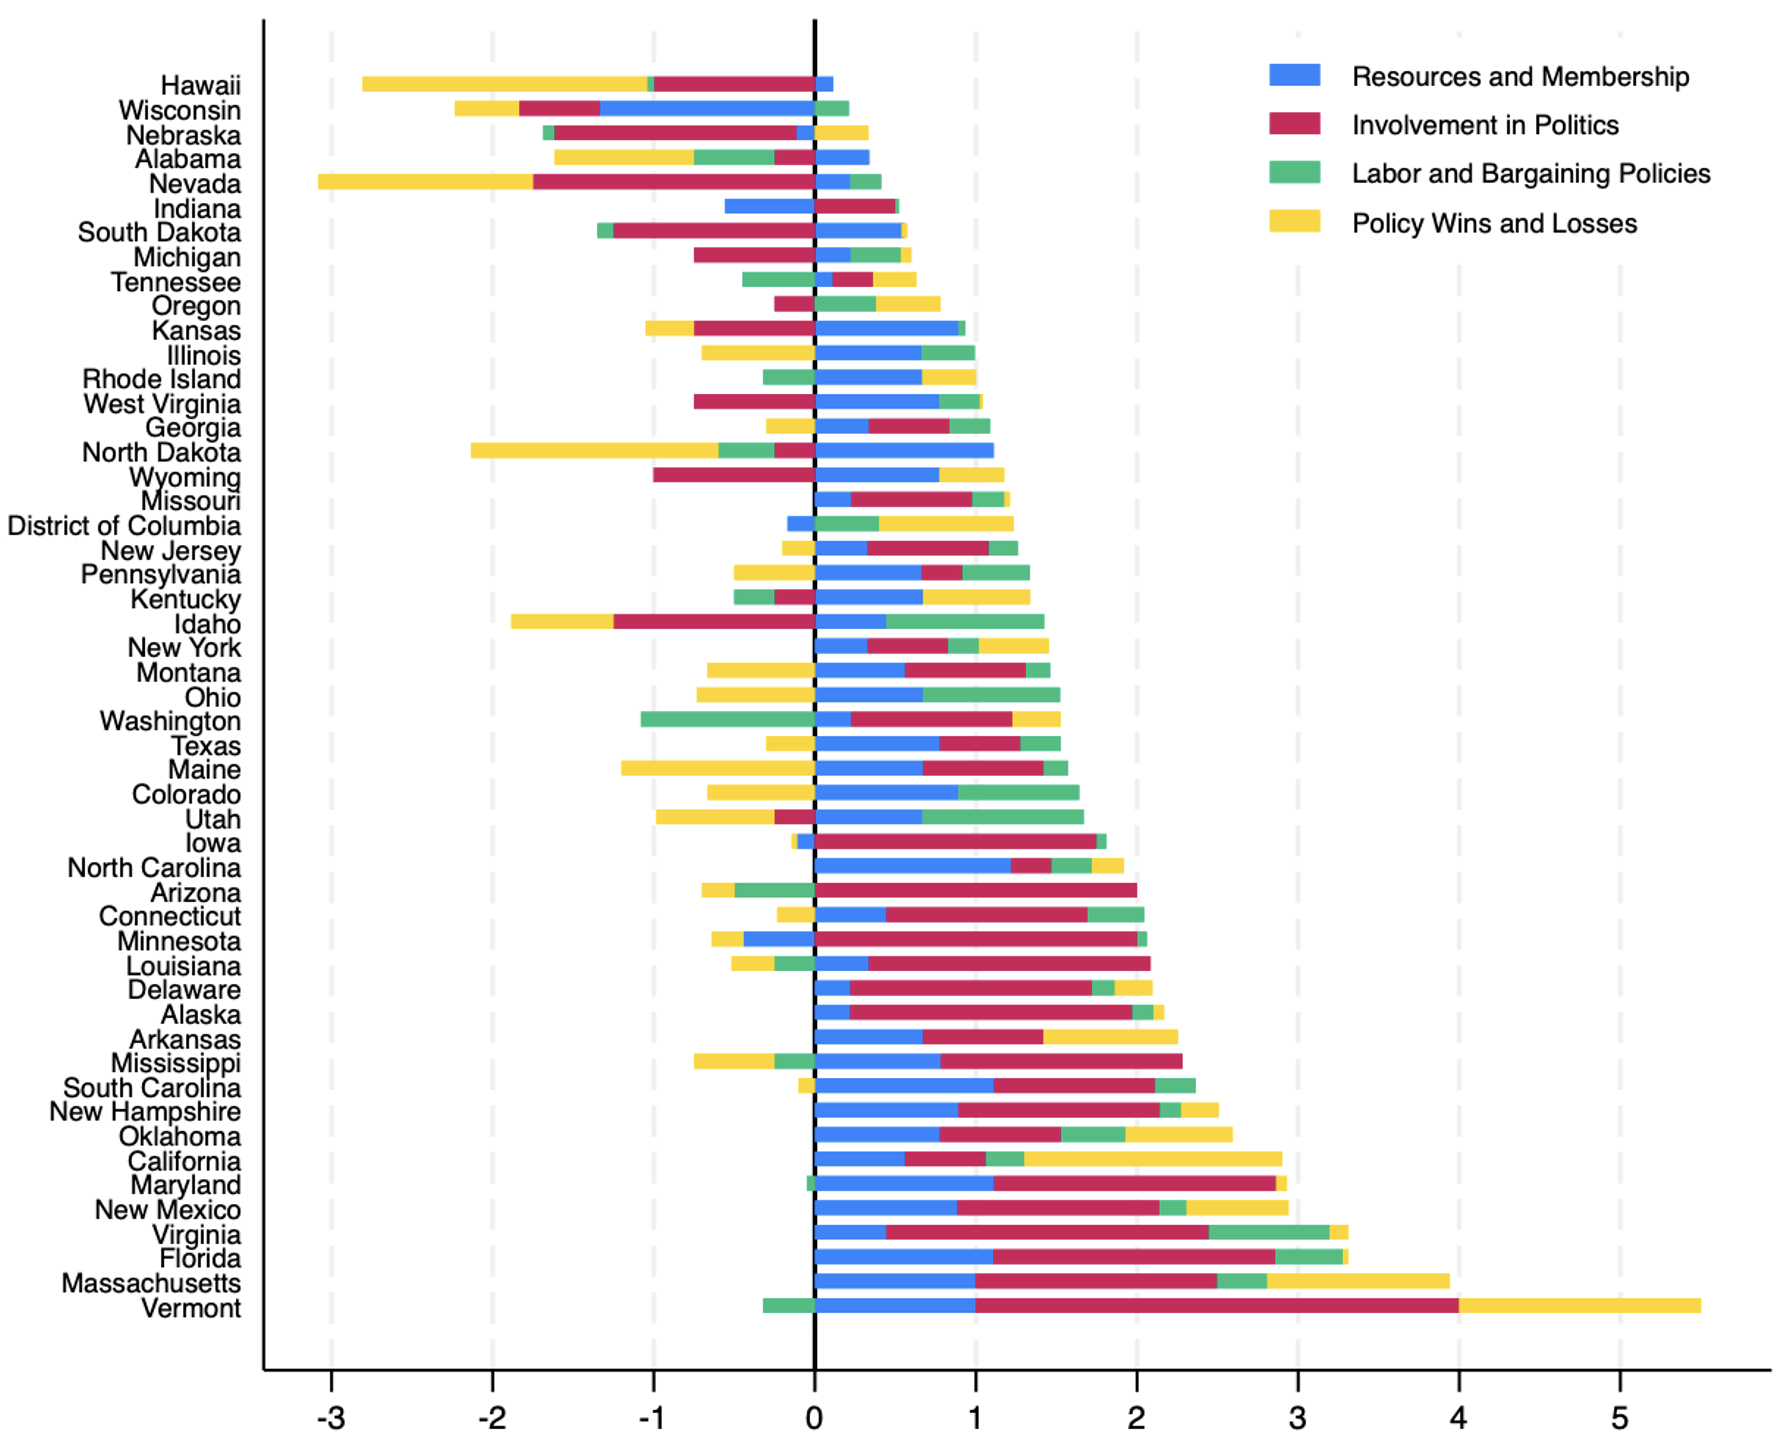
Vermont, listed last, had scores with the largest increases; in three of the four areas with common measures, Vermont’s scores relative to other states went up the most between 2012 and 2026. In particular, the large red bar means that Vermont’s relative involvement in politics rose more than any other state’s. Vermont’s score increases support Lyon et al.’s ranking of Vermont as number one. Several other states, listed just above Vermont at the bottom, also increased their scores across most measures (Massachusetts, Florida, Virginia, New Mexico, Maryland). This aligns with Lyon et al.’s finding that each of these states increased their rankings of teachers union strength. At the top of the graph, we see states that have lower scores in 2026 with the revised measures, including Hawaii, Wisconsin, Nebraska, Alabama, and Nevada. The fact that Hawaii’s scores fell when comparing the same measures supports that the state’s ranking went down between the two reports (from number one in 2012 to number five in 2026). Some states, like Idaho, increased their relative scores on some measures while decreasing their scores on others. This means that in some ways teachers union strength increased in Idaho (in terms of Labor and Bargaining and Resources and Membership), but in other ways, it fell (in terms of Involvement in Politics and Policy Wins and Losses).
Using these four indicator scores, I generated new state rankings for 2012 and 2026. Figure 2 shows visually which states were ranked lower (those below the line) and higher (those above the line) in 2026. States right on the line received the exact same ranking for each period when using the revised rankings. Specifically, teachers union strength compared to other states remained the same in Minnesota (number 10), Utah (37), North Carolina (42), and South Carolina (47). These four states do not have the same rankings in the original reports, meaning that when the measures were not comparable, their relative teachers union strength was not the same over time. That said, all except North Carolina had rankings within 5 points on the original reports, so their scores were similar over time.
Figure 2. Comparison of revised rankings based on shared measures[2]
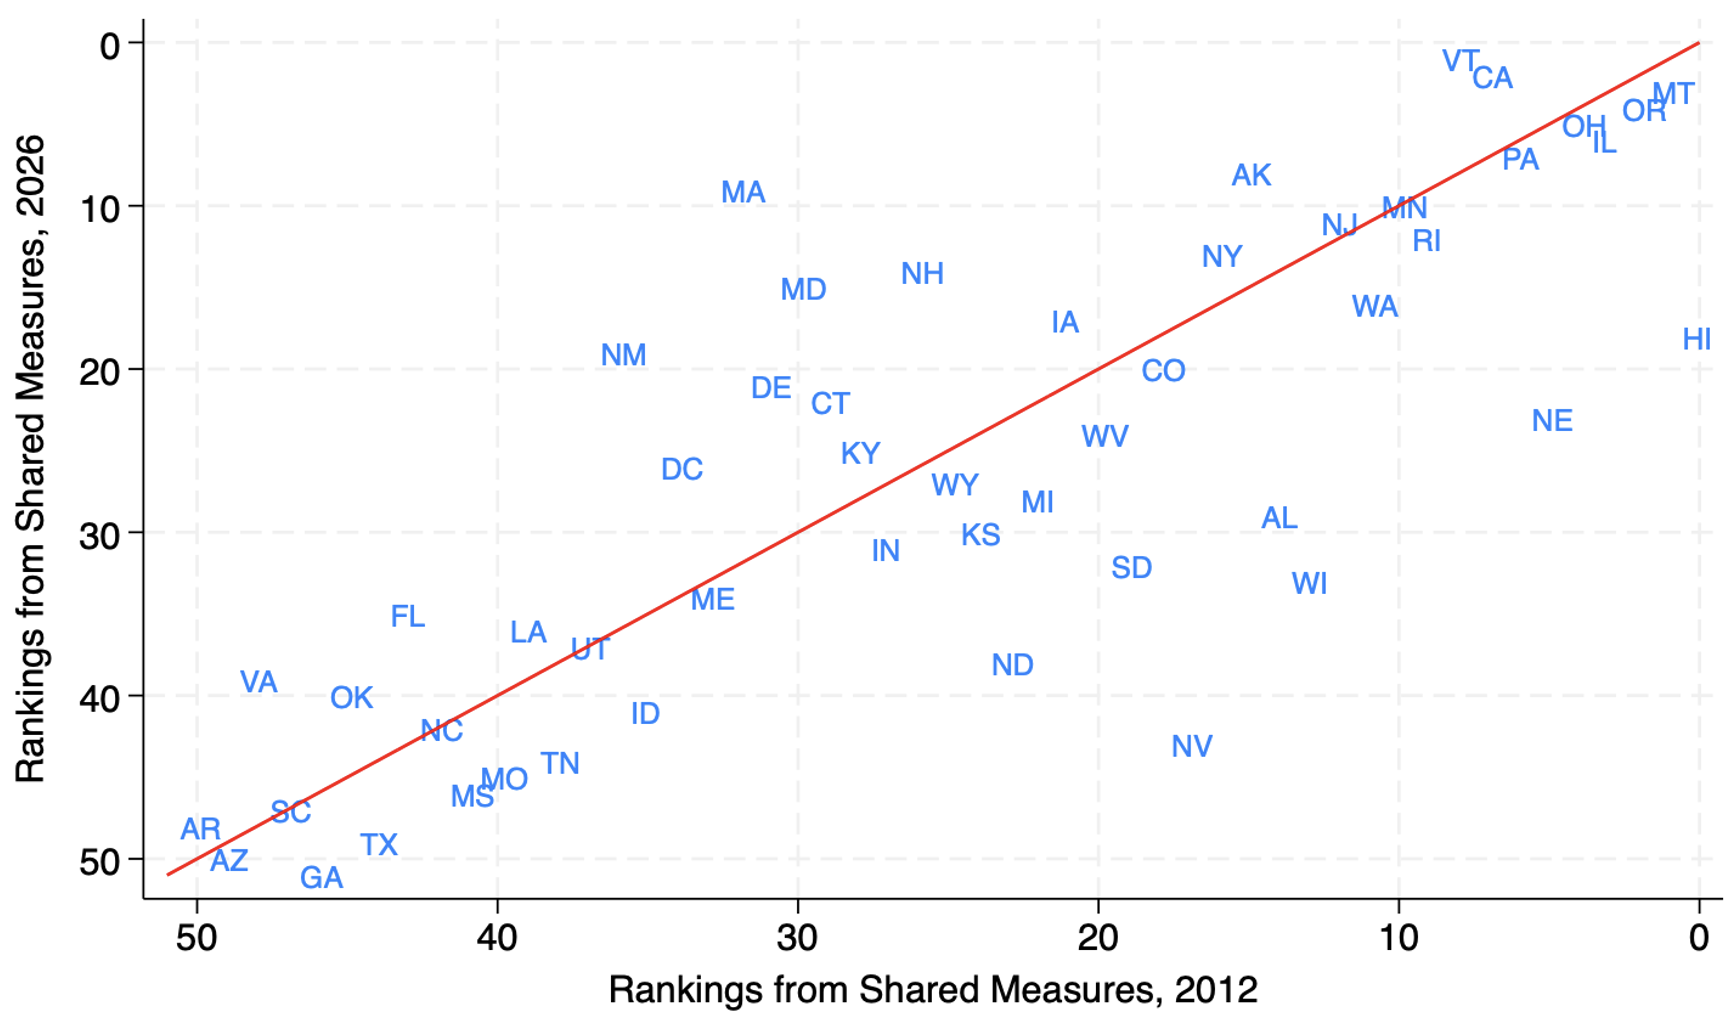
Overall, Figure 2 confirms much of what Lyon et al. find. Many of the states in the bottom 10 remained there (Arkansas, Arizona, South Carolina, Georgia, Texas) as did some of the top states (Illinois, Oregon). Most, but not all, of the states with large change are the same as in Lyon et al.’s report. Nevada, not Wisconsin, has the largest shift in its ranking, with teachers union strength dropping from 18 to 43 in its ranking based on shared measures. Wisconsin, however, is close behind in terms of change, dropping from 14 to 33. Massachusetts, New Mexico, Virginia, Alabama, and Maryland all have large changes in rankings, aligning with Lyon et al.’s findings. Overall, when using more comparable measures, the change in rankings mostly supports Lyon et al.’s assessment of how teachers union strength across states changed over time.
We might wonder whether changes in rankings are related to politics. One of Lyon et al.’s findings is that Democratic states have the strongest unions, as they did in 2012. But much has changed in the last 14 years that might lead us to think that the strength of teachers unions is more related to the partisan lean of the state than before. Political polarization has worsened and there are increasingly distinct “red states” and “blue states,” with very different policy environments. Public opinion on education issues has also become more polarized by party, including attitudes toward teachers unions. Although the Janus decision struck a blow to teachers unions in blue states, unions in those states have softened the impact with various policy mechanisms. In sum, the political environment of the last 14 years may well have enhanced the strength of unions in Democratic states, while weakening them in Republican states.
Figure 3 shows that in both years the rankings based on shared measures are strongly correlated with presidential vote share; states voting more Democratic tended to have stronger teachers unions in both studies. In other words, the figure on the left shows that as a state’s support for Obama goes up, so too does its ranking of teachers union strength (because lower numbers are higher rankings). The inverse is true for the figure on the right. As Trump vote share increases, teachers union strength rankings fall. This supports Lyon et al.’s conclusion that unions are stronger in blue states.
Figure 3. Revised rankings and presidential vote share
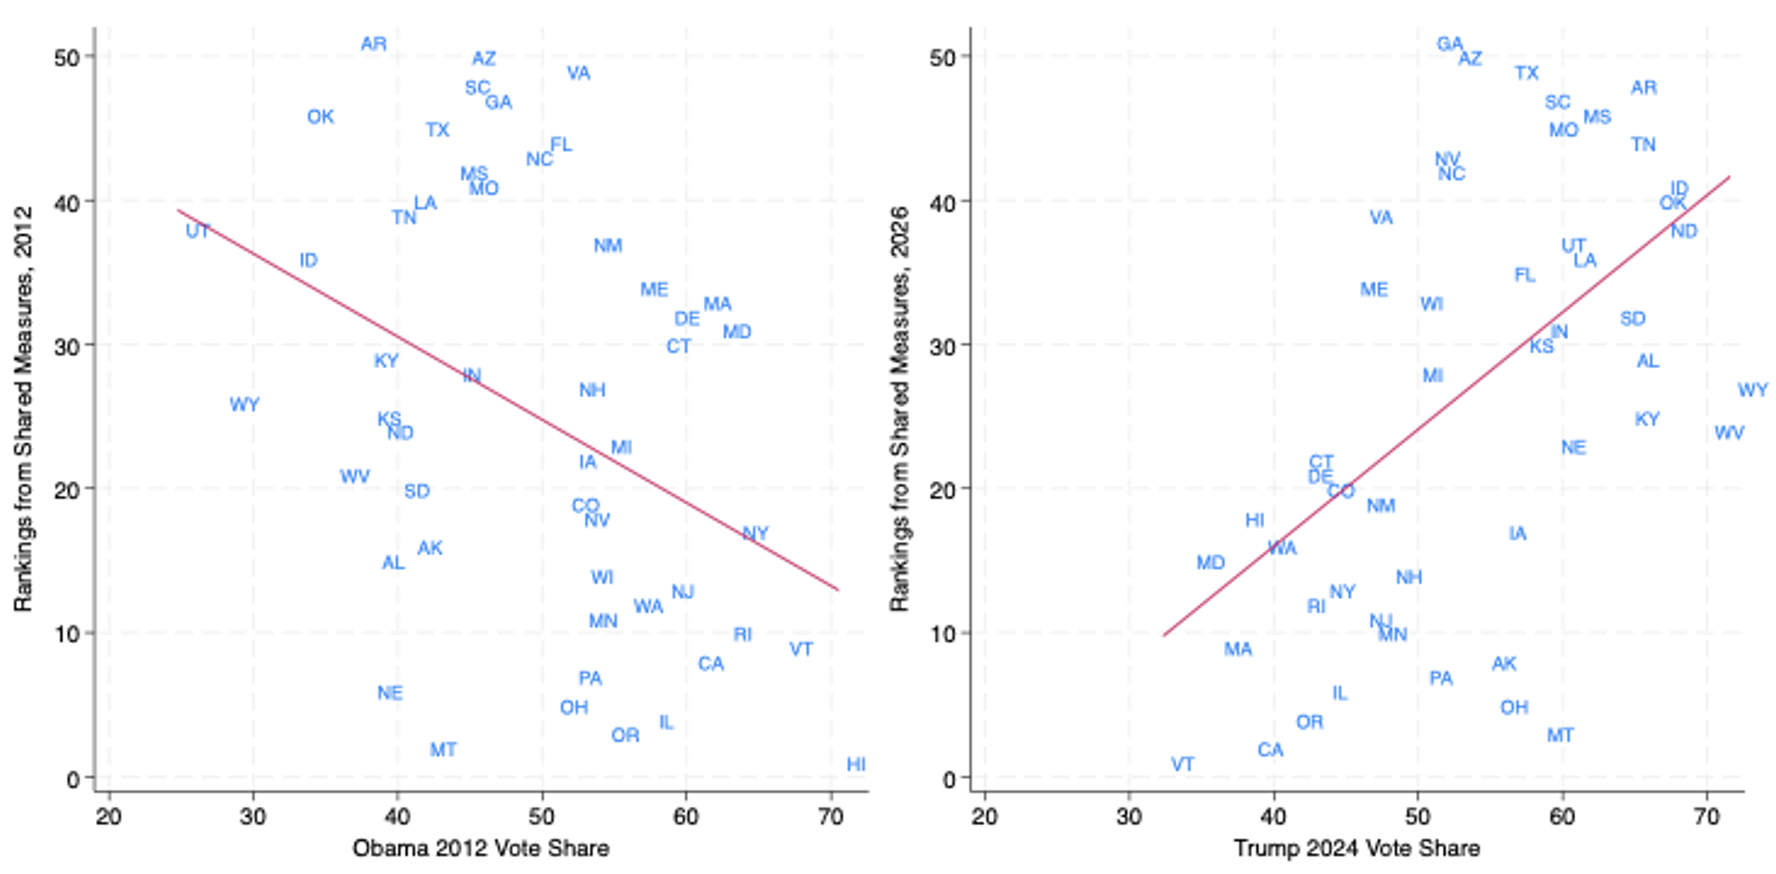
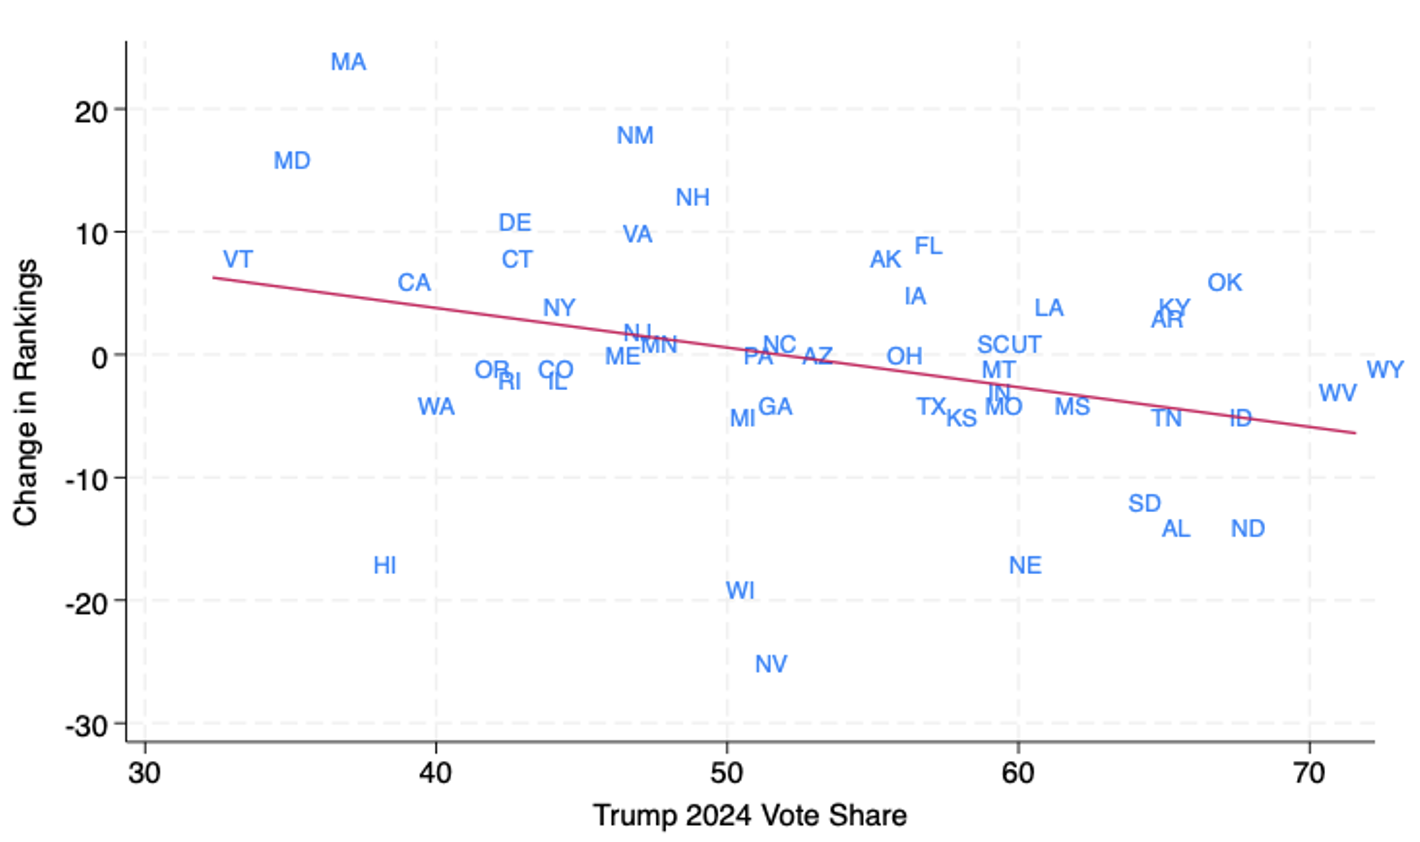
Figure 4 plots the states by their change in ranking. It provides evidence that increasing ranks are related to lower Trump vote share and vice versa. In other words, teachers unions have lost the most relative strength in those states that most supported Trump (e.g., North Dakota, Idaho, Alabama), while gaining the most in those states that least supported Trump (Vermont, Maryland, Massachusetts). This could come from increased teachers union activities and favorable policies in blue states, the opposite in red states, or both. Regardless, this seems to support the idea that increasing partisan polarization has impacted the influence of teachers unions as well.
Figure 4. Change in revised rankings and Trump vote share
What is driving the relationship between state partisanship and the change in teachers union strength? Figure 5 plots the change in state scores in each area by the state’s 2024 Trump vote share. Where the line is flat, that suggests no relationship between a state’s support for Trump and any changes in the teachers union strength indicator between 2012 and 2026. This is the case for the figures on the left-hand side, which graph the membership and bargaining score changes. This means that membership and resources have not necessarily fallen the most in Republican states, and labor policies have not necessarily become the least friendly. Where the states seem to move together in one direction, this suggests that support for President Trump is correlated with changes in teachers union strength. The relationship between policies and Trump vote share, for example, is very slightly negative, since the state abbreviations seem to move downward as Trump support increases. The clearest relationship, however, is between teachers union involvement in campaigns and lack of support for President Trump. Where states had lower levels of support for Trump, their teachers unions were more active in politics, and vice versa. The negatively sloped line makes this clear.
Figure 5: Change in indicator scores and Trump vote share
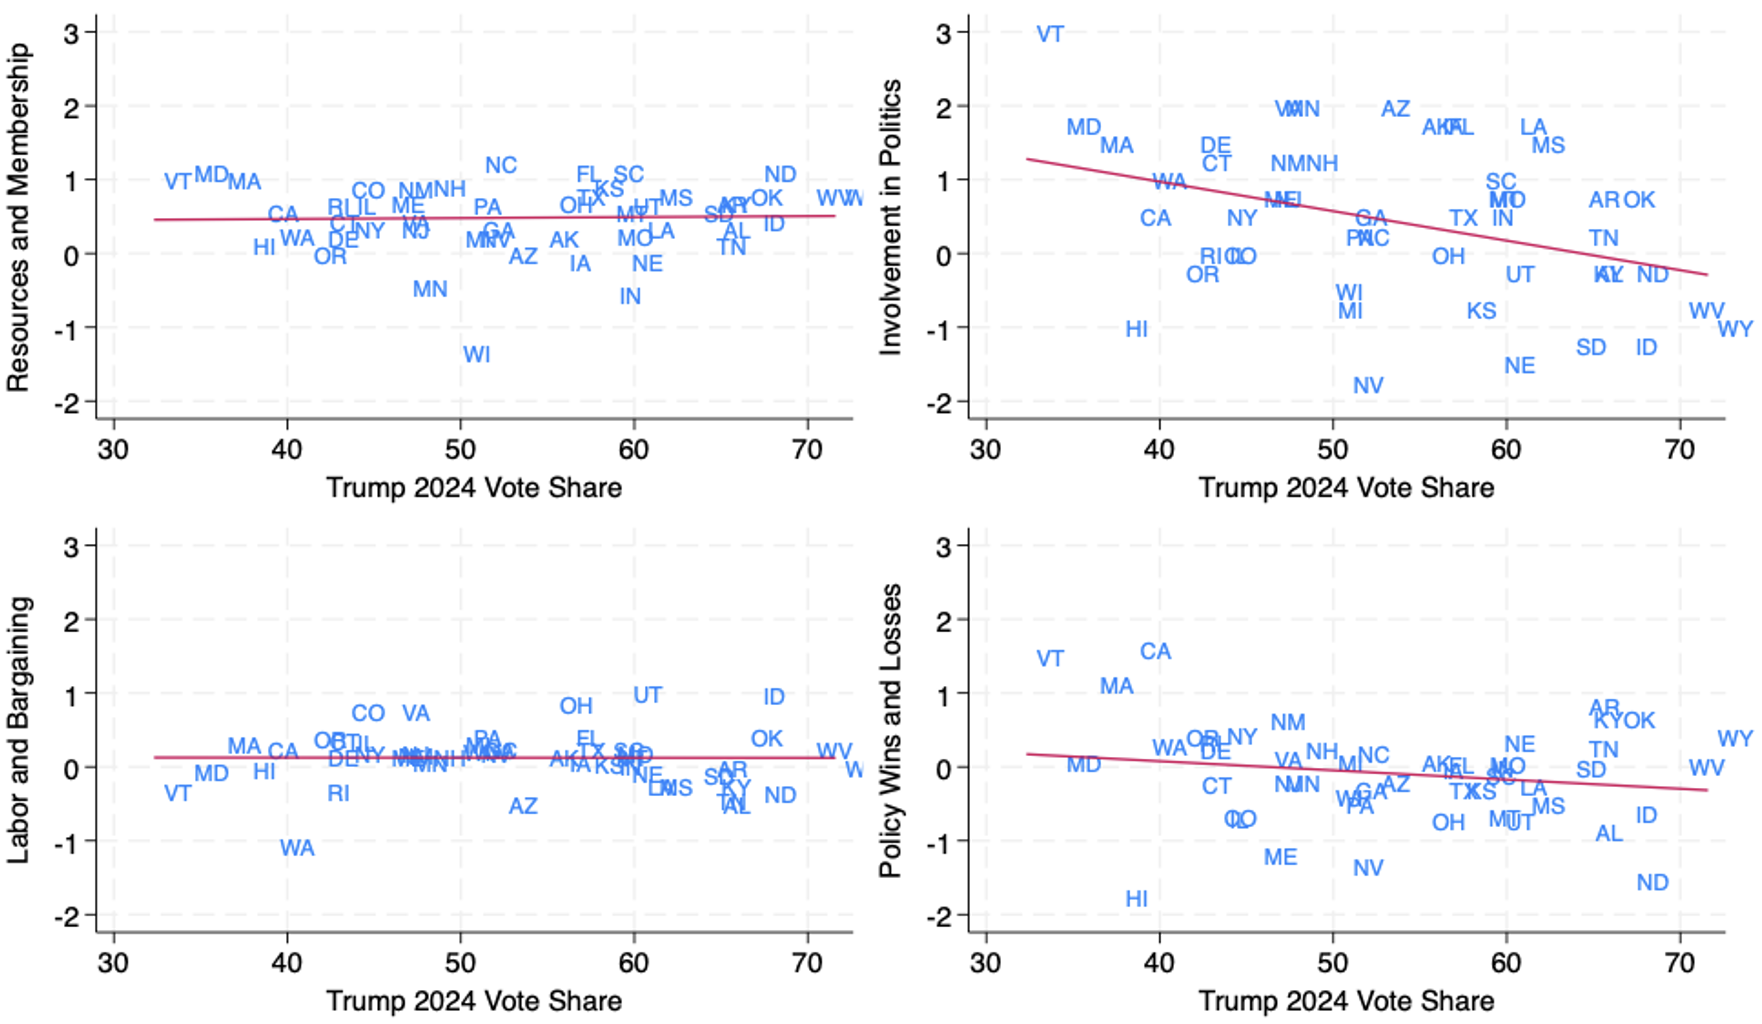
While it is not surprising that campaign activity would have grown more in Democratic states, since teachers unions have increasingly been more involved with the Democratic Party, what is surprising is that changes in scores on membership and bargaining are not related to the political lean of the state. This seems to contradict the narrative of partisan polarization in education; unions seem to be maintaining some institutional labor power in those states. As Lyon et al. show in their Table A5, there are Republican states where labor law has become less favorable, but there are as many states where it has become more favorable. Moreover, the #RedforEd strikes of 2018, which occurred primarily in Republican states, may have had positive effects on support for labor as well as on resources devoted to education. And indeed, spending on education has increased in almost every single state, as Lyon et al. explain. The latter makes up much of the Resources and Membership indicator.
Additionally, it is worth noting that, because I am including only shared measures, the Policy Wins and Losses scores do not include the existence and scope of private school choice policies, which were absent in the 2012 report. If these were included, the relationship between the political lean of the state and the change in scores on Policy Wins and Losses would likely be stronger, since the states passing such policies in the last several years have been those controlled by Republicans and with relatively weak teachers unions: Texas (49 in the revised 2026 ranking), Tennessee (44), Idaho (41), Wyoming (27), Louisiana (36), Georgia (51), Alabama (29), Utah (37), South Carolina (47), Oklahoma (40), etc.
What to take from all of this? It is not quite right to conclude that teachers unions have become weaker across the board. Lyon et al. show that teacher unionization rates and their share of contributions to state political parties have gone down. Yet the authors point out that this could be because they are spending in other ways. Once we compare similar indicators across time, it becomes clear that unions have generally gotten weaker in Republican states, at least compared to their blue-state counterparts. That said, this is due to decreased campaign activity relative to Democratic states, not fewer financial resources or more adverse labor law. It may also be reflective of new private school choice policies. Overall, it seems safe to say that teachers union strength has endured in many respects, even if unions now share a more crowded table.
[1] In How Strong Are U.S. Teacher Unions?, when data were continuous, Winkler et al. created scores in each area by calculating the quantile for each state on each measure and then averaging them. Lyon et al. instead standardized their data and averaged those scores to derive area scores. To ensure my revised rankings are constructed in the same way, I use Winkler et al.’s approach with Lyon et al.’s data for the revised 2026 rankings.
[2] Note that I drop D.C. from all figures since it is an outlier and makes it more difficult to visualize the overall relationship.