Mobile Navigation

  • National
    • Policy
      • High Expectations
      • Quality Choices
      • Personalized Pathways
    • Research
    • Commentary
      • Gadfly Newsletter
      • Flypaper Blog
      • Events
    • Scholars Program
  • Ohio
    • Policy
      • Priorities
      • Media & Testimony
    • Research
    • Commentary
      • Ohio Education Gadfly Biweekly
      • Ohio Gadfly Daily
  • Charter Authorizing
    • Application
    • Sponsored Schools
    • Resources
    • Our Work in Dayton
  • About
    • Mission
    • Board
    • Staff
    • Career
Home
Home
Advancing Educational Excellence

Main Navigation

  • National
  • Ohio
  • Charter Authorizing
  • About

Ohio Menu

  • Topics
    • Accountability & Testing
    • Career & Technical Education
    • Charter Schools
    • Curriculum & Instruction
    • ESSA
    • Evidence-Based Learning
    • Governance
    • High Achievers
    • Personalized Learning
    • Private School Choice
    • School Finance
    • Standards
    • Teachers & School Leaders
  • Research
  • Policy
  • Commentary
    • Ohio Gadfly Newsletter
    • Ohio Gadfly Blog
    • Events

The Education Gadfly Weekly

Sign Up to Receive Fordham Updates

We'll send you quality research, commentary, analysis, and news on the education issues you care about.
Thank you for signing up!
Please check your email to confirm the subscription.

Ohio Gadfly—Why legislators are right to transform the state board of education

Volume 17, Number 3
1.24.2023
1.24.2023

Ohio Gadfly—Why legislators are right to transform the state board of education

Volume 17, Number 3
view
SB1 analysis blog image
School Funding

Three reasons why legislators are right to transform the state board of education

In December, state lawmakers rocked the boat during an otherwise sleepy lame duck session by moving forward with a proposal to significantly overhaul Ohio’s education governance structure.

Jessica Poiner 1.24.2023
OhioOhio Gadfly Daily

Three reasons why legislators are right to transform the state board of education

Jessica Poiner
1.24.2023
Ohio Gadfly Daily

Ohio’s new school funding formula: An introduction

Aaron Churchill
1.26.2023
Ohio Gadfly Daily

Ohio auditor’s report on teacher pension system raises concerns, no illegalities

Aaron Churchill
1.18.2023
Ohio Gadfly Daily

Improving the accuracy of school funding data

Jeff Murray
1.31.2023
Ohio Gadfly Daily

Getting ready for future employment opportunity: Evidence from Pittsburgh

Jeff Murray
1.26.2023
Flypaper
view
School funding preview pt 1 blog image

Ohio’s new school funding formula: An introduction

Aaron Churchill 1.26.2023
Ohio Gadfly Daily
view
Auditor teacher pensions blog image

Ohio auditor’s report on teacher pension system raises concerns, no illegalities

Aaron Churchill 1.18.2023
Ohio Gadfly Daily
view
Passthrough funding SR image

Improving the accuracy of school funding data

Jeff Murray 1.31.2023
Ohio Gadfly Daily
view

Getting ready for future employment opportunity: Evidence from Pittsburgh

Jeff Murray 1.26.2023
Flypaper
view
SB1 analysis blog image

Three reasons why legislators are right to transform the state board of education

Jessica Poiner
1.24.2023
Ohio Gadfly Daily

In December, state lawmakers rocked the boat during an otherwise sleepy lame duck session by moving forward with a proposal to significantly overhaul Ohio’s education governance structure. Although the measure ultimately stalled, proponents vowed to try again, and in the early weeks of January, they kept their word.

Senate Bill 1 makes two significant changes to current law. First, it replaces the current Ohio Department of Education (ODE) with a new agency, the Department of Education and Workforce (DEW). The new DEW would be run by a director appointed by the governor, and would consist of two divisions—one focused on primary and secondary education and the other on career-technical education—each headed by deputy directors who are appointed by the director. All three positions would be selected with the advice and consent of the Senate.

Second, the bill transfers the vast majority of Ohio’s day-to-day education decision-making power to the DEW. Right now, ODE is overseen by a state superintendent who answers to the state board, a nineteen-member body comprised of both elected and appointed members. However, under SB 1, the overwhelming majority of powers and duties related to primary, secondary, special, and career-technical education would be transferred to the DEW, which would also become Ohio’s “state education agency” under federal law. The state board and the state superintendent would still be responsible for executing some administrative functions, like the adoption of requirements for educator licensure, disciplinary actions, and school district territory transfer determinations.

If this bill passes, education governance in Ohio will be vastly different than it has been in years past—and that’s likely a good thing. Here are three reasons why.

1. The state board doesn’t focus on the right things.

Under current law, the state board has a host of responsibilities. One of the most important is its obligation to “exercise leadership in the improvement of public education in the state.” This has become especially crucial in the wake of the pandemic, during which hundreds of thousands of Ohio students fell behind academically. Black and Hispanic students, those with special needs, and children from low-income backgrounds have been hit the hardest.

Given its mandate to lead the way on education improvements, one might assume that the state board has been using its platform and powers to spotlight learning loss, highlight the pandemic’s outsized impacts on underserved communities, and strategize about how best to address the crisis. But a look at materials from board meetings held in 2022 reveals very few planned discussions about Covid learning loss or state efforts to address it. That doesn’t mean these things didn’t come up during meetings, of course. But they weren’t the headlining discussion topic they deserved to be, particularly in light of state and national testing results that indicate some pretty serious academic wreckage.  

The same is true for the billions of Covid relief funding that Ohio and its schools have received from the federal government. According to state law, the board is responsible for supervising the “allocation and distribution of all state and federal funds for public school education.” That includes developing “a standard of financial reporting” for districts and schools so that their financial information and budgets are “available to the public in a format understandable by the average citizen.” Although recent state board meetings have included discussions about state and district spending of Covid relief funds, the board has never called on ODE or district boards to transparently track and report how they’re spending hundreds of millions of federal dollars. That’s a problem.

To be fair to the board, some of their work has focused on the right things. Last spring, they did a solid job of ironing out the details of a state report card overhaul. And in recent meetings, they’ve tried to focus on workforce readiness and the rising importance of career-technical education. But for the most part, the board is so busy miring itself in controversy and engaging in “psychological games” and public backbiting that it isn’t doing the work it should be. Laura Hancock, writing for Cleveland.com, said it best: “The board spends significant portions of time in confusion and arguing over parliamentary process. The board is ideologically divided and spends hours arguing over resolutions that don’t directly affect student achievement, even though Ohio kids are behind because of the pandemic.”

2. The state board has a history of lowering expectations.

Research indicates that teacher expectations—like whether a teacher thinks a student is capable of earning a college degree—can influence student performance. College completion rates are “systematically higher” for students who have teachers with higher expectations, and a Fordham-commissioned study published last year indicates that teacher expectations have a positive effect on long-term outcomes regardless of if students attend a traditional district, charter, or private school.

Whether teachers have high expectations of their students depends on a variety of factors. Education policy might not immediately come to mind as one of those factors, but it plays an important role. When high expectations are enshrined in law, teachers and schools that may have otherwise given in to the soft bigotry of low expectations are instead required to strive toward a higher standard. It’s not a perfect system, obviously, but it can positively impact students. That’s why it’s so worrisome that the state board has a history of lowering expectations.

Consider the graduation requirements debacle that plagued Ohio for years. In the fall of 2016, some district leaders warned of a coming “graduation apocalypse” thanks to a new set of requirements that thoughtfully and purposely raised the bar for students. By the spring of 2017, the state board was advocating for a set of alternative requirements that would allow students to earn a diploma based on things like attendance, capstone projects, and volunteer hours—measures that have little to do with the knowledge and skills that most colleges and employers are looking for, and that would likely result in students earning meaningless diplomas. Despite a lack of data on how many students needed an alternative pathway, and the fact that such low expectations created serious equity issues, the state board asked the legislature in 2018 to extend the softened graduation requirements to the classes of 2019 and 2020. Fortunately, the legislature didn’t follow through with the board’s recommendations. But the episode is an important illustration of how the board has openly sought to water down academic standards.

Ohio’s younger students haven’t been spared the board’s low expectations, either. At its most recent November meeting, the board voted to recommend that the General Assembly repeal the retention provision of the Third Grade Reading Guarantee. In its resolution, the board claimed that “mandating third grade retention had not achieved the desired result” in Ohio. But that’s highly questionable. In fact, pre-pandemic trends in third grade English language arts state test scores show an uptick in proficiency rates and a substantial decline in the number of students who score at the lowest achievement level—an important data point to consider, as the policy was intended to focus on struggling readers. Rather than seeking to maintain a high standard for early literacy, the board has planted a flag for low expectations.

3. The state board doesn’t act with urgency.

One of the most persistent criticisms of the board is that it takes far too long to do pretty much everything. Take the aforementioned graduation requirements issue, for example. Throughout 2018, state board members complained about “inaction” from state lawmakers in identifying a permanent solution to the supposed problem that students were struggling to earn the number of end-of-course exam points required by law for a diploma. And yet in an ironic—and supremely hypocritical—twist, it was the state board that was legally responsible for setting the number of end-of-course points. If board members thought the required number was too high, they had the power to change it. But they didn’t. Instead, they abdicated their responsibility for nearly a year and then accused the legislature of being slow to act. 

The most obvious example is the seemingly interminable search for a permanent state superintendent, which has dragged on for over a year and a half now. It’s important to acknowledge that the extended search isn’t entirely the fault of the board. But the board isn’t free of blame, either. Discord and political infighting among members have certainly slowed the process. (“You’ve got a bunch of factions,” Senator Andy Brenner told the Columbus Dispatch in October. “That’s really what led to the delay in the superintendent search.”) In mid-December, rather than vote to hire a search firm to find a state superintendent, board members decided to postpone the decision “amid legislative uncertainty” about their future. Ironically, one of the chief reasons such legislative uncertainty exists is because they have a longstanding habit of postponing decisions.

***

If SB 1 makes it through both chambers and is signed into law, it will change Ohio education governance as we know it. But change isn’t always a bad thing. For years, the state board of education has failed to focus on academic growth and achievement, refused to uphold high expectations for students, and neglected to act with urgency. Instead, it’s become consumed with political infighting and controversy. Ohio schools and students deserve educational leadership that acts quickly and efficiently in their best interest. Right now, they don’t have it. SB 1 could change that.

view
School funding preview pt 1 blog image

Ohio’s new school funding formula: An introduction

Aaron Churchill
1.26.2023
Ohio Gadfly Daily

In summer 2021, Ohio lawmakers passed a brand-new school funding formula for Ohio’s 600-plus school districts and 300-plus public charter schools. To fulfill its constitutional responsibility of properly funding K–12 education, Ohio has long used a formula that seeks to deliver more state aid to districts that have less capacity to generate dollars locally and/or serve greater numbers of high-need students.

The latest iteration of the formula follows the much-discussed Cupp-Patterson plan, named after its legislative sponsors former Speaker Bob Cupp and former Representative John Patterson. They first unveiled this blueprint—also dubbed the “Fair School Funding Plan”—in spring 2019, and after much debate and revision, lawmakers eventually enacted the blueprint via the state budget bill for FYs 2022 and 2023. The new formula calls for an estimated increase of $2 billion per year in state education expenditures—a roughly 20 percent bump—and includes a new “base cost” model intended to determine the cost of educating an average student, among other structural modifications.

With the next biennial budget bill on deck for 2023, legislators will soon be reviewing the new school funding formula. There will certainly be strong advocates for maintaining the current model, but continued implementation isn’t a slam dunk. During the last budget cycle, important questions were raised about the formula, including concerns about its costs and long-term sustainability. As a result, legislators phased in just 33 percent of the additional funding called for under the new formula, and also included language that explicitly limited its use to FYs 2022 and 2023.

In this essay and a few forthcoming pieces (stick with me!), we’ll take a closer look at the formula and the major issues that legislators should focus on in the coming months. The details can get wonky, but it’s important for Ohio to get them right and ultimately implement a fair and sustainable formula. This piece starts with the basics, while future pieces will take a deeper dive into the mechanics.

The big picture

To understand the formula, we first need a handle on the basics of how funding in Ohio works. At a rudimentary level, we must remember that Ohio takes a “hybrid” approach to funding K–12 education, whereby both local and state dollars support schools. On the local side, all districts receive significant sums through property taxes. This includes dollars raised via a state-required property tax of at least 2 percent (20 mils), along with supplemental dollars generated when districts tax above that floor with voter consent. In total, Ohio districts received about $11 billion in local revenue during FY 2022.

The well-known problem with a “local-only” funding system is that substantial disparities in property wealth and income exist from district to district. Because of these differences, the state works to “level up” poorer districts to create a more even playing field. In 2022, the state provided approximately $10 billion to schools, allocated largely through the funding formula (about $8.5 billion).

Table 1 illustrates how the formula works to counteract disparities in local wealth. Districts such as Solon and Parma generate more local dollars, and as a result, their state funding levels are relatively modest. Cleveland, a poorer district, raises fewer dollars locally and thus receives—as it should—more from the state. Ohio’s public charter schools do not receive local funds (save for a few in Cleveland) and thus receive more state dollars, as well. However, charters’ state funds do not fully compensate for the absence of local resources. Consequently, charters on average receive significantly less overall funding than nearby districts.

Table 1: Illustration of local and state funding in Cuyahoga County, FY 2022

School funding preview pt 1 blog table 1
* Local funding includes the dollars generated on the 2 percent state minimum property tax rate plus supplemental local funding generated above that floor. The Intergenerational charter school is one of fifteen charters that participates in a Cleveland-specific partnership, allowing them to receive a portion of local tax revenues.
** State funding includes dollars that flow directly through the state funding formula, plus additional state funds provided through casino revenues and property tax reimbursements.

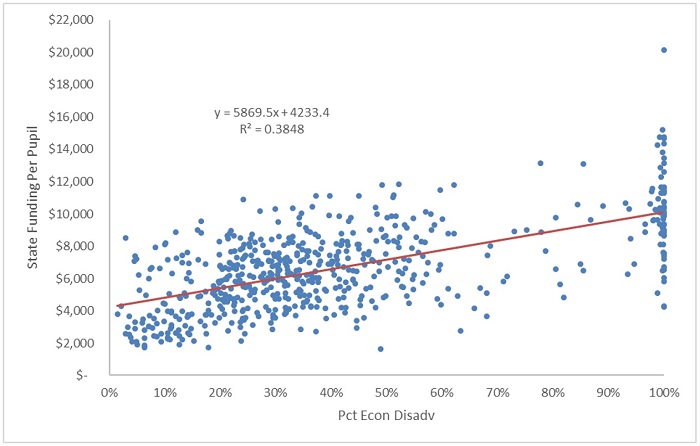
The chart below provides a higher-level look at the state’s allotment to all districts statewide. As indicated by the upward sloping line, districts with more economically disadvantaged students tend to receive more state funds. Of course, it’s not a perfect correlation—that would occur if the formula were premised only on disadvantaged enrollments (and ignored variables such as districts’ property wealth or special education pupils)—but, in general, the state’s formula is “progressive,” distributing more aid to districts with needier students.

Figure 1: Economically disadvantaged students versus state funding per pupil, Ohio districts, FY 2022

School funding preview pt 1 blog figure 1
How to read the chart: Each dot represents a school district’s economic disadvantaged enrollment and its state funding per student in FY 2022. The upward sloping line indicates that, as districts’ economically disadvantaged enrollment increases, state funding tends to increase, as well.

It should be emphasized that this progressive allocation at the state level has existed for many years. It’s not a novel invention brought about by the new formula. Ohio’s hybrid model—making school funding a joint state and local responsibility—has also existed for a long time. Over the past decade, the local-state share of overall education funding has been a near even split (roughly 43 to 43 percent), with the remainder coming from federal and non-tax sources. Overall, when looking at Ohio’s school funding system as a whole, Education Week awards the Buckeye State a solid B+ rating for funding equity.

What does the new formula do?

Broadly speaking, the new formula follows the previous one in many ways. The overall goal certainly remains the same—to deliver more state aid to districts in need of more financial assistance—and the new formula seems to accomplish this about as well as the old one. Moreover, the formula’s general design resembles the old framework—though there are some significant alterations beneath the hood.

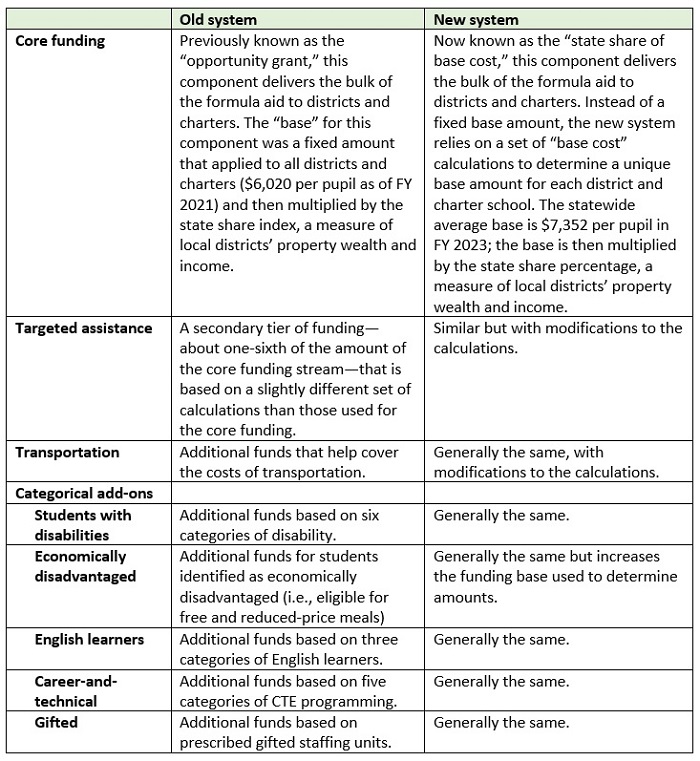
Table 2 shows an overview of the two system’s formula components. At the top is a core funding component that, in both models, delivers most of the state’s formula aid. However, the calculations are very different. We’ll discuss these changes in future pieces, but the two main things to know are that the new model’s base calculations (a) drive the much higher cost of the formula and (b) create a number of implementation challenges for policymakers. In addition to the core funding stream, the old and new systems include categorical “add-ons” that supply extra aid to districts serving students with greater needs. There also remains a supplemental tier of funding known as “targeted assistance,” as well as transportation dollars. While the general approach for these components is similar, some of the details are different and we’ll also touch on those in future pieces.

Finally, while not reflected in the table below, the new formula shifts to a direct funding approach for school choice programs. Rather than counting charter and most private-school scholarship students as district students and then transferring state funds for their education to their school of attendance, the state now sends dollars directly to schools of choice. This shift should reduce misconceptions about the source of charter and scholarship funding—they are supported by state dollars, not local—and eliminate some distortions in district formulas when choice students were included in their enrollments.

Table 2: An overview of Ohio’s previous and new funding formulas1

School funding preview pt 1 blog table 2
Note: Districts and charter schools are eligible for all of these funding components, with some exceptions for charters. Also, the old formula included relatively small funding components for K–3 literacy, along with funding based on third grade reading proficiency and graduation rates. Those components were eliminated in the new formula.

* * *

Some basic orientation to Ohio’s school funding system is critical for productive debates about the formula. We should first remember that in a “hybrid” local-state funding system, the state’s formula needs to counteract local inequities in wealth by sending more dollars to poorer districts. By and large, Ohio’s school funding formulas—both past and present—generally work to meet that goal. Big picture, the old and new formulas also have an overall framework that makes some reasonable sense. There is a core funding component, with categorical dollars for special-needs students added on top. But the devil’s in the details, and there are areas that require closer inspection. In the next piece, we’ll begin looking at several elements of the new formula—starting with the new “base cost” model—and see what we find.

  • 1Charters previously received 25 percent of their local districts’ targeted assistance; under the new formula they are not eligible to receive targeted assistance. While brick-and-mortar charters receive all of the categorical funding streams, e-school charters are not eligible for economically disadvantaged or English learner funding (in both the old and new systems).
view
Auditor teacher pensions blog image

Ohio auditor’s report on teacher pension system raises concerns, no illegalities

Aaron Churchill
1.18.2023
Ohio Gadfly Daily

In December, the Ohio Auditor of State released a special audit of the State Teachers Retirement System (STRS). The audit was conducted after a report commissioned by the Ohio Retired Teachers Association (ORTA) raised a number of concerns about the system that manages the pensions of current and retired teachers, the vast majority of whom are enrolled in a traditional “defined benefit” plan. The auditor reviewed STRS’s operations, and found “no evidence of fraud, illegal acts, or data manipulation.” That’s a relief, but it shouldn’t be reason for celebration.

The report touches on several worrying—though not unlawful—issues with the system’s structure, including the following:

Enormous unfunded liabilities. This, of course, isn’t a new or unknown problem with STRS and many other public pension systems. But it’s worth noting once again the enormity of STRS’s liability—the value of its assets versus the value of the retirement benefits promised to teachers with a DB pension plan. The auditor reports that, as of the end of June 2022, STRS had $83 billion in assets on hand but had racked up $105 billion in retirement liabilities. That results in a staggering $22 billion unfunded liability. Such a mountain of debt in a pension fund is of concern, as it could result in either benefit cuts or increased contributions into the fund from school districts and teachers. These are very real possibilities. On the benefits side, retirees have been understandably upset about the lack of cost-of-living adjustments (COLA) to their benefits in an age of sky-high inflation (a small, one-time 3 percent COLA was finally given last year after lengthy agitation). Had the system been in a better financial position, STRS may not have needed to suspend COLAs in 2017 after many years of granting them. And last fall, reports emerged that STRS was planning to petition lawmakers to increase the rate school districts pay into the pension fund, which is currently 14 percent of teacher payroll. If that goes through, schools will either have to reduce their current spending on education, or they’ll need to ask citizens to approve higher local tax rates to cover the increased retirement costs.   

Transparency around STRS’s alternative investments. Due to the nature of the concerns raised in the ORTA report, the auditor’s report spends a lot time discussing this part of the system’s portfolio. It’s important to remember that STRS isn’t your average investor. Not only does STRS invest in traditional stocks and bonds, it also puts billions into alternative investments such as real estate, private equity, hedge funds, and commodities. As of June 2022, STRS held approximately $30 billion in such alternatives. It wasn’t always this way: Following national trends, STRS has increased its allocation to alternatives (including both real estate and other non-traditional investments) from just 14 percent in 2001 to 34 percent in 2022. As the table below indicates, STRS’s alternatives—at least in FY 2022—delivered strong returns that outpaced stocks and bonds. Yet from 2016 to 2021, the auditor notes that STRS’s alternatives (excluding real estate) underperformed the broader stock market, returning 14.5 percent per year versus 18.0 percent for the Russell 3000 index.

Table 1: STRS’s investment returns and asset allocations

Auditor teacher pensions blog table 1
Source: State Teachers Retirement System of Ohio, Annual Comprehensive Financial Report (FY 2022)

The auditor’s report focuses on transparency challenges that come with alternatives—particularly private equity—something other analysts have discussed, as well. One issue is the opaque and perhaps exorbitant fees that private equity firms may be charging STRS (excluding real estate, most of its alternatives are in private equity). Because these agreements are deemed “trade secrets,” there is little way of knowing what fees STRS is paying, which can take a bite out of investment returns. The other issue raised by the auditor is the uncertain valuations of alternatives. Unlike publicly traded stocks, whose prices are transparent, the values of alternatives are more opaque and subjective. The auditor writes: “Determining real estate and private equity fund investments’ fair values…requires subjective, potentially biased valuations.” While the report notes external checks on valuing these investments, there is no way of knowing how much those assets are truly worth until they are sold. That should leave us less easy about the precise value of STRS’s assets at any given time.

Staff bonuses. Over the past year, another thing that has infuriated retired teachers is the decision by STRS to award $10 million in bonuses for system staff. The auditor didn’t find anything unlawful about the way STRS provided the extra pay. But one should ask what STRS was thinking when it doled out millions in extra compensation during a down year for the system’s investments, and when retirees were being asked to stretch their benefits without an adequate COLA. Administrators might say that this compensation structure, which already includes relatively high base salaries ($200,000 plus for some managerial level positions), helps retain highly-skilled investment professionals. But it’s always possible that the system could fare just as well with a more traditional investment strategy that doesn’t require expensive technical expertise. 

* * *

The state auditor concludes by offering several recommendations that would add more sunlight to the system. That would be welcome. But Ohio needs to do more than just nibble around the edges. It’s past time for the state to let go of its archaic “defined benefit” plan with its massive unfunded liabilities, the regular fiddling with teachers’ retirement benefits and contribution rates, opaque investments, and ill treatment of teachers who choose not stay in an Ohio classroom for their entire career. Instead, Ohio should transition teachers (new hires) to 401(k)-style “defined contribution” plans that most businesses and a few states now make their primary retirement plan (STRS offers a DC option, but it’s not the default and few enroll in it). From the state’s perspective, this approach would be easier and less costly to manage and wouldn’t accrue any unfunded liability. It might also make teachers less suspicious about the “system,” and would even make them wealthier in retirement. What’s not to like about that?

view
Passthrough funding SR image

Improving the accuracy of school funding data

Jeff Murray
1.31.2023
Ohio Gadfly Daily

Many states fund students who utilize school choice—public charter schools, private school voucher programs, interdistrict open enrollment, and the like—via “passthrough” mechanisms whereby per-pupil funding goes into a student’s home district coffers first before being transferred to the schools that students actually attend. Not only can such a funding model engender unnecessary animosity between education providers, but it can also muddy the water in vital analysis and discussion of revenue and spending. A new paper from Matthew Gardner Kelly of Penn State University and Danielle Farrie of the Education Law Center in New Jersey spells out the ways in which school funding data are complicated by passthroughs and calls for increased accuracy in funding data.

Using enrollment and fiscal stats from National Center for Education Statistics’s (NCES) Common Core of Data’s Local Education Agency Finance Survey, Kelly and Farrie find that traditional public school districts in forty-six states reported some form of passthrough payments in the 2018–19 school year. Amounts, means, and purposes varied greatly. These funds are included in the districts’ revenue and expenditure totals, but the students funded by them are excluded from enrollment totals. They term this per-pupil funding gap “artificial inflation” because the numbers make it look like districts are spending more money per pupil than they really are.

Kelly and Farrie illustrate the artificial inflation problem using their home states as examples. In Pennsylvania in 2018–19, federal data included $2.1 billion in funding designated for charter schools in district funding totals, even though the 143,259 charter students funded by those dollars were excluded from district enrollments. The “artificial inflation” average for the state was almost $1,900 per pupil, but that number masks a wide variation—from more than $25,500 per pupil in the Duquesne City School District to just $450 per pupil in Northern Tioga School District. These variations are driven by differences in the number of students attending charters, plus differences in the per-pupil amount of state dollars provided to districts via the funding formula.

Meanwhile, in New Jersey, interdistrict open enrollment was the largest passthrough category in 2018–19, totaling $1.3 billion. While there is less variation from district to district in this context, the most extreme example provided was a district that received nearly double the amount of state funding its 554 enrolled students were allotted, thereby inflating revenues and expenditures by nearly $14,000 per pupil. Again, state averages mask considerable diversity of data, and indeed, the analysts don’t tackle the issue that open enrollment typically includes both sent and received students, with money and students flowing both directions. Their bottom line, however, is well received: The more variables to be accounted for, the more accuracy can potentially be compromised.

Largely, this is “a researcher problem.” It’s not that districts are actually getting more—or less—money than they are eligible for. Considering it’s been more than thirty years since the first charter school opened its doors, this should be widely known among the research community. But Kelly and Farrie claim that the issue needs reiteration and explain how their colleagues can “avoid this inconsistency” when using federal data by subtracting passthrough dollars from total revenue, total state and local revenue, and total expenditure variables before calculating per-pupil data. They also encourage NCES to very specifically “provide more detailed enrollment data so that researchers can distinguish between membership counts that include or exclude students” associated with all of the various passthrough funding processes that exist in the vast majority of states. It is interesting to note that passthrough funding is excluded for certain school funding data (see page 42 of this Census Bureau document for details on Ohio). But until it is uniformly the case, Kelly and Farrie’s advice should be heeded by number crunchers everywhere.

SOURCE: Matthew Gardner Kelly and Danielle Farrie, “Misrepresented Funding Gaps in Data for Some States,” Educational Researcher (January 2023).

view

Getting ready for future employment opportunity: Evidence from Pittsburgh

Jeff Murray
1.26.2023
Flypaper

Reversing decades of economic struggle in America’s former manufacturing centers is a high priority for leaders in cities and regions across the nation. Many would like to see technology-focused industries lead such a resurgence, but do they have enough qualified workers? And if not, how can they increase those numbers? A new RAND study uses quantitative and qualitative data to investigate the state of play in Pittsburgh, including comparisons with Nashville and Boston, and highlights a few important implications for the K–12 and postsecondary education sectors.

In brief, the research team finds that the seven-county Pittsburgh metro area is decently positioned to capitalize on the anticipated growth of science- and technology-focused (STF) employment sectors, with some important caveats. Approximately 18 percent of Pittsburgh’s workforce is currently employed in STF occupations, ahead of both the national share and the share in the Nashville metro area (16 percent), but lagging the Boston metro area (21 percent). Additionally, a large proportion of Pittsburgh’s STF workers are in the health sector, which requires somewhat different skills than what analysts term “technician and production-related” industries, where the most job and wage growth is expected to occur. And while Pittsburgh’s STF workforce grew as a share of the overall labor force between 2015 and 2019, the pace of growth was too slow to fill all STF positions in that period, let alone new ones expected/hoped for in the future.

For any region to capitalize on future STF growth, such trends must change. The authors discount the long-term future of remote work as a solution, noting that the most desirable STF jobs are place-based (think robotics, autonomous vehicles, and other tech-related R & D work). Instead, one set of recommendations focuses on drawing new talent into the region. Suggestions include boosting wages in STF fields, investing in civic amenities and affordable housing (a fairly easy lift for Pittsburgh since its cost of living is relatively low already), and “addressing the racial disparities in public-facing systems (such as health care and lending) to demonstrate the region’s commitment to equity.” Analysts recommend that colleges and career training academies in the region—described as having plenty of potential to train the next generation—create scholarship programs for students and especially for learners of color. Interestingly, remote learning is highly valued by the analysts, even if remote working is seen as less likely in the future. Having employers committed to these efforts—and to hiring the folks who respond to the incentives—is also deemed important.

Another set of recommendations focuses on attracting existing workers and current students toward STF employment. Two barriers in this area are a lack of understanding of STF jobs and a lack of transparent data to illustrate how education and employment connect. The first barrier appears to be a legacy of Pittsburgh’s manufacturing past. That is, focus groups indicate that STF work is seen by many as a “dirty job” with limited future potential, akin to steel-working and coal mining. Recommendations to overcome such misinformation include STF-focused career counseling in high schools and targeted recruitment efforts by undergraduate programs and employers. Public information campaigns run by regional authorities explaining and extoling the jobs and their potential benefits could also be part of the solution.

The second barrier is exemplified by the fact that the state’s longitudinal data system collects only limited information on postsecondary education, does not connect to workforce data, and is difficult to access for both researchers and practitioners. It is also separated from important data collected on outcomes for participants in programs on Pennsylvania’s Eligible Training Provider List. As a result, officials in the Pittsburgh metro area are unable to assess the effectiveness of local education and training programs, describe actual STF career pathways for students, and demonstrate the real-world value of training programs.

Some of these changes are easier than others to implement. Employers are freer than municipal or county executives to allocate money and staff to recruitment efforts and internal culture changes. And attracting new residents of any stripe depends as much on the reception of the beckoning message as the form of the message itself. The report’s call for better data alignment and transparency between K–12, postsecondary education, and the workforce is important and should be among the easier recommendations to enact. For the most part, these are state-centered data systems—one entity with a lot of pull; there are plenty of roadmaps and examples for how to achieve the final product; and the benefits of a successful effort would transcend one industry and extend into any desired workforce pathway. Pittsburgh, of course, isn’t the only region struggling to align employer needs with workers’ skills. For community leaders working on these types of efforts, this report offers an important grounding in where to start.

SOURCE: Melanie A. Zaber et al., “Assessing Pittsburgh's Science- and Technology-Focused Workforce Ecosystem,” RAND Corporation (January 2023).

Fordham Logo

© 2020 The Thomas B. Fordham Institute
Privacy Policy
Usage Agreement

National

1015 18th St NW, Suite 902 
Washington, DC 20036

202.223.5452

[email protected]

  • <
Ohio

P.O. Box 82291
Columbus, OH 43202

614.223.1580

[email protected]

Sponsorship

130 West Second Street, Suite 410
Dayton, Ohio 45402

937.227.3368

[email protected]