Mobile Navigation

  • National
    • Policy
      • High Expectations
      • Quality Choices
      • Personalized Pathways
    • Research
    • Commentary
      • Gadfly Newsletter
      • Flypaper Blog
    • Events
    • Scholars Program
  • Ohio
    • Policy
      • Priorities
      • Media & Testimony
    • Research
    • Commentary
      • Ohio Education Gadfly Biweekly
      • Ohio Gadfly Daily
  • Charter Authorizing
    • Application
    • Sponsored Schools
    • Resources
  • About
    • Mission
    • Board
    • Staff
    • Career
Home
Home
Advancing Educational Excellence

Main Navigation

  • National
  • Ohio
  • Charter Authorizing
  • About

Ohio Menu

  • Topics
    • Accountability & Testing
    • Advanced Education
    • Career & Technical Education
    • Charter Schools
    • Curriculum & Instruction
    • ESSA
    • Evidence-Based Learning
    • Governance
    • Personalized Learning
    • Private School Choice
    • School Finance
    • Standards
    • Teachers & School Leaders
  • Research
  • Policy
  • Commentary
    • Ohio Gadfly Newsletter
    • Ohio Gadfly Blog
    • Events

The Education Gadfly Weekly

Sign Up to Receive Fordham Updates

We'll send you quality research, commentary, analysis, and news on the education issues you care about.
Thank you for signing up!
Please check your email to confirm the subscription.

Ohio Gadfly—Parents deserve accurate report cards

Volume 20, Number 4
2.13.2026
2.13.2026

Ohio Gadfly—Parents deserve accurate report cards

Volume 20, Number 4
view
Cincy accurate report cards Fordham version blog image
Standards & Accountability

Parents deserve accurate report cards. Cincinnati Public Schools is making it happen.

Most parents assume that if their children are earning A’s and B’s, they must be meeting grade-level standards. After all, A is the highest grade possible. Getting a B is the next best thing. If students weren’t meeting the school’s expectations—if they were academically behind and at risk of falling further—they wouldn’t bring home such good grades.

Jessica Poiner 2.13.2026
OhioOhio Gadfly Daily

Parents deserve accurate report cards. Cincinnati Public Schools is making it happen.

Jessica Poiner
2.13.2026
Ohio Gadfly Daily

How to strengthen Ohio’s college and career ready measure

Aaron Churchill
2.17.2026
Ohio Gadfly Daily

A deep dive into first-time pass rates on Ohio’s Foundations of Reading licensure exam

Jessica Poiner
2.11.2026
Ohio Gadfly Daily

Does missing school harm students even when they aren’t “chronically absent”?

Jeff Murray
2.17.2026
Ohio Gadfly Daily

First, do no harm: The academic impacts of grade inflation on long-term outcomes

Jeff Murray
2.12.2026
Flypaper
view
Ohio report card - CCWMR blog image

How to strengthen Ohio’s college and career ready measure

Aaron Churchill 2.17.2026
Ohio Gadfly Daily
view
TPPs licensure pass rates blog image

A deep dive into first-time pass rates on Ohio’s Foundations of Reading licensure exam

Jessica Poiner 2.11.2026
Ohio Gadfly Daily
view
Chronic absenteeism measurement SR image

Does missing school harm students even when they aren’t “chronically absent”?

Jeff Murray 2.17.2026
Ohio Gadfly Daily
view
Balloons in a classroom

First, do no harm: The academic impacts of grade inflation on long-term outcomes

Jeff Murray 2.12.2026
Flypaper
view
Cincy accurate report cards Fordham version blog image

Parents deserve accurate report cards. Cincinnati Public Schools is making it happen.

Jessica Poiner
2.13.2026
Ohio Gadfly Daily

Most parents assume that if their children are earning A’s and B’s, they must be meeting grade-level standards. After all, A is the highest grade possible. Getting a B is the next best thing. If students weren’t meeting the school’s expectations—if they were academically behind and at risk of falling further—they wouldn’t bring home such good grades.

Right?

Wrong. In fact, in communities all across the nation, misleading report cards are coming home. A 2023 study published by Gallup and Learning Heroes found that 79 percent of parents say their child receives traditionally good grades, mostly B’s or better, on their report cards. Nearly nine in ten believe their child is at or above grade level in reading and math. Yet, results from state exams as well as the National Assessment of Educational Progress show that large percentages of students actually aren’t on grade level in reading and math. In fact, in some cases, they’re several years behind.

How is it possible for kids who are behind to come home with A’s and B’s on their report cards? Grade inflation is partly to blame. So is social promotion. But a significant part of the disconnect between grades and true proficiency is the fact that report cards reflect more than just academic mastery. When teachers assign grades, they also consider measures like growth, participation, and effort. These are important touchstones that can signal a student’s readiness for college, career, and adulthood. But they can also obscure poor academic performance from parents and caregivers.

Concealing poor performance has consequences. Struggling students who are passed along from grade to grade will continue to fall further behind their peers. Despite their A’s and B’s, they won’t be ready for college or the workplace. And those same A’s and B’s can prevent families from recognizing that their kids need help. A mom who thinks her son is doing well in math because of the B on his report card is unlikely to sign him up for tutoring. A dad who believes his daughter is reading on grade level won’t go searching for tips on how to help at home. When parents rely solely on inflated report card grades for information, they miss the warning signs that more reliable measures, like standardized exams, are designed to identify—and that can have both short- and long-term impacts on their children.

We know that families are an integral part of boosting student achievement, which means it’s time to start giving them all the pieces of the puzzle. Report cards are helpful, but can obscure academic struggles. State test results are crucial, but they come just once a year. Families need consistent and complete data. And in one of Ohio’s largest school districts, it seems they’re about to get it.

In November, board members at Cincinnati Public Schools (CPS) approved a change that requires the district to include students’ current reading and math achievement, expressed in terms of grade level, on their report cards at least twice a year. Beginning in the 2026–27 school year, parents of students in grades K–6 can expect to see statements like “reading at fourth grade level” on their student’s report cards in addition to familiar letter grades. Parents of middle and high school students will also be given this information when the relevant data are available. Included will be the date and source of the information (for example, the fall 2026 administration of an iReady assessment). 

According to local news coverage, parents pushed for this change. Thanks to their efforts, thousands of families will begin to get reliable updates about their students' reading and math levels, along with course grades determined by teachers. For some families, this might be the first time they realize that the A’s and B’s their child brings home don’t necessarily mean they’re achieving on grade level. And while that information alone won’t change anything, knowledge is power. Empowered parents can meet with teachers, obtain out-of-school help, offer support at home, and explore other schooling options, all of which can turn the tide for a struggling student.

CPS board members—especially Ben Lindy, who introduced the resolution—deserve kudos, too. This level of transparency could spark some tough questions for teachers and school administrators. Going forward, the district will be more accountable to families than it was before.

Hats off to Cincinnati for putting students first. Here’s hoping other districts in Ohio and around the country follow suit.

This post was originally published by RealClear Education under the title “Grade Inflation Is Concealing Poor Student Performance”.

view
Ohio report card - CCWMR blog image

How to strengthen Ohio’s college and career ready measure

Aaron Churchill
2.17.2026
Ohio Gadfly Daily

State report cards have long provided transparency and accountability for student learning. The current framework has commendable features, yet policymakers should make sure that the system functions well and meets intended goals. This is the third in a series that examines report card elements that could use refinement (previous pieces covered chronic absenteeism and early literacy).

Recognizing that too many students graduate ill-prepared for their next steps, Ohio policymakers have made increased college and career readiness a priority. Within this larger effort, the state introduced a readiness measure on its school report card nearly a decade ago to encourage schools to provide rigorous preparation beyond what is required for high school graduation.

As initially implemented, the measure (then known as “Prepared for Success”) was overly focused on college-ready metrics, such as ACT, SAT, AP, and IB exam scores. In 2021, lawmakers rebooted the component with new indicators added to the mix, including career-tech assessments, work-based learning, and military enlistment. Today, students who meet one of 11 (!) possible indicators are deemed “ready,” and count toward their schools’ “College, Career, Workforce, and Military Readiness” rating.

Revamping the measure was a smart move, but how is the next iteration functioning?

As a starting point, Ohio does a better job differentiating schools than the former model, which flunked nearly everyone. In 2024–25, the first year a star rating was assigned for the measure, 33 percent of districts received 1 or 2 stars and 29 percent 4 or 5 stars, leaving 38 percent at 3 stars.[1]

But a deeper-dive analysis reveals concerns about how accurately Ohio identifies “college and career ready” students, especially along the career-oriented dimension. This in turn raises the question of whether the ratings provide a reliable and honest portrayal of student readiness.

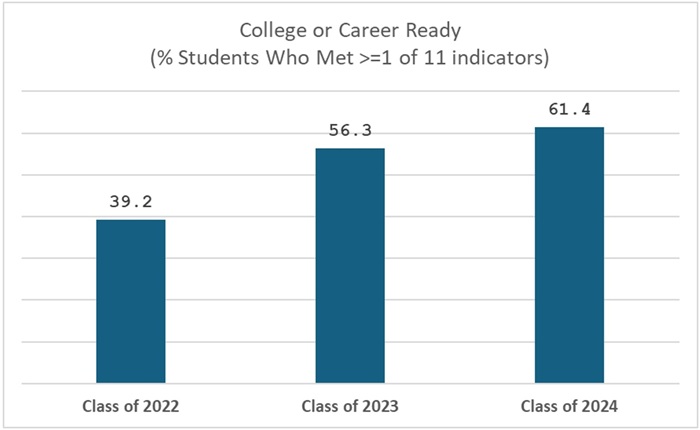
Figure 1 shows the percentage of students deemed “ready” by meeting an indicator listed in Figure 2. The statewide readiness rate jumped from 39 to 56 percent between 2022 and 2023, and increased again to 61 percent for the class of 2024. The current number sits below the state’s 88 percent graduation rate, indicating that the readiness bar is—as it should be—higher than the basic graduation standard. Yet to put the rate into additional context, it’s roughly double Ohio’s longstanding college-completion rate (associate degree or higher) of roughly 30 percent.

Figure 1: Percentage of Ohio students deemed college and career ready, classes of 2022–24

Ohio report card - CCWMR blog figure 1

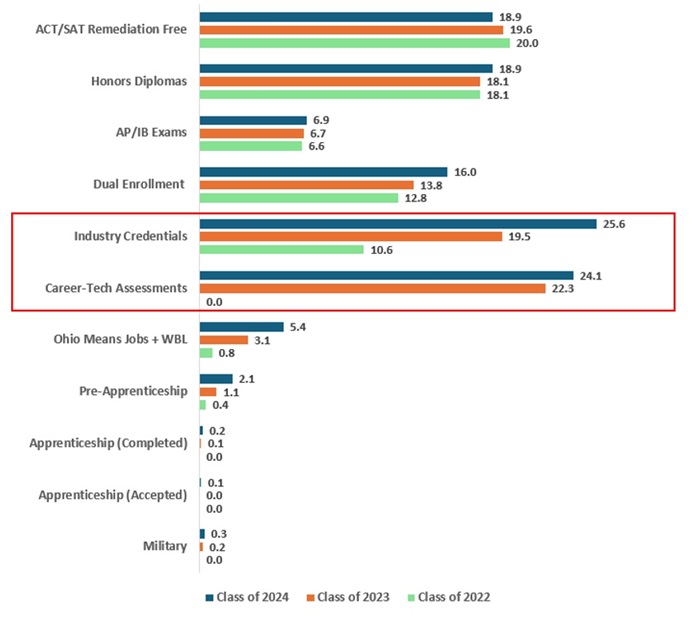
Figure 2 breaks down the overall number by the various indicators, showing that the recent jump is largely attributable to the “career-ready” measures. Among the class of 2024, 26 percent met the industry credentials indicator—more than double the rate from a couple years ago—while 24 percent passed three or more career-technical assessments, whereas no students in the class of 2022 were reported as passing three or more.[2] These two rates have risen not only in response to the report card, but also to the state’s new graduation requirements, which allow low-performing students to receive diplomas through an alternative route that includes credentials and career-tech assessments as options.

Figure 2: Percentage of students meeting various college and career ready indicators

Ohio report card - CCWMR blog figure 2
Notes: For more detail about the indicators, see this document from the Ohio Department of Education and Workforce. Students can meet more than one indicator and, if doing so, are counted more than once; for instance, a student achieving the ACT remediation free score and passing AP exams would be counted in both categories for purposes of Figure 2. WBL = work based learning (250+ hours).

The rise in the career-based numbers could be a positive, except that we know many students have been accumulating credentials of questionable value. The most-earned credentials among the class of 2024 were basic first aid and job safety certificates, as well as a customer service and introductory retail certificate, each of which can be attained relatively easily. Students in urban school districts have been especially apt to collect credentials such as these, likely in an effort to meet alternative graduation requirements. Meanwhile, there are more than 200 career-technical exams, and nothing is known publicly about which exams students are passing or their rigor.

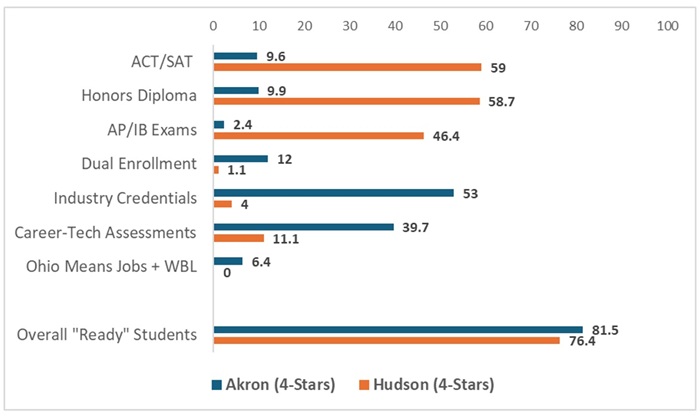
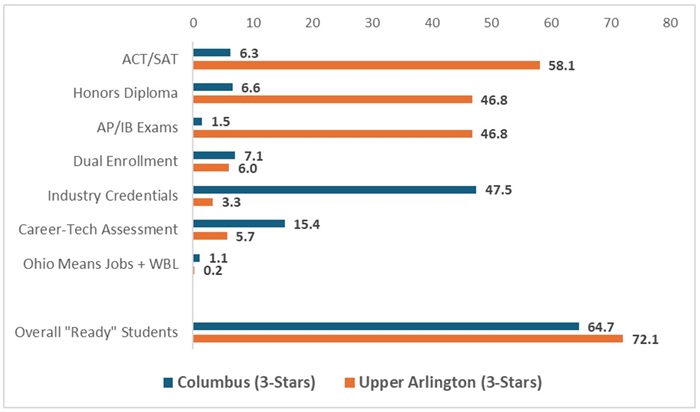
Incorporating the career-ready indicators on an equal basis as ACT or SAT scores has yielded some head-scratching results. The charts below provide illustrations. In Summit County, both Akron and suburban Hudson school district received 4-star college and career readiness ratings. But Hudson earned that rating through the tougher college-ready metrics, while Akron did so through the softer career indicators. In Central Ohio, Columbus and suburban Upper Arlington received 3-star ratings, but Upper Arlington did so through the college-ready metrics and Columbus mostly through credentials.

Figure 3: Percentage of students who meet various indicators, Akron versus Hudson

Ohio report card - CCWMR blog figure 3

Figure 4: Percentage of students who meet various indicators, Columbus versus Upper Arlington

Ohio report card - CCWMR blog figure 4
Note: Less than 1 percent of students in all four districts were reported as meeting the three apprenticeship indicators or enlisted in the military. Schools with low readiness rates receive a three-star rating if their rate improves by 15 or more percentage points relative to the year prior. None of the four districts received this bump.

It’s hard to believe that Columbus—where student proficiency is abysmal—is equally good at preparing students as Upper Arlington, or that Akron does as well as Hudson. But that’s the impression from the report card. The problem, which we’ve warned about before, lies in the uneven rigor between the “career-ready” and “college-ready” measures. Passing three career-tech exams is not nearly as challenging as passing three AP exams. Attaining a retail or job-safety credential is nowhere near as demanding as earning a college-ready score on the ACT or SAT. But under the current structure, they are all are treated equally.

Career-focused measures should continue to be included in the report card, but state lawmakers should take two steps to ensure workforce readiness is accurately measured:

1. Count students as “ready” only if they achieve proficiency on the state Algebra I and English II assessment. Basic academic proficiency is the building block of both college and career readiness. Yet under current policy, students who are not proficient can still be deemed “ready” through the career-based metrics. Rather than ignoring academic deficiencies, Ohio should only count students as “college and career ready” when they achieve proficiency on the two key state high school exams (and meet one of the readiness indicators, as under current policy).[3]

2. Consolidate the credentials and technical-exam indicators, so that students have to meet both (in the same career cluster) to be counted as meeting the indicator. “Career readiness” takes more than just earning a credential. It also requires coursework and demonstrations of technical expertise on an objective exam. Rather than allowing an “either-or” approach, Ohio should require students on career-technical pathways to meet both the credentials and technical exam metrics (or complete one of the other existing career indicators, such as an apprenticeship).

Ohio’s college and career ready measure should challenge schools to equip students with the knowledge and skills needed to succeed after high school. The “college-ready” side of the state’s current measure is sound, but the “career-ready” side still needs work. With strengthening, the state would provide a better gauge of college and career readiness in Ohio schools.


[1] Data for the component were reported for the prior two years, but no ratings were assigned.

[2] It’s possible that some students in the class of 2022 passed assessments, but the data were just not reported by schools (these exams were not used in the state’s former Prepared for Success measure).

[3] Adding this condition is unlikely to impact measures such as ACT/SAT, honors diplomas, and AP/IB exams, as the vast majority of students meeting them are likely to have achieved proficiency on state exams.

view
TPPs licensure pass rates blog image

A deep dive into first-time pass rates on Ohio’s Foundations of Reading licensure exam

Jessica Poiner
2.11.2026
Ohio Gadfly Daily

When Ohio lawmakers established a science of reading initiative in 2023, they included two provisions aimed at ensuring that higher education institutions are training teacher candidates in scientifically-based reading instruction. The first focused on inputs. Lawmakers tasked the Ohio Department of Higher Education (ODHE) with conducting audits of teacher preparation programs to determine if their course materials and instruction are aligned with the science of reading. Findings from the first audit were released in December and showed that some programs still have work to do.

The second provision focused on outputs. By requiring ODHE to develop a public dashboard that reports first-time and overall passage rates on the Foundations of Reading licensure exam, policymakers sought to measure how effectively programs are preparing future educators. State law requires most teachers—anyone looking to teach in grades pre-K through eight—to pass the Foundations of Reading exam prior to receiving an Ohio teaching license. The test evaluates a candidate’s knowledge of reading development, comprehension, instruction, and assessment. And by all accounts, it does a good job. NCTQ, which has a long track record of evaluating preparation programs and considerable expertise in reading science, considers it to be a strong exam. If an institution has a high pass rate, then it’s reasonable to assume that the educators it produces are well-prepared to teach reading.

There’s a difference, though, between overall and first-time pass rates. Prior to the early literacy reforms of 2023, Ohio only tracked overall pass rates. Those numbers include any teacher candidate who passes the exam, regardless of how many attempts it took them to do so. First-time pass rates, on the other hand, identify the number of students who passed the test on their first try. Candidates who need more than one attempt to pass the test can still go on to be excellent teachers. But first-time pass rates are an important marker of how rigorously preparation programs are training aspiring educators.

ODHE’s dashboard is now up and running, giving Ohioans their first glimpse at first-time pass rates for 49 preparation programs. The dashboard itself could use some work—more on that later—but the data it contains are a key indicator as to how well programs are training future teachers in reading instruction. Here are the major takeaways.

1. The statewide first-time pass rate ticked up in 2024.

In 2023, the statewide pass rate among first-time test takers was 64.6 percent. In 2024, it rose to 69.2 percent. That’s an increase of nearly 5 percentage points. The number of first-time test takers also climbed, from nearly 2,600 in 2023 to over 3,200 in 2024.

2. More than half of Ohio institutions earned a higher first-time pass rate in 2024 than the year prior.

Twenty-five institutions earned a higher first-time pass rate in 2024 than in 2023. Some of those increases were large—like the University of Mount Union, which jumped a whopping 20 percentage points. Others were much smaller. Twelve institutions registered lower passing rates in 2024, while another two remained flat.[1]

3. Four institutions had first-time pass rates at or above 80 percent in both 2023 and 2024.

The College of Wooster, Cedarville University, John Carroll University, and Baldwin-Wallace University all earned first-time pass rates at or above 80 percent in both years. All four are private universities. They’re also relatively small, with undergraduate enrollment ranging from 1,600 to 4,200 students. (For comparison, Ohio State has nearly 47,000 undergraduates enrolled at the Columbus campus.) Kudos to the College of Wooster, which earned a 100 percent pass rate in 2024 among its 11 first-time test takers. Another four institutions—Indiana Wesleyan University, University of Mount Union, Ohio Dominican University, and Otterbein University—earned pass rates above 80 percent in 2024 but not 2023.

4. Two universities had Ohio’s lowest first-time pass rates in both 2023 and 2024.

In 2023, the University of Rio Grande registered a pass rate of just 35 percent, low enough to earn it last place among the 49 institutions. Heidelberg University clocked in at second-to-last with a pass rate of 45 percent. In 2024, these institutions remained in the bottom two spots but flipped places: Heidelberg University had the lowest pass rate—an abysmal 25 percent—while the University of Rio Grande earned a 45 percent.

5. More than half of Ohio’s institutions had large discrepancies between their first-time and best-attempt pass rates in 2024.

Twenty-seven institutions had best-attempt pass rates that were 10 to 29.9 percentage points higher than their first-time pass rates. Some of the state’s biggest preparation programs were in this group, including Kent State University, Miami University, and Wright State University, all of which had discrepancies of more than 20 percentage points. Another three institutions (Lourdes University, Marietta College, and Ohio Northern University) posted differences of more than 30 percentage points. The largest gap was at Heidelberg University, where the first-time pass rate of 25 percent and the best-attempt pass rate of 87.5 percent produced a whopping 62 percentage point difference.

6. Four of the state’s ten biggest preparation programs—those that account for the largest share of first-time test takers—had first-time pass rates below 70 percent in 2024.

Chart 1 identifies the ten institutions with the most first-time test takers in 2024. Together, they account for a majority (nearly 61 percent). Four of them—Ohio State University, Bowling Green State University, Miami University, and Wright State University—posted pass rates below 70 percent. On a letter grade scale, that would be a D. The remaining six fell between 71 and 79 percent, which would be good enough to earn a C.

Chart 1. Passing rates at the ten institutions with the most first-time test takers in 2024

TPPs licensure pass rates blog chart 1

7. Most of the institutions that were identified as “Not In Alignment” on the state’s science of reading audit fell below the statewide average first-time pass rate in one of the last two years.

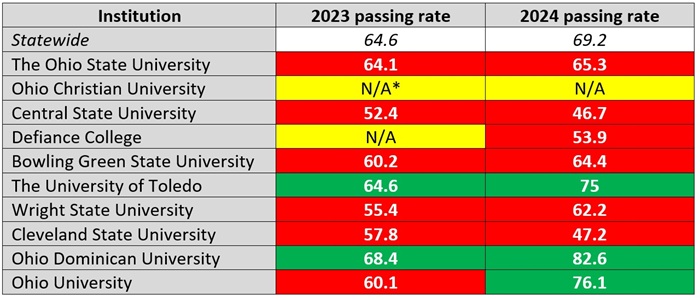
Chart 2 identifies 2023 and 2024 first-time pass rates at the ten institutions that earned a designation of Not In Alignment on ODHE’s science of reading audit. Institutions shaded in red failed to meet the state average, while those in green met or surpassed it. The University of Toledo, Ohio Dominican University, and Ohio University are the only ones that performed better than the state average in 2024.

Chart 2. First-time pass rates at institutions identified as out of alignment on Ohio’s science of reading audit
TPPs licensure pass rates blog chart 2

*Institutions marked N/A did not have enough information available to determine a pass rate.

***

Overall, the data on reading licensure test pass rates are a mixed bag. Some institutions are doing a solid job of ensuring that their teacher candidates have a strong foundation in reading instruction. Others, not so much. The big question now is where Ohio should go from here.

First, state officials should work on improving the dashboard. The current version has limited capabilities to sort and analyze data, which makes it difficult to compare results for a single institution over time or to compare individual institutions or groups. Making the database more interactive and user-friendly—and allowing users to download the data to sort on their own—would be a good step forward.

Second, state officials should consider keeping all of Ohio’s early literacy data in one place. Right now, audit results and the pass rate dashboard can be found on ODHE’s website. Everything else that’s science-of-reading related is housed on the Department of Education and Workforce’s website or the state’s report card page. Creating an annually-updated site that tracks all of Ohio’s early literacy reform data in one easily-accessible place would give policymakers and the public a much simpler way to track progress.

Third—and most importantly—policymakers should discuss how to support institutions with abysmally low first-time pass rates. The Foundations of Reading exam is a critical part of ensuring that teachers are well-prepared to teach reading when they enter the classroom. And yet, according to ODHE’s new dashboard, there are at least seven institutions where fewer than 60 percent of first-time test takers passed the exam in 2024. On a letter-grade scale, that’s an F.

Prospective teachers—many of whom have taken out student loans to pay for their education—deserve better from their training programs. So do the students these educators will one day teach.



[1] Ten institutions didn’t have enough data to calculate a passing rate in either 2023 or 2024.

view
Chronic absenteeism measurement SR image

Does missing school harm students even when they aren’t “chronically absent”?

Jeff Murray
2.17.2026
Ohio Gadfly Daily

Researchers, policymakers, educators, and journalists have focused copious amounts of attention on student absenteeism data in the years since a pandemic-era surge that is only now beginning to moderate. Of particular concern is chronic absenteeism, nearly universally defined as missing at least 10 percent of school (generally 18 days) for any reason, and the potential academic harm missing so much school could cause. Research protocols, early warning systems, accountability structures, and considerable resource allocations to identify and reduce chronic absenteeism have all been calibrated with this definition as their guiding principle. However, a trio of researchers from the University of Michigan hypothesize that other measures might be more accurate in predicting negative academic outcomes—and indeed might reset the definition of “chronic absenteeism” in that regard. They set out to test their theory in a new working paper.

The researchers use data on nearly 8,900 students who were enrolled in the Boston Public Schools (BPS) pre-K program starting in the 2007–08 to 2009–10 school years. Students were followed through their eighth grade year (which occurred between 2016–17 and 2018–19). Administrative records from district and state sources include demographics, details of attendance and absences, and English language arts and math standardized test scores. The analytic sample was 48 percent female and racially/ethnically diverse (45 percent Hispanic, 29 percent Black, 15 White, 9 percent Asian, 3 multiracial/other). Roughly half of students spoke English as their home language, 30 percent Spanish, and 21 percent a language other than those. Approximately 58 percent of students were eligible for free or reduced-price lunch.

The researchers used the administrative absences data provided by BPS—total days absent, total unexcused absences (like oversleeping or going to work), and total excused absences (like family vacations or a dental appointment)—as well as calculating a novel student absence rate. That is, dividing each student’s number of total absence days by the total days the student was enrolled during a given year. This helped account for variation in enrollment length for students transferring into the district at different times of the year.

The researchers then evaluated the diagnostic accuracy of six different absenteeism measures over time—total days excused, total days unexcused, total days for all reasons, excused absence rate, unexcused absence rate, total absence rate—in predicting whether a student would score at the lowest category of achievement (“not meeting expectations”) on Massachusetts’ state math and ELA assessments in eighth grade. They found minimal predictive value of absenteeism rates in the early grades, when rates are largely driven by excused absences…and a long way from eighth grade test day! But by the upper elementary grades (when unexcused absences began to predominate), the predictive strength steadily increased. Perhaps not surprisingly, eighth grade absenteeism data was most predictive of eighth grade test performance. Across all years, the researcher-created absence rates and the BPS total-days-absent measures proved the most predictive of academic outcomes.

And what of “chronic” absenteeism? Their analysis found that—rather than the traditional 10 percent of the school year/18-day cutoff that generally denotes chronic absenteeism today—academic harm from absences became highly likely closer to the 7 percent of time enrolled point for most students and ranged from six to 17 days, depending on grade level, test subject, length of time enrolled, and absence measure used. In other words, the default definition of “chronic” absenteeism is likely too generous. More importantly, the warning sign for schools to intervene to mitigate academic harm from chronic absenteeism comes about quite a bit sooner for many students than schools currently believe.

In an interview, research team leader Tiffany Wu says that “no single absence cutoff is likely to serve as a strong standalone predictor of academic risk.” But the team’s report recommends schools track both absence rates and total absences—if staff resources allow—and that leaders and policymakers seriously consider lowering the cutoffs that define “chronic” absenteeism no matter how it is measured. Because data show that early warning systems should be signaling that intervention is needed far sooner than they do now in order to prevent maximum academic harm.

SOURCE: Tiffany Wu, Christina Weiland, and Thomas Staines, “The Chronic(les) of Absenteeism Measurement: Unpacking the Many Measures of Attendance and Evidence for a Lower Chronic Absenteeism Threshold,” Annenberg Institute at Brown University Working Papers (January 2026).

view
Balloons in a classroom

First, do no harm: The academic impacts of grade inflation on long-term outcomes

Jeff Murray
2.12.2026
Flypaper

There’s plenty of evidence that average grades, GPAs, and graduation rates have gradually been rising—and fewer kids have been failing—in recent years. What impact is this having on students? A recent University of Maryland working paper helps answer that question by examining two large groups of high school students.

The four-person research team looks at data from all high schools in the Los Angeles Unified School District (LAUSD) and from all public high schools in the state of Maryland. The LAUSD dataset covers more than 985,000 high school students between 2004 and 2013. Although it lacks demographic information, it does include annual end-of-year test scores, allowing for detailed measurement of grade inflation. The Maryland dataset, by contrast, contains far fewer end-of-course test scores—only algebra, geometry, and either ninth or tenth grade English—but includes detailed demographic information on students, as well as data on their college enrollment and labor market participation after graduation. It covers more than 1.6 million high school students between 2013 and 2023.

The researchers constructed two measures of teacher-specific grade inflation. The first is “mean grade inflation,” which uses a comparison between end-of-course test scores and class grades to determine how much a given teacher inflates the average student’s class grade. This metric includes controls for a number of student characteristics and is bias-checked against students’ past and future scores to account for as many unobservable influences on test performance as possible. The second is “passing grade inflation,” a novel measure that determines how likely a teacher is to pass a student who received an F grade in the class. That is, a binary “yes, they did” or “no, they didn’t” pass students who scored below the grading threshold for failing.

The analysis finds that the two types of grade inflation have very different impacts on students. Mean grade inflation has an overall negative effect, as it lowers future test scores, reduces the likelihood of students graduating from high school, decreases college enrollment, shrinks individuals’ earnings, and more. For example, having math and English teachers who are, on average, 1 standard deviation higher in mean grade inflation decreases student test scores in the next year by approximately 0.03 standard deviations, reduces students’ likelihood of graduating high school by 0.8 percentage points, and lowers students’ likelihood of ever taking the SAT by 0.8 percentage points. Moreover, although the negative effects are similar for students of all abilities, the grade retention and SAT-taking impacts are worse for higher-performing students.

Passing grade inflation, by contrast, conveys more positive impacts, such as reducing the likelihood of students being held back a grade, increasing the likelihood of high school graduation, and boosting initial enrollment in two-year colleges. Having math and English teachers who are, on average, 1 standard deviation higher in passing grade inflation increases students’ next-year test scores by 0.01 standard deviations and raises the likelihood of graduating high school and taking the SAT by 0.6 and 0.7 percentage points, respectively. These positive impacts are strongest for students in the bottom of the eighth of the grade GPA distribution.

The researchers don’t make any recommendations for policy or practice, but the implications of their findings are clear. Two different forms of grade inflation are occurring in Los Angeles and Maryland—via deliberate teacher actions—with a set of direct and measurable short- and long-term academic impacts on students. Mean grade inflation is, overall, detrimental to students, while passing grade inflation is somewhat more defensible. If grade inflation can be curbed, the issue is moot. But if it continues in Los Angeles or Maryland or (likely) everywhere else, then teachers, principals, and stakeholders need to be aware of those impacts and calibrate their inflationary behaviors to minimize negative consequences for students.

SOURCE: Jeffrey T. Denning, et al., “Easy A’s, Less Pay: The Long-Term Effects of Grade Inflation,” University of Maryland Working Papers (October 2025).

Fordham Logo

© 2026 The Thomas B. Fordham Institute
Privacy Policy
Usage Agreement

National

P.O. Box 110
Burke, VA 22009

202.223.5452

[email protected]

Ohio

P.O. Box 82291
Columbus, OH 43202

614.223.1580

[email protected]

Sponsorship

130 West Second Street, Suite 410
Dayton, Ohio 45402

937.227.3368

[email protected]