In fall 2014, Ohio introduced a report card element that gauged how well-prepared students are for college and career. Known as Prepared for Success, this component aimed to go beyond basic graduation rates to look at more rigorous gauges of post-secondary readiness.
There was and continues to be a need for such a report card measure. Due to the relative ease of meeting diploma requirements, graduation rates have become a less reliable measure of readiness. Based on ACT/SAT data and Ohio’s remediation-free standards, we know that fewer than one in four of students have the full academic preparation needed for college coursework. Less than one in ten high school students have historically completed an industry credentials program. Yet graduation rates have consistently exceeded 80 percent statewide.
In the most recent revision of the report card, state lawmakers made significant changes to Prepared for Success. They first of all changed its title to College, Career, Workforce, and Military Readiness (CCWMR), which reflects updates that happened under the hood. The legislature created six additional ways that students can demonstrate readiness, including military enlistment or completing an apprenticeship. These options were added to the five existing readiness indicators, which include achieving college remediation-free scores or earning industry credentials.
Because of these changes, along with new data requirements, legislators held off on making CCWMR a rated element and incorporating results into high schools’ overall ratings. Consistent with statute, the Ohio Department of Education and Workforce (DEW) has for the past few years reported data for the measures included in CCWMR—including numbers used in this piece—but just haven’t assigned component ratings. Lawmakers, however, included provisions that require DEW to propose rules for making it a rated component, which must then be approved by a legislative committee known as JCARR.
Last week, DEW released proposed rules for implementing CCWMR. The agency wisely calls for CCWMR to be a rated element starting in 2024–25, and to be factored into overall ratings. Fully incorporating the component into the report card will signal to parents and communities the importance of readying young people for college and career. It also incentivizes schools to work to ensure that all students meet state goals for readiness.
So far so good, but as policy wonks often note, the devil’s in the details. There remain some technical issues that policymakers need to address to ensure the rigor of this component. They include the CCWMR grading scale, how annual improvement is calculated, and the rigor of the underlying measures. How these issues are handled could make or break the component, and the rest of this piece discusses each of them in turn.
Grading scale
The DEW rules propose a grading scale for CCWMR—a necessary step for implementing it as a rated component. The design of this scale is critical, as it sets the targets and expectations for schools. On the one hand, the scale should establish ambitious performance goals and meaningfully differentiate schools, both recognizing excellence and flagging underperformance. On the other hand, the scale should also set targets that are achievable and consistent with the available data. A balanced approach—one that is both rigorous and realistic—is most likely to drive improved student preparedness.
The DEW rules propose the following scale for CCWMR: To receive a five-star rating, a school must have a post-secondary readiness rate of at least 80 percent; four stars = 70–80 percent; three stars = 60–70 percent; two stars = 50–60 percent; and one star = 0–50 percent. The readiness rate refers to the percentage of a school’s four-year graduation cohort who meet at least one of the eleven readiness indicators within CCWMR.
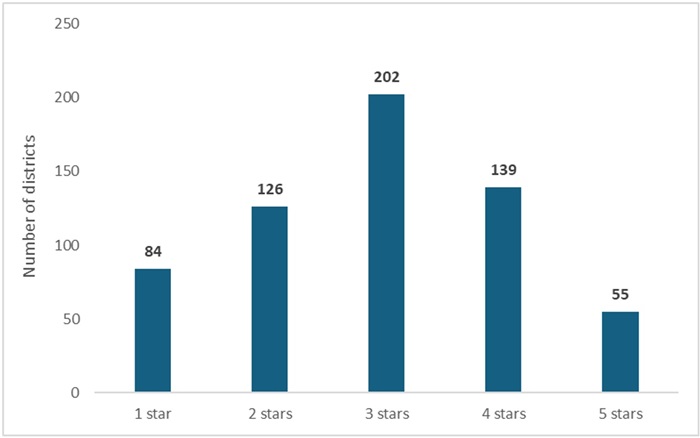
At first glance, this framework—and the ratings that it would yield based on 2023–24 data—seems sensible. At a district level, figure 1 shows that the most frequent rating is a three-star rating, with roughly equal numbers of districts in the one- and two-star categories as are in the four- and five-star categories (this chart doesn’t account for the improvement element discussed later).
Figure 1: CCWMR ratings with no improvement dimension based on districts’ 2023–24 readiness rates

This baseline model, however, does not consider that readiness rates are likely to rise in the future. We’ve already seen a remarkable increase in this rate from 2022–23 to 2023–24, as the median district CCWMR readiness rate rose from 43 to 65 percent. Further increases are likely as schools pay more attention to these measures—some of which are new to the report card system—and reporting improves. Schools are also likely to respond to the report-card incentive and more strongly encourage students to meet one of the eleven indicators. If rates continue to rise, the ratings distribution will shift rightward—more districts receiving higher ratings—as the proposed grading scale remains fixed.
Recommendation: To account for likely increases in readiness rates, DEW should raise the CCWMR performance targets across the board. We propose a slightly more challenging grading scale of five stars = 85–100 percent; 4 stars = 75–85 percent; 3 stars = 65–75 percent; 2 stars = 55–65 percent; 1 star = 0–55 percent. In a few years, policymakers should also revisit the CCWMR grading scale to ensure its rigor as the data becomes more settled.
Annual improvement
Under state law, there is also an “improvement” element that must be taken into account. This provision stipulates that districts must receive at least a three-star CCWMR rating if they achieve a certain level of improvement in readiness rates (as determined by the DEW). The idea here is to incentivize districts to improve, even if they have low baseline rates. The precise improvement target isn’t defined in statute, nor is it established in the proposed rules. However, this provision should not be overlooked, as it could well have a significant impact on the rating distribution.
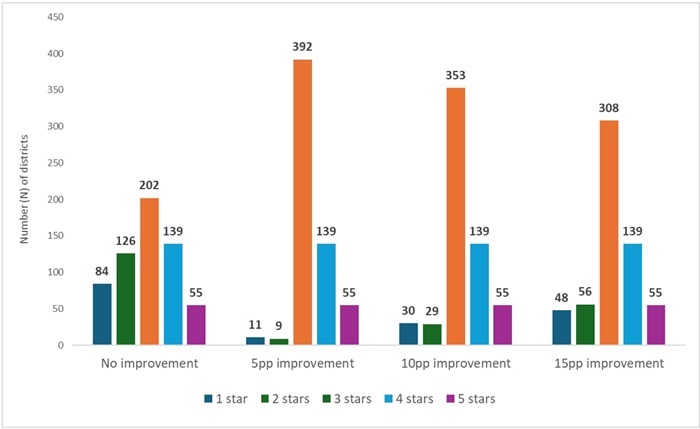
Figure 2 shows how the CCWMR ratings would change, depending on the improvement standard. If DEW were to set an improvement standard of 5 percentage points,[1] nearly all one- and two-star districts would get a bump to three stars. Thus, we see a large shift into the three-star category, and 392 out 606 districts would receive that rating. Even under more stringent standards of 10 and 15 percentage-point increases, large numbers of districts still move from the one- and two-star categories into the three-star category. These projections are meant to illustrate that—if the improvement bar is set too low—this provision could substantially reduce the number of low-rated districts. That would undermine the rigor of the CCWMR component and the principle of meaningful differentiation.
Figure 2: CCWMR ratings with an improvement dimension (5, 10, and 15 percentage point increases) based on districts’ 2022–23 and 2023–24 readiness rates

Recommendation: DEW should set a high bar for annual improvement for districts with low baseline readiness rates. Specifically, in order to receive a bump to three stars, a district or school should have to achieve an annual improvement in its CCWMR rate that falls within the top 20 percent in statewide distribution of improvement rates for the year. This approach would require districts and schools to improve at a substantially higher rate than the average district for a given year. Based on CCWMR data from 2022–23 and 2023–24, this improvement rule would have bumped just twenty-two one- and two-star districts to three stars.
Rigor of the underlying measures
Though not a topic that is specifically covered in the proposed rules, one additional concern with CCWMR should be noted. That is the startling disconnect between several districts’ CCWMR readiness rates and their high school proficiency rates. While proficiency on state exams isn’t a measure included in CCWMR—it’s reflected in the Achievement component—leaving high school with solid math and reading skills is essential to college and career readiness. Achievement and CCWMR need not perfectly correlate, but there are some striking discrepancies in districts’ Algebra I proficiency rates, for instance, and their CCWMR rates. This could lead to questions about what exactly the CCWMR component is measuring as well as the rigor of its indicators.
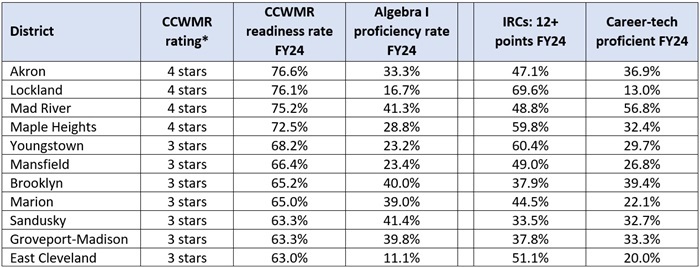
Table 1 illustrates this concern using 2023–24 data from several urban districts. Akron, Lockland, Mad River, and Maple Heights would have received four-star ratings on the CCWMR component based on the proposed grading scale. Yet these same districts posted Algebra I proficiency rates between 17 and 41 percent, well below the state average of 56 percent. Meanwhile, districts such as Youngstown, Mansfield, and East Cleveland would have received three stars on CCWMR, despite abysmal Algebra I proficiency rates of 11 to 23 percent. The columns to the right indicate that these districts had large numbers of students deemed college and career ready by meeting the industry-recognized credential (IRC) benchmark of at least twelve points in a career field or scoring proficient on career-technical exams.
Table 1: Urban districts with high CCWMR rates but low high school algebra proficiency

Recommendations: To ensure the integrity of the underlying CCWMR measures, policymakers should do the following:
- Examine the rigor of each of the underlying CCWMR measures. Each post-secondary readiness measure should—on its own—contribute to long-term success of students. To this end, DEW should study the link between these indicators and students’ employment and earnings outcomes, as well as their college-going and -completion rates.
- Raise the bar for meeting the IRC indicator. DEW has a couple options to accomplish this.[2] First, they could increase the number of total IRC “points” that students must earn to be deemed ready for CCWMR purposes from twelve (what is used for graduation purposes) to at least eighteen points. Another possibility is to maintain a twelve-point threshold but include a rule that one of the credentials must be worth nine or twelve points. Both options would reduce the possibility of accumulating only low-value credentials to meet the twelve-point mark.
- Ensure proficiency on the career-technical exams signifies mastery of technical skills. DEW should make sure that the career-technical exam standards are set at stringent levels. As an initial look at rigor, the state should release the first-time pass rates on these exams—i.e., how many test-takers score proficient or above on an exam.[3] If students are overwhelmingly passing these exams, it would raise questions about the rigor of the assessment and its cut score.
* * *
All students deserve a high school experience that leads to future opportunities in higher education and the workforce. The CCWMR component of the report card promises to ensure this is happening. Full implementation of the component as a rated element and as a factor in schools’ overall ratings would be an important step forward. To live up to its promise, though, policymakers will need to pay attention to the rigor of its measures.
[1] That is, districts get a bump to three stars if their readiness rates from 2022–23 to 2023–24 increased by 5 percentage points (e.g., from 30 to 35 percent).
[2] Statute does not specify the number of points needed to be earned to meet the IRC indicator within CCWMR.
[3] This is not the same as the percentage of students who meet the proficient mark reported in the CCWMR component (which includes all students in a cohort in the denominator, whether or not they took a CTE exam.


