Mobile Navigation

  • National
    • Policy
      • High Expectations
      • Quality Choices
      • Personalized Pathways
    • Research
    • Commentary
      • Gadfly Newsletter
      • Flypaper Blog
    • Events
    • Scholars Program
  • Ohio
    • Policy
      • Priorities
      • Media & Testimony
    • Research
    • Commentary
      • Ohio Education Gadfly Biweekly
      • Ohio Gadfly Daily
  • Charter Authorizing
    • Application
    • Sponsored Schools
    • Resources
  • About
    • Mission
    • Board
    • Staff
    • Career
Home
Home
Advancing Educational Excellence

Main Navigation

  • National
  • Ohio
  • Charter Authorizing
  • About

Ohio Menu

  • Topics
    • Accountability & Testing
    • Advanced Education
    • Career & Technical Education
    • Charter Schools
    • Curriculum & Instruction
    • ESSA
    • Evidence-Based Learning
    • Governance
    • Personalized Learning
    • Private School Choice
    • School Finance
    • Standards
    • Teachers & School Leaders
  • Research
  • Policy
  • Commentary
    • Ohio Gadfly Newsletter
    • Ohio Gadfly Blog
    • Events

The Education Gadfly Weekly

Sign Up to Receive Fordham Updates

We'll send you quality research, commentary, analysis, and news on the education issues you care about.
Thank you for signing up!
Please check your email to confirm the subscription.

Ohio Gadfly—The false Columbus promise

Volume 20, Number 12
6.9.2026
6.9.2026

Ohio Gadfly—The false Columbus promise

Volume 20, Number 12
view
Kogan Columbus Promise blog image
School Funding

The false Columbus promise

Positive press coverage of the Columbus Promise program elides problematic data regarding participation, cost, and achievement. Unless and until these issues are rectified, the program exists only to serve adult interests rather than those of students.

Vladimir Kogan 6.9.2026
OhioOhio Gadfly Daily

The false Columbus promise

Vladimir Kogan
6.9.2026
Ohio Gadfly Daily

The bogus “state disinvestment in public schools” narrative

Aaron Churchill
6.3.2026
Ohio Gadfly Daily

Lawmakers should narrow Ohio’s teacher licensure grade bands

Jessica Poiner
6.8.2026
Ohio Gadfly Daily

School districts run roughshod over Ohio’s unused facilities law

Aaron Churchill
6.5.2026
Ohio Gadfly Daily

What population decline and student enrollment loss mean for schools

Jeff Murray
6.9.2026
Ohio Gadfly Daily
view
State share of funding blog image

The bogus “state disinvestment in public schools” narrative

Aaron Churchill 6.3.2026
Ohio Gadfly Daily
view
Teacher licensure grade bands blog image

Lawmakers should narrow Ohio’s teacher licensure grade bands

Jessica Poiner 6.8.2026
Ohio Gadfly Daily
view
School demolitions blog image

School districts run roughshod over Ohio’s unused facilities law

Aaron Churchill 6.5.2026
Ohio Gadfly Daily
view
Population loss and education SR image

What population decline and student enrollment loss mean for schools

Jeff Murray 6.9.2026
Ohio Gadfly Daily
view
Kogan Columbus Promise blog image

The false Columbus promise

Vladimir Kogan
6.9.2026
Ohio Gadfly Daily

Columbus State Community College graduated its largest ever class last month—including the most Columbus Promise students since the program to provide local students six semesters of free tuition and a modest stipend started in 2022, the college noted in a triumphant press release.

But the same figures also tell a more pessimistic story. The Columbus State class of 2026 included just 57 Columbus Promise participants. This brought the total number of students who completed the program over the first four years to only about 430. Over the same period, Columbus City Schools—the only school district whose students are eligible to participate—awarded approximately 10,000 high school diplomas.

This means that only about 5 percent of eligible Columbus high school graduates have gone on to earn an associate degree or certificate through Columbus Promise, and many of those who did would have almost certainly received a college degree anyway. Despite millions of dollars in spending, the program has barely moved the needle on helping students attain higher education and economic opportunity.

The numbers matter because Columbus Promise has taken on new political significance in recent months. Its chief architect, Columbus City Council President Shannon Hardin, has made no secret of his plans to challenge incumbent Mayor Andrew Ginther in next year’s election. Hardin has touted the Columbus Promise as one of his signature legislative achievements and one of the few points of contrast with the incumbent mayor, who attempted to defund the program in his proposed budget for next year. (During its first three years, the cost of the program was split roughly evenly between the city and private donors.)

Despite its centrality in the campaign, no one has seriously examined the actual educational impact of Columbus Promise. An honest assessment would show that the program probably did help a small number of students—while also doing harm to many others.

For many participants, the Columbus Promise has meant enrollment in courses they ultimately ended up failing and likely delayed their entry into the labor force. Others were diverted from better-resourced, higher-quality four-year programs—precisely the kinds of institutions that research shows help disadvantaged and low-income students succeed.

In short, it is far from obvious that the Columbus Promise has been a net positive for most affected Columbus students.

A flawed evaluation

This gloomy verdict may surprise many readers who have followed the discussion about Columbus Promise and hundreds of similar efforts around the country or those familiar with an evaluation of the program released by the Michigan-based Upjohn Institute last spring.

“The Columbus Promise has dramatically increased the number of Columbus City Schools (CCS) students attending Columbus State Community College (CSCC),” the report began, “and expanded access for students who may otherwise not have enrolled in college at any institution.”

This language—with its focus on attendance (rather than completion) and use of a tentative verb (may)—was intentional.

The Upjohn analysis focused on one question: comparing the performance of students attending Columbus State under the program to earlier cohorts who had to fund their own tuition. 

To account for the fact that the more recent, larger Columbus State cohorts include more disadvantaged, lower-achieving students who enrolled only because of the Columbus Promise, the report carries out statistical “adjustments” to provide a more apples-to-apples analysis. Such adjustments, while useful for making over-time comparisons, are misleading for current students trying to understand their own likelihood of success at Columbus State.

The analysis, in other words, focused on tracking relative performance across different cohorts, not highlighting shockingly low absolute levels of achievement and completion seen among all students. While interesting to academic researchers, this question is of little relevance to students, families, and the funders ultimately footing the program’s bill.

For families, the real question is whether high school graduates who would’ve otherwise skipped higher education were made better off by attending Columbus State for free. Although not the focus of the Upjohn report, the data in it suggest that the answer for nearly all such Columbus high school graduates is “no.”

The reason is that 90 percent of students who begin Columbus State through the Columbus Promise don’t end up completing a certificate or an associate degree.[1] For all but a small handful of participants, community college enrollment doesn’t lead to new credentials.

About half of all Columbus Promise students drop out during or after their first year of community college. Even a single wasted year can have career consequences if it means delaying these students’ entry into workforce because it represents forgone earnings and time they could’ve spent building valuable work experience and seniority instead.[2]

To be sure, a small number of students—approximately 40 per year, based on the first cohort—successfully earned Columbus State certificates and associate degrees they would not have otherwise attempted, and some of them may go on to earn a bachelor’s, too. But a roughly similar number would have attended a four-year university instead.[3] These students were lured to Columbus State by the promise of free tuition, and several careful economics studies suggest that they were likely made worse off in the long run.

Reasonable people can disagree about how to weigh these offsetting impacts, but the bottom line is that typical Promise participants obtain no measurable educational benefits from the time they enter the program.

For policymakers, the main question is about return on investment of a different kind. The first three years of the Columbus Promise program cost a reported $9.5 million, with half coming from Columbus taxpayers. Even under the most optimistic assumptions that ignore potential diversion of students who would’ve gone elsewhere, this comes out to nearly $100,000 for each additional Columbus State certificate and associate degree earned,[4] an astronomical cost.

How to better help Columbus students

Acknowledging these issues is the first step to improving the Columbus Promise program to help achieve its original goals. There are three concrete ways to do so.

One simple change is to expand the program to cover tuition at any Ohio public college or university, rather than just Columbus State. This was precisely the design of the original, well-studied college “promise” program in Kalamazoo and explains why it produced much larger effects on both college enrollment and completion. Students who begin their college careers at more selective, four-year universities are far more likely to earn degrees.

This is also the structure of Ohio’s other major free-college program, Say Yes Cleveland, which seems to achieve significantly higher college graduation rates.

A second reform would add academic eligibility requirements, tied to a combination of high school grades and standardized test scores. (Currently, all Columbus high school graduates can participate.) While almost certainly controversial, narrowing eligibility would have three benefits.

First, it would help target Columbus Promise toward students who are likely to complete higher education and avoid pulling those who have almost no prospect of doing so out of the labor force. Second, academic requirements would also increase incentives for students to perform better while in high school, putting them in a better position to succeed in college. Finally, reducing the number of participants would free up money that could be used to increase the $500 per semester stipend students in the program receive on top of their tuition.

The last necessary change—improving the quality of Columbus students’ K-12 education—is the most difficult task. But it is also the most necessary.

The main barrier to higher education for Columbus students is not cost—despite the recent moral panic over student loans—but rather inadequate academic preparation during their public school years. According to the Upjohn analysis, Columbus Promise students attending Columbus State barely clear a D+ average. Among those who drop out without completing a degree, more than a third explicitly cited their poor academic preparation as the reason for leaving the program.

In truth, as currently designed, the Columbus Promise seems more like a program designed to serve the interests of Columbus adults rather than its students.

For city officials, it provides a highly visible credit-claiming opportunity on which to build campaigns for higher office. For school district leaders, it helps boost enrollment and appeal to families considering charter and private school options. (There is a reason why Columbus Promise eligibility is limited only to students graduating from Columbus City Schools.) The program similarly boosts enrollment at Columbus State, the only college students can attend. And for local corporate leaders and other financial benefactors, it creates the impression of supporting Columbus students without having to take on the entrenched school employment interests and dysfunctional systems that stand in the way of academic achievement and economic opportunity.

Columbus students deserve better.

Vladimir Kogan is a senior research fellow at the Thomas B. Fordham Institute and a professor of political science at the Ohio State University. He is the author of the 2025 book No Adult Left Behind: How Politics Hijacks Education Policy and Hurts Kids (Cambridge University Press).



[1] This estimate is based on the first cohort of Columbus Promise students who graduated from high school in 2022, the only group for which completion data are available in the Upjohn Report. However, the cumulative count of Columbus Promise students who have received degrees or certificates, covering the first four cohorts, suggest that completion rates did not increase dramatically in more recent years.

[2] Only 22 percent of students who left the community college without a degree reported that they were working full- or part-time while attending in a survey fielded by the Upjohn researchers, suggesting that enrollment did indeed delay employment for most.

[3] Bizarrely, the Upjohn evaluation claims that “increased enrollment at CSCC is not coming at the expense of the four-year college/university enrollment rate”—hedging the claim with “it appears.” Yet the report’s own data (in Figure 5) suggests otherwise. Before the rollout of the Columbus Promise program, 12 percent of Columbus City Schools high school graduates immediately enrolled in four-year Ohio public universities. In 2022, this fell to 9 percent. Although not large in absolute terms, these numbers imply that one in four students who would’ve otherwise gone directly to a four-year school enrolled in Columbus State instead, similar in magnitude to effects documented by other two-year promise programs.

[4] In the first Columbus Promise cohort, two-thirds of students who completed the program earned a certificate and not an associate degree, according to the Upjohn report.

view
State share of funding blog image

The bogus “state disinvestment in public schools” narrative

Aaron Churchill
6.3.2026
Ohio Gadfly Daily

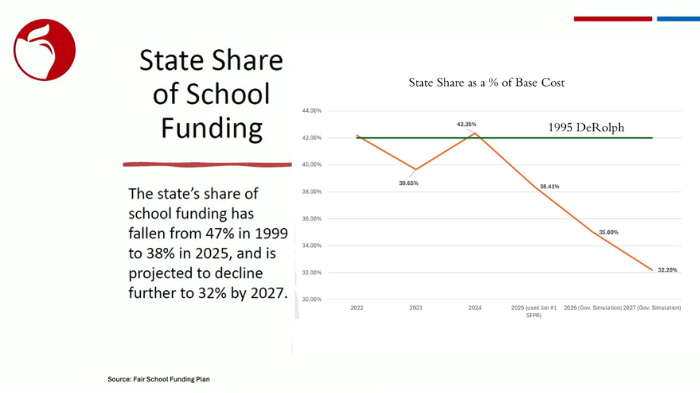
At the May school board meeting, Columbus City Schools’ treasurer Ryan Cook made an impassioned argument that the State of Ohio has “disinvested” in public education. After cataloguing all the evils inflicted by legislators onto public schools, including (heaven forbid) reducing state taxes and expanding educational choice, Cook showed a slide that he seemed to believe was the coup de grâce. “I think this is just a powerful chart... This chart here clearly shows that legislative disinvestment has led to where we’re at this evening [discussing budget cuts]. The consequences are sobering.” he said.

State share of funding blog figure 1

Never mind that Columbus is among the most lavishly funded districts in Ohio (it spends more than $25,000 per year), that its state per-pupil revenues have steadily risen, and that its budget woes are largely related to downsizing after receiving hundreds of millions in temporary, Covid-era federal funds. Forget those pesky facts and fixate only on the falling “state share” displayed on this chart.

Cook is not alone in pointing to a plummeting state share as evidence of “disinvestment.” Molly Bryden of the Policy Matters Ohio claimed: “By the end of the 2026–27 school year, the state's portion of school funding will fall to 32 percent, the lowest state share since long before the 1997 DeRolph decision.” Jim Betts, a longtime school funding advocate, also noted a declining state share (referencing 32 percent as well) in a recent Dayton Daily News story with a sensational headline declaring a “funding crisis.”

In a prior piece, I have challenged the prevailing sky-is-falling narrative about overall school funding amounts. But are the critics right to decry a declining “state share”? Or is their argument full of bologna?  

The right understanding of the “state share” of school funding

Before scrutinizing their numbers, let’s review some basics. Funding public schools has long been a joint responsibility of the state and local districts.[1] Using taxes collected from Ohioans, state lawmakers allocate about $8 billion in state aid to districts via the school funding formula. This formula directs progressively more dollars to districts with smaller tax bases or those serving more low-income and special-needs pupils. On top of this formula aid, the state also provides districts with “guarantee” subsidies ($570 million this year), property tax rollback reimbursements ($1.2 billion), and casino revenues ($110 million), and a few other small funding streams.

In addition, state law also requires districts to levy a minimum 20 mill, or 2 percent, local property tax. Though not officially counted as “state funding,” this state-required tax generates billions for districts. This “indirect” form of state aid is also considered part of Ohio’s overall foundation funding system. Combined with the “direct” formula funding, the 20 mills ensure all Ohio students receive adequate baseline resources for their education. Furthermore, districts may—with voter approval—assess property taxes above the 20 mills and/or an income tax, thus further supplementing their revenues.

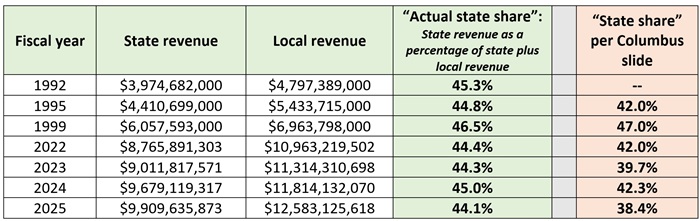
What does this all amount to? Table 1 shows the state and local revenues for Ohio’s traditional districts, as well as the resulting portion of funds directly provided by the state (the “actual state share”). During the DeRolph era,[2] a point of reference in the Columbus presentation, the state contributed 45 to 47 percent of school funding. The actual state share remains roughly the same today: between 44 and 45 percent over the past four years. During this time span (1992 to 2025), state-only per-pupil funding rose by 33 percent above the inflation rate, or nearly 1 percent each year, indicating strong and increasing state investment in public education.

Table 1: State revenue as a percentage of state and local funding, Ohio districts

State share of funding blog table 1
Notes: The 2022 to 2025 funding totals are for traditional districts only (excluding public charter schools, JVSDs, and private school scholarship funding) and were calculated based on Ohio Department of Education and Workforce data reported in the “Expenditure Rankings” files. The DeRolph era data (1992, 1995, 1999) are from the National Center for Education Statistics (it reports rounded numbers) and reflect public school funding before any substantial public charter and private school scholarship enrollment (the first charters opened in 1999 and the Cleveland Scholarship began in 1997). Historical revenue data are not inflation-adjusted, as the table focuses on the proportion of state to local funds, not funding levels. However, adjusted for inflation (CPI), state revenues for districts have grown from $5,094 per pupil in 1992 to $6,764 per pupil in 2025—up 33 percent or almost 1 percent annually above the inflation rate.

The numbers trick: Focusing on the “state share percentage”

As Table 1 indicates, the state shares of funding that I calculate are noticeably higher for 2022–2025 than what the Columbus slide displays. They also sit well above the 32 percent “state share” predicted for 2027. In fact, given the modest upticks in districts’ state revenues expected for 2026 and 2027, local revenues would need to swell to an impossible $22 billion by next year to sink the actual state share of funding to 32 percent.

What gives?

In a sleight of hand, critics are not citing the actual portion of funding provided by the state. They instead refer to the “state share percentage” (SSP), an obscure (albeit important) mechanism buried deep inside the school funding formula.

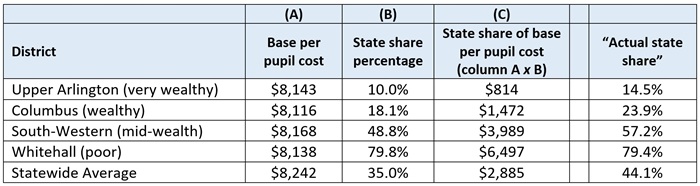
As a quick primer, the SSP ensures low-wealth districts—those with lower property values and resident incomes—receive more state aid, and vice-versa for higher-wealth districts. Table 2 illustrates how it works, using 2026 data from four Franklin County districts. Because Whitehall has less local wealth, the SSP drives more core formula aid to this district ($6,497 per pupil) than to the über-rich Upper Arlington. Whitehall also receives more core state aid than Columbus, which is property-wealthy, even though it serves primarily low-income students who generate additional state aid through a separate weighted-funding element not reflected in this table. We also see the statewide average SSP (35 percent), which matches the number presented on the Columbus slide for 2026 and confirms that the treasurer was in fact presenting SSP numbers.[3]

Table 2: Illustration of how the SSP works to yield base per pupil state aid

State share of funding blog table 2
Source: Ohio Department of Education and Workforce, Traditional District Payment Reports (May 2026). Note: The actual state shares of revenue are based on FY25 data, the most recent available.

It is true that SSPs have generally declined in recent years, as property values and resident incomes have systematically risen across Ohio. But the SSP isn’t the final word on state funding. While the SSP is used to calculate the main formula elements,[4] it is not applied in two important formula components: disadvantaged pupil impact aid and targeted assistance, which provide more than $1.7 billion this year to districts. Moreover, the state distributes nearly $2 billion to districts entirely outside of the formula itself, including guarantees—funds layered onto formula aid[5]—as well as property tax reimbursements and casino revenues. These are all substantial sources of state revenues for districts but not accounted for when the SSP is the sole data point. 

In sum, focusing only on the SSP creates the illusion of “disinvestment,” even though the true state portion of funding has remained relatively stable. As Table 1 indicates, the statewide SSPs (red column) have fallen behind the actual state share of funding over the past four years (green column). And in most districts, this is also the case. In 2025, 485 districts, or about four in five, had lower SSPs than their actual state share of funding. But the SSPs are not an accurate or complete presentation of the state’s total contribution to public school funding.

Topping it off with a faulty analogy

What does this mean for normal human beings? One implication put forward by critics is that a declining state share automatically translates to higher local taxes. Coming full circle to the Columbus treasurer’s presentation, he offered this analogy: “Think of it like a teeter-totter, when the state share decreases, the local residential tax base picks up the high end of that. The formula shifts.”

The teeter-totter analogy is nonsense. When the “state share” declines—whether referring to the SSP or the actual state share—there is not a mechanical, compensatory increase in districts’ local revenues (and residents’ local tax liabilities). How do property taxes rise? It’s due either to an increase in property values, which occurs through county reassessments, or an increase in the tax rate, which happens via ballot measure. Neither factor—reassessment or election results—has anything to do with the school funding formula. The formula takes into account districts’ local wealth to ensure an equitable distribution of state funds, but it does not dictate a local tax rate (beyond 20 mills) or property valuations.

A better image of state and local funding is two escalators, both heading upwards. Historically, both have risen at about the same rate, though there may be years when one moves slightly faster than the other. While that might somewhat alter the state-local mix, the larger fact remains that citizens provide public schools with steadily increasing funding through both state and local taxes. Unfortunately, the generosity and investment of Ohioans in public education is entirely glossed over in the flawed teeter-totter analogy.

***

Public schools and their allies are within their rights to petition state lawmakers and local citizens for additional funding. Pressing for more money because they believe it can benefit students is fair game. But, while it may score short-term political points, conjuring up disingenuous narratives is unlikely to build the lasting trust needed to continue growing public school funding in the years ahead.


[1] Federal funds and nontax revenues, which represent roughly 10 to 15 percent of all school funds, are excluded from my analyses and the analysis of those accusing the state of “disinvestment.”

[2] DeRolph was first filed in the county courts in December 1991 (during fiscal year 1992). The other DeRolph era years shown in Table 1 mirror those presented on the Columbus slide.

[3] The chart also refers to the “state share as a % of base cost,” which is a reference to the use of the SSP to determine the base per-pupil formula funding.

[4] The SSP is applied to the core base per-pupil element (calculations illustrated in Table 2), as well as weighted per-pupil funding for special-education, English learner, gifted, and career-tech students.

[5] Though not a desirable mechanism, guarantees blunt the impact of a declining SSP by boosting the total state funding a district receives relative to the formula prescription. While a much larger topic, state policymakers could redesign the SSP in a way that guards against systemic declines in the face of widespread inflation and potentially avoid such large-scale uses of guarantees.

view
Teacher licensure grade bands blog image

Lawmakers should narrow Ohio’s teacher licensure grade bands

Jessica Poiner
6.8.2026
Ohio Gadfly Daily

Three years ago, warnings about potential teacher shortages dominated education headlines. Ohio policymakers, determined to alleviate concerns, included in the state budget a number of provisions aimed at bolstering the teacher workforce. Unfortunately, one of those well-intentioned provisions could soon have a negative impact on teacher preparedness and student achievement.

Before the 2023 budget changes, the law required Ohio educators to obtain a teaching license in one of three grade bands: pre-K–5, 4–9, and 7–12. But the budget reduced those grade bands from three to two: one for grades pre-K–8 and a second for grades 6–12. It also permitted public schools to allow educators to teach up to two grade levels outside their licensure grade band for up to two years. The goal was to provide school leaders with additional flexibility to meet classroom needs in the midst of teacher shortages. Broader licensure grade bands wouldn’t create more teachers overall, but they would expand the number of teachers available in certain grades and subjects. A shortage of sixth grade science teachers, for example, is easier to deal with if fifth grade science teachers can move up to sixth without running afoul of licensure laws.

But K–12 schools aren’t the only entities impacted by grade bands. They matter to teacher preparation programs, too. As part of their training efforts, preparation programs largely focus on two areas: content (knowledge about a specific subject, like reading or math) and pedagogy (knowledge about effective teaching, which includes things like instructional strategies, classroom management, and assessing student learning). Both areas can and should be tailored to specific grade levels. For example, teaching first graders to read requires different content and pedagogical knowledge than teaching middle schoolers how to write a thesis statement or high schoolers how to analyze Shakespeare. Math content for elementary educators is very different than it is for middle school educators, who could be tasked with teaching algebra, or high school educators, who might teach calculus.

In short, tailoring content and pedagogical instruction to specific grade levels is a key part of effectively preparing teachers. But expanding grade bands makes that a lot more difficult. When grade bands include all of elementary and middle school (as the pre-K–8 grade band does) or all of middle and high school (as the 6–12 grade band does), teachers have to master an enormously broad set of content and pedagogical knowledge. And that means their preparation programs must cram all the knowledge they need to teach as many as nine different grade levels into just four years of college (which is even more challenging if you take into account most universities’ general education requirements). For elementary and middle school educators, who teach more than one subject, that burden is even heavier.

If current law remains unchanged, preparation programs will attempt to ensure that teacher candidates get all the content and pedagogical training they need. But it will be almost impossible for them to succeed. What’s most likely to happen is that preparation programs will sacrifice depth for the sake of breadth. Future teachers will graduate with surface-level knowledge rather than in-depth expertise. And that’s a problem, given that many teachers already graduate without a strong content base. A recent report from NCTQ, for example, found that more than a third (36 percent) of Ohio’s elementary teacher preparation programs failed to provide sufficient instruction in math content.

The good news is that there’s already a solution available. Senate Bill 144, which unanimously passed out of the Senate in October, would require the state board of education to reestablish three licensure bands: pre-K–5, 4–8, and 7–12. It would also limit public schools’ ability to assign educators to teach up to two grades outside their grade band to only those who have at least one year of experience.

These are smart, simple changes. Narrower grade bands ensure that teachers (and preparation programs) aren’t required to sacrifice depth for breadth. And K–12 school administrators still have flexibility. They just have to make sure the teachers they assign to teach outside their grade band have at least a little experience—a reasonable expectation that benefits both students and first-year educators.

It’s unfortunate that the bill has spent the last six months languishing in the House. But that’s an easy fix, too. Lawmakers in the lower chamber just need to vote it out. Senate Bill 144 is one of those rare instances where simple, bipartisan legislation can fix an unintended consequence and benefit a wide variety of stakeholders, all without any sort of financial cost. House members would be wise to act as soon as possible.

view
School demolitions blog image

School districts run roughshod over Ohio’s unused facilities law

Aaron Churchill
6.5.2026
Ohio Gadfly Daily

Amid plunging enrollment and budgetary woes, Ohio’s urban districts have moved to permanently close dozens of school buildings. Rightsizing their physical footprint is a necessary step, but in so doing, districts are skirting legal provisions requiring them to offer buildings to public charter schools. These violations of state law—the intent for sure, if not the plain lettering—demand legislative action that ensures compliance with state requirements.

As a policy refresher, districts must offer for sale or lease an “unused” facility to nearby charter schools. Such facilities have either been entirely unused for one year—sitting vacant—or less than 60 percent utilized for instruction during the previous year. Charter schools located within a district’s boundaries are eligible to bid on an unused facility, with priority given to high-performing charters. If no bidders emerge from this process, a district is then allowed to pursue other options—e.g., selling it to a private developer—or simply keep the facility in its possession. In addition to this mandatory disposal process for “unused” facilities, districts—when voluntarily seeking to offload a facility—must also first offer it to charter schools before soliciting other bids.

These laws make perfect sense. Keeping facilities open as public schools honors the original purpose of the building and the taxpayer investments in it. Moreover, by handing the keys to a charter school, it ensures the facility receives maintenance and care, while serving children in a community. This is a much better option than allowing districts to mothball facilities and leave them to crumble and become urban blight. Lastly, the law assists charter schools, which have long struggled to secure adequate facilities due to policies that deny them access to local bond revenues and state construction grants. Through the processes outlined in state law, charters have an avenue to obtain a building at a more affordable cost.

With these legal requirements and districts downsizing, we should be seeing more charter schools gaining access to facilities. But that’s not happening, as districts are sidestepping procedures set forth in state law. We at Fordham have repeatedly raised concerns about possible noncompliance—as has Governor DeWine—and this piece provides more examples of questionable behavior.

Columbus

Last December, the Columbus school board voted to demolish four school buildings after the 2025–26 school year. When asked about their right to bid on the buildings, board president Michael Cole told the Dispatch, “I don't know that if I were a charter school, that I would want that facility—we closed it for a reason.” But speculating on whether charters may or may not be interested is irrelevant. What the school board was obligated to do was offer the buildings and actually find out if any charters had use for them—and indeed, Andy Boy, a Columbus charter-school leader, suggested interest in the Dispatch story. Unfortunately, due to the district’s lack of cooperation, these facilities will be torn down when they could have received new life under charter school ownership.

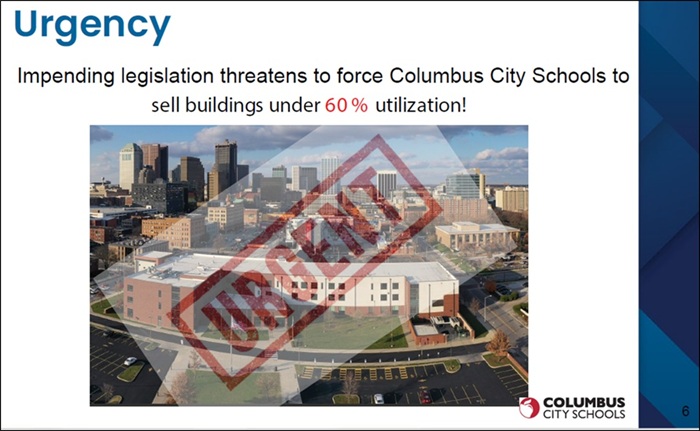
Another apparent violation of state law relates to buildings that Columbus operates, despite having utilization rates under 60 percent—the threshold that obligates a district to offer a half-empty building to a charter school for lease or sale. According an October 2025 board meeting presentation, administrators identified 15 buildings with utilization rates under 60 percent. In that very same presentation, the district also strangely indicated that the 60 percent rule was not current law, even though the provision has been in effect since 2022. Whether this reflects legal incompetence or was an intentional misrepresentation of statute is unclear. But the fact remains that these severely underutilized schools should be on the offer to Columbus charter schools.
 

School demolitions blog figure 1

What is happening with these underutilized schools? While none of them were among the four building slated for demolition, three will continue operating in 2026–27 and permanently close next spring. A fourth, Fairwood Elementary, closed at the conclusion of the 2025–26 school year. In a recent article, the principal said, “Hopefully, we’ll be able to keep the building or refurbish the building or do something in this space that will be of a benefit to the community.” A nice parting thought, but the quote evidences no whiff of possible charter ownership. As for the other 11 underutilized buildings, they were all in operation through 2025–26, and one might reasonably assume they will continue operating next school year as district-run schools—seemingly in defiance of state law, if the buildings were not first offered to charter schools.

Cleveland

Turning northwards, Cleveland has made news for its aggressive plan to close some two dozen schools. A recent Signal Cleveland article indicates that several buildings will remain district property, while others may be handed over to the municipal government. For 12 other buildings, the district in partnership with the city is looking to sell them to developers. This is all well and good, but the legal question remains: Did the district offer these facilities first to city charter schools before keeping these buildings in their possession or engaging private developers? On the redevelopment side, the city’s Request for Qualifications makes no mention of having fulfilled state requirements to offer the vacant buildings to charters before seeking other development opportunities. The omission is not proof positive, but word on the street is that the buildings were never offered to the city’s charter schools.

Senate Bill 311

The intent of state law is clear: Taxpayer-funded school buildings should be used to educate Ohio students. When school districts aren’t using these public assets, they are responsible for making good-faith efforts to transfer ownership of the building (or lease it) to a public charter school. But whether out of fear of competition or outright hostility toward charters, districts are playing keep-away games with facilities.

Introduced earlier this year, Senate Bill 311 takes aim at curbing the abuse through stronger statutory language. The legislation, which Fordham supports, would do the following:

  • Clarifies the 60 percent rule by setting an unambiguous capacity standard;[1]

  • Clarifies that districts cannot demolish a facility before offering it to charter schools, and adds a fine for noncompliance;

  • Clarifies that districts cannot offer a facility to another municipal government before offering it to charter schools;

  • Requires the state to publish an annual list of districts’ unused facilities; and

  • Includes several commonsense exceptions to mandatory disposal.[2]

In addition to these provisions, Senate Bill 311 also increases the likelihood that an offered facility will be purchased or leased. It allows high-performing charter schools located outside of a district to bid on an unused facility (with secondary priority behind local high-performing charters); private schools are added to the mix, as well, given third-tier priority alongside non-high-performing local charter schools. Finally, the bill contains language intended to make an unused facility more affordable for charters to actually purchase.

* * *

Public school officials are supposed to uphold the law and model for young people how to be law-abiding citizens. But when it comes to state laws regarding unused school facilities, some administrators seem to be taking them as suggestions—not legal imperatives. This gamesmanship not only sets a poor example, but also keeps half- to fully-empty buildings out of the hands of educational entities that are helping students succeed. It’s time to stop the games and ensure that taxpayer-funded buildings are used to educate Ohio students.


[1] Specifically, for the past two school years, a building is “unused” if enrollment is less than 60 percent of the building’s maximum enrollment per its certificate of occupancy or its highest enrollment over the past ten years.

[2] For instance, if a facility is less than ten years old or is undergoing significant renovations.

view
Population loss and education SR image

What population decline and student enrollment loss mean for schools

Jeff Murray
6.9.2026
Ohio Gadfly Daily

America is deep into a years-long baby bust—with the total fertility rate at below-replacement levels since 2010, and accelerating. Maybe there will be a rebound in births at some point, maybe not. But until that happens, impacts of a shrinking population will continue to reverberate widely for years to come. A new policy paper attempts to model the impacts of population decline on the provision of a variety of public services, with K–12 education as the primary exemplar.

Jeffrey Clemens, an economist at the University of California, San Diego, starts by illustrating how population increases have historically impacted per-capita expenditures by state and local governments, using Census data from 1979 to 2019 as provided by The Urban Institute. His best-fit line graph analysis shows that a 10 percent increase in a state’s population predicts a 2.2 percent smaller increase in its per-capita expenditure. That is, while total spending grows (services expanding to cover more people), per-capita spending grows more slowly than it would in a slow-growth cycle. Thus, per-resident expenditures by state and local governments increase more slowly when the population grows more quickly. This basic pattern held true for education, highway, health and hospital, and utility spending categories. Clemens suggests this is a class case of economies of scale, but we shouldn’t discount the possibility that public sector spending simply lags population in a fast-growing state, due to the amount of time needed to pass levies, collect tax revenue, and then disburse the proceeds.

Next, Clemens looks at education specifically—around 9,000 districts nationwide—over the same 40-year historical period. Best-fit line graphs for districts both gaining and losing enrollment over that period show patterns similar to the larger model. For expanding districts, a 10 percent increase in enrollment predicts a 1.1 percent rise in per-student expenditure. But for districts in decline, a 10 percent decrease in enrollment predicts a much larger 4.1 percent rise in per-student expenditure. This overall pattern, however, masks specific local variations. Clemens provides two contrasting examples: Cleveland Metropolitan School District (CMSD) and St. Louis City Schools, both of whose enrollment shrunk by half between 1999 and 2019, and both of whose test score performance was similarly poor prior to the pandemic (based on Stanford Education Data Archive data). While St. Louis’s per-student expenditures rose only modestly over that period, CMSD’s nearly doubled. More on all that shortly.

“Declines in population imply reductions in service need,” Clemens writes, “and hence reductions in required capacity.” He investigates three areas of service provision likely to determine how efficiently school districts are managing population decline. The first is building capacity. Returning to the sample of 9,000 districts from 1979 to 2019, he finds that those experiencing rising enrollment add buildings at a moderate and reasonable rate (specifically, a 10 percent increase in the number of students predicts a 6 percent increase in the number of schools). However, in shrinking districts, a 10 percent decline in the number of students predicts just a 3 percent decrease in the number of schools, a sure sign that remaining buildings are operating far under capacity with concomitant inefficiencies in transportation, utilities, and maintenance.

The second area is staffing. Clemens doesn’t fully spell out the difference in per-pupil staffing rates between expanding and contracting districts, only saying they are “substantially” higher in those that are losing students. He cites the usual culprits—collective bargaining agreements, tenure-like job protections, and service-level “guarantees” imposed by state or district policy—as causes of staffing “inertia”, but he analyzes none of them.

The third area is pension and retirement commitments for retirees. This is even more sparsely analyzed in the paper, except to say that other research indicates that existing, already-enormous financial commitments to public system retirees generally are underestimated by states to the tune of an additional $1 trillion. If true, continued population decline will even more quickly lead to too few younger workers paying in to an overburdened system supporting a growing sector of older beneficiaries.

It is not inevitable that shrinking districts must succumb to all of these inefficiency triggers, however. Clemens returns to the comparison of the Cleveland and St. Louis school districts in two of those spending categories. Both districts lost nearly 50 percent of their student population between 1999 and 2019. St. Louis reduced the number of buildings in operation from 115 to 74 (36 percent) over that period, while CMSD reduced from 124 to 104 schools (a decline of just 16 percent). As for staffing, both districts refrained from eliminating teacher positions as student enrollment declined—leading to a similarly-increasing teacher/student ratio over time. However, St. Louis did shrink its non-teaching staff ranks (instructional aides, administrators, and other support staff) more aggressively and more in tandem with enrollment declines than CMSD over that time. Clemens speculates that greater fiscal support from the state for Cleveland schools as compared to St. Louis’s primary (and growing) reliance on local tax funding could explain why St. Louis was more aggressive in right-sizing its operations, which tracks.

Clemens concludes that it is not until revenue declines brought on by a shrinking population become catastrophic that school districts will truly begin to reckon with the level of “retrenchment” needed in their service provision. Interestingly, he limits his data to 2019 because he feared “the unusual spending circumstances of the pandemic years” might skew his analysis. Specifically, using infusions of temporary funding to hire permanent staff or make other long-term spending commitments. But that pattern has served to accelerate the inevitable and push districts across the country to just the fiscal precipice they needed to see to force them into action. Cleveland Metropolitan School District—for only one apt example—is closing as many school buildings this year as it did in the entire two decades between 1999 and 2019, consolidating dozens more, and laying off hundreds of employees—including teachers. Covid-era funding boosts may have allowed district leaders to kick the downsizing can down the road a few years, but the need for retrenchment due to student enrollment loss has only gotten more urgent since 2019. Jeffrey Clemens concludes that doing so efficiently should be the priority unless and until the American baby bust abates.

SOURCE: Jeffrey Clemens, “Implications of Low Fertility and Declining Populations for the Operations of US State and Local Governments,” Aspen Economic Strategy Group Policy Paper Series (April 2026).

Fordham Logo

© 2026 The Thomas B. Fordham Institute
Privacy Policy
Usage Agreement

National

P.O. Box 110
Burke, VA 22009

202.223.5452

[email protected]

Ohio

P.O. Box 82291
Columbus, OH 43202

614.223.1580

[email protected]

Sponsorship

130 West Second Street, Suite 410
Dayton, Ohio 45402

937.227.3368

[email protected]