At the May school board meeting, Columbus City Schools’ treasurer Ryan Cook made an impassioned argument that the State of Ohio has “disinvested” in public education. After cataloguing all the evils inflicted by legislators onto public schools, including (heaven forbid) reducing state taxes and expanding educational choice, Cook showed a slide that he seemed to believe was the coup de grâce. “I think this is just a powerful chart... This chart here clearly shows that legislative disinvestment has led to where we’re at this evening [discussing budget cuts]. The consequences are sobering.” he said.
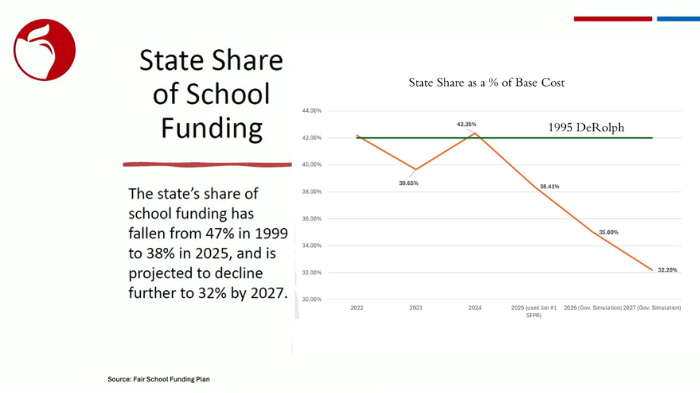
Never mind that Columbus is among the most lavishly funded districts in Ohio (it spends more than $25,000 per year), that its state per-pupil revenues have steadily risen, and that its budget woes are largely related to downsizing after receiving hundreds of millions in temporary, Covid-era federal funds. Forget those pesky facts and fixate only on the falling “state share” displayed on this chart.
Cook is not alone in pointing to a plummeting state share as evidence of “disinvestment.” Molly Bryden of the Policy Matters Ohio claimed: “By the end of the 2026–27 school year, the state's portion of school funding will fall to 32 percent, the lowest state share since long before the 1997 DeRolph decision.” Jim Betts, a longtime school funding advocate, also noted a declining state share (referencing 32 percent as well) in a recent Dayton Daily News story with a sensational headline declaring a “funding crisis.”
In a prior piece, I have challenged the prevailing sky-is-falling narrative about overall school funding amounts. But are the critics right to decry a declining “state share”? Or is their argument full of bologna?
The right understanding of the “state share” of school funding
Before scrutinizing their numbers, let’s review some basics. Funding public schools has long been a joint responsibility of the state and local districts.[1] Using taxes collected from Ohioans, state lawmakers allocate about $8 billion in state aid to districts via the school funding formula. This formula directs progressively more dollars to districts with smaller tax bases or those serving more low-income and special-needs pupils. On top of this formula aid, the state also provides districts with “guarantee” subsidies ($570 million this year), property tax rollback reimbursements ($1.2 billion), and casino revenues ($110 million), and a few other small funding streams.
In addition, state law also requires districts to levy a minimum 20 mill, or 2 percent, local property tax. Though not officially counted as “state funding,” this state-required tax generates billions for districts. This “indirect” form of state aid is also considered part of Ohio’s overall foundation funding system. Combined with the “direct” formula funding, the 20 mills ensure all Ohio students receive adequate baseline resources for their education. Furthermore, districts may—with voter approval—assess property taxes above the 20 mills and/or an income tax, thus further supplementing their revenues.
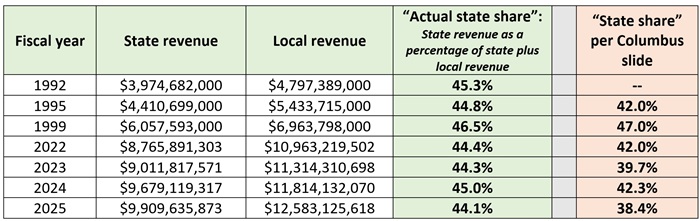
What does this all amount to? Table 1 shows the state and local revenues for Ohio’s traditional districts, as well as the resulting portion of funds directly provided by the state (the “actual state share”). During the DeRolph era,[2] a point of reference in the Columbus presentation, the state contributed 45 to 47 percent of school funding. The actual state share remains roughly the same today: between 44 and 45 percent over the past four years. During this time span (1992 to 2025), state-only per-pupil funding rose by 33 percent above the inflation rate, or nearly 1 percent each year, indicating strong and increasing state investment in public education.
Table 1: State revenue as a percentage of state and local funding, Ohio districts
The numbers trick: Focusing on the “state share percentage”
As Table 1 indicates, the state shares of funding that I calculate are noticeably higher for 2022–2025 than what the Columbus slide displays. They also sit well above the 32 percent “state share” predicted for 2027. In fact, given the modest upticks in districts’ state revenues expected for 2026 and 2027, local revenues would need to swell to an impossible $22 billion by next year to sink the actual state share of funding to 32 percent.
What gives?
In a sleight of hand, critics are not citing the actual portion of funding provided by the state. They instead refer to the “state share percentage” (SSP), an obscure (albeit important) mechanism buried deep inside the school funding formula.
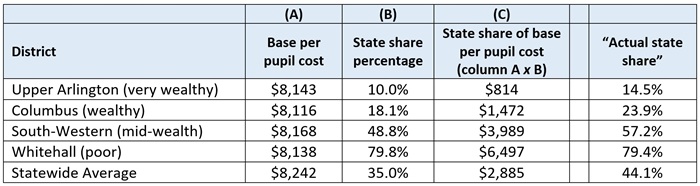
As a quick primer, the SSP ensures low-wealth districts—those with lower property values and resident incomes—receive more state aid, and vice-versa for higher-wealth districts. Table 2 illustrates how it works, using 2026 data from four Franklin County districts. Because Whitehall has less local wealth, the SSP drives more core formula aid to this district ($6,497 per pupil) than to the über-rich Upper Arlington. Whitehall also receives more core state aid than Columbus, which is property-wealthy, even though it serves primarily low-income students who generate additional state aid through a separate weighted-funding element not reflected in this table. We also see the statewide average SSP (35 percent), which matches the number presented on the Columbus slide for 2026 and confirms that the treasurer was in fact presenting SSP numbers.[3]
Table 2: Illustration of how the SSP works to yield base per pupil state aid
It is true that SSPs have generally declined in recent years, as property values and resident incomes have systematically risen across Ohio. But the SSP isn’t the final word on state funding. While the SSP is used to calculate the main formula elements,[4] it is not applied in two important formula components: disadvantaged pupil impact aid and targeted assistance, which provide more than $1.7 billion this year to districts. Moreover, the state distributes nearly $2 billion to districts entirely outside of the formula itself, including guarantees—funds layered onto formula aid[5]—as well as property tax reimbursements and casino revenues. These are all substantial sources of state revenues for districts but not accounted for when the SSP is the sole data point.
In sum, focusing only on the SSP creates the illusion of “disinvestment,” even though the true state portion of funding has remained relatively stable. As Table 1 indicates, the statewide SSPs (red column) have fallen behind the actual state share of funding over the past four years (green column). And in most districts, this is also the case. In 2025, 485 districts, or about four in five, had lower SSPs than their actual state share of funding. But the SSPs are not an accurate or complete presentation of the state’s total contribution to public school funding.
Topping it off with a faulty analogy
What does this mean for normal human beings? One implication put forward by critics is that a declining state share automatically translates to higher local taxes. Coming full circle to the Columbus treasurer’s presentation, he offered this analogy: “Think of it like a teeter-totter, when the state share decreases, the local residential tax base picks up the high end of that. The formula shifts.”
The teeter-totter analogy is nonsense. When the “state share” declines—whether referring to the SSP or the actual state share—there is not a mechanical, compensatory increase in districts’ local revenues (and residents’ local tax liabilities). How do property taxes rise? It’s due either to an increase in property values, which occurs through county reassessments, or an increase in the tax rate, which happens via ballot measure. Neither factor—reassessment or election results—has anything to do with the school funding formula. The formula takes into account districts’ local wealth to ensure an equitable distribution of state funds, but it does not dictate a local tax rate (beyond 20 mills) or property valuations.
A better image of state and local funding is two escalators, both heading upwards. Historically, both have risen at about the same rate, though there may be years when one moves slightly faster than the other. While that might somewhat alter the state-local mix, the larger fact remains that citizens provide public schools with steadily increasing funding through both state and local taxes. Unfortunately, the generosity and investment of Ohioans in public education is entirely glossed over in the flawed teeter-totter analogy.
***
Public schools and their allies are within their rights to petition state lawmakers and local citizens for additional funding. Pressing for more money because they believe it can benefit students is fair game. But, while it may score short-term political points, conjuring up disingenuous narratives is unlikely to build the lasting trust needed to continue growing public school funding in the years ahead.
[1] Federal funds and nontax revenues, which represent roughly 10 to 15 percent of all school funds, are excluded from my analyses and the analysis of those accusing the state of “disinvestment.”
[2] DeRolph was first filed in the county courts in December 1991 (during fiscal year 1992). The other DeRolph era years shown in Table 1 mirror those presented on the Columbus slide.
[3] The chart also refers to the “state share as a % of base cost,” which is a reference to the use of the SSP to determine the base per-pupil formula funding.
[4] The SSP is applied to the core base per-pupil element (calculations illustrated in Table 2), as well as weighted per-pupil funding for special-education, English learner, gifted, and career-tech students.
[5] Though not a desirable mechanism, guarantees blunt the impact of a declining SSP by boosting the total state funding a district receives relative to the formula prescription. While a much larger topic, state policymakers could redesign the SSP in a way that guards against systemic declines in the face of widespread inflation and potentially avoid such large-scale uses of guarantees.