Recent media coverage leaves an impression that Ohio public schools are being shortchanged. The Parma City Schools superintendent recently told the press, “We continue to lose money and costs to operate the district continue to rise.” One news reporter wrote: “Public schools are being forced to operate under a new reality after steep cuts in state and federal cuts in school funding.” Sensationalist headline writers have used words like “devastating” and “terrifying” to characterize funding concerns. Big-city news outlets have recently covered the multimillion-dollar budget holes facing districts such as Columbus, Cleveland, and Toledo.
But is the fiscal situation for schools all doom and gloom? Not quite. Consider the following facts:
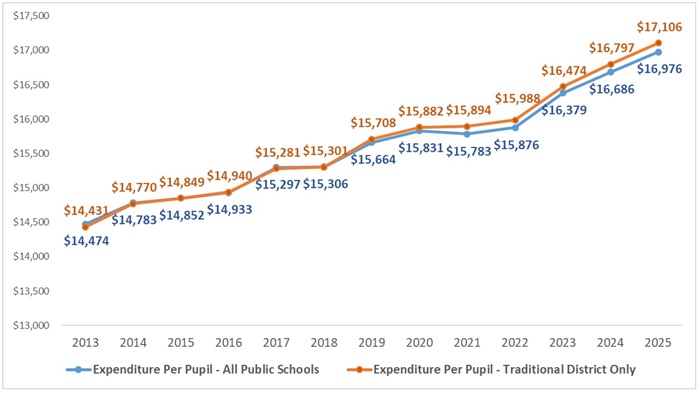
1. Public school expenditures have reached record levels, with spending increases outstripping inflation. After adjusting for inflation (including the Biden-era price spike), statewide public school spending has climbed from roughly $14,500 to $17,000 per pupil between 2013 and 2025—an increase of 17.3 percent. During this twelve-year period, traditional districts registered slightly higher spending increases (18.5 percent) than public charter schools and career-tech centers, a.k.a., JVSDs. Thanks to the state’s longstanding commitment to funding education, along with federal supplements, public schools have received increases that have more than covered the rising cost of doing business.
Figure 1: Ohio’s inflation-adjusted expenditures per pupil, FY13 to FY25
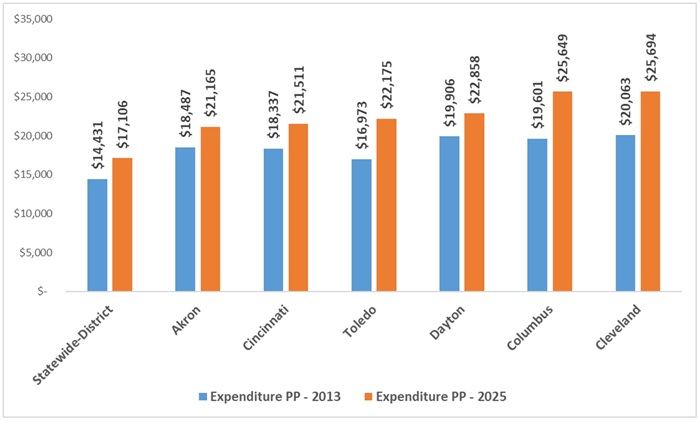
2. Spending in Ohio’s large urban districts tops the state average, and their spending increases have also outpaced inflation. One common claim is that urban districts are chronically underfunded. But this is more myth than reality for Ohio’s big-city school districts. Figure 2 shows that Akron, Cincinnati, Dayton, and Toledo all spent more than $20,000 per pupil in 2025—more than $3,000 per pupil above the state average. In Cleveland and Columbus, spending topped $25,000 per pupil. These figures exceed the statewide average by a range of 21 percent in Cincinnati to 37 percent in Columbus. Consistent with the statewide trend, spending increases in the big urban districts have also risen at a faster rate than inflation. For instance, Cleveland, Columbus, and Toledo all spent $5,000 per pupil more in FY25 than they did in FY13, an even larger increase than the statewide average increase of $2,675 per pupil.
Figure 2: Large urban districts’ expenditures per pupil versus statewide, FY13 and FY25
3. State aid for public schools is up again this year. Another oft-repeated claim, typically from pundits on the left, is that the state legislature aggressively cut public school funding by putting the brakes on the Cupp-Patterson plan last year. But the numbers don’t support that contention, either. The table below shows that state spending on public schools is up by nearly $187 million compared to last year. Public charter schools and JVSDs receive larger bumps, which is partly explained by their increasing enrollment. Traditional districts in the aggregate receive smaller increases.[1] This is driven by enrollment losses and their soaring local property values—a topic discussed below—which in turn reduces districts’ state funding prescriptions under the Cupp-Patterson model. To be sure, these increases are more modest than what some education advocates had hoped for—who doesn’t dream about more money?—but the fact remains that state funding for public schools is up yet again.
Table 1: State funding for Ohio public schools, FY25 to FY26

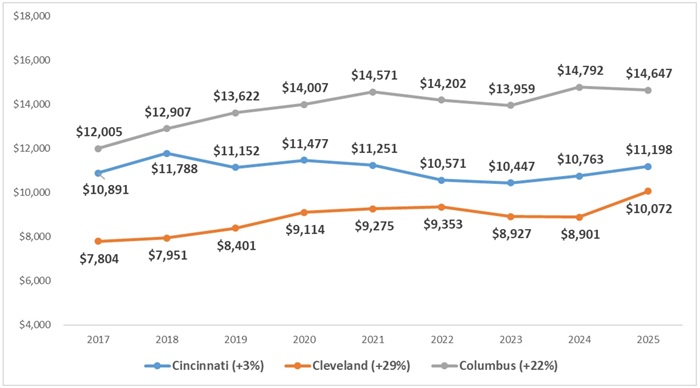
4. School districts’ local tax revenues have risen over the past decade. Funding Ohio schools has long been a joint responsibility of the state government and local districts. The local portion includes a state-required 2 percent property tax, as well as optional taxes that districts levy with voter approval. Widespread increases in property values have helped pushed districts’ local revenues upward at a rate exceeding inflation. In real dollars, statewide local revenue per pupil rose by nearly $1,000 per pupil, or 13 percent, between 2017 and 2025. As Figure 4 indicates, the local revenues of two of Ohio’s three largest urban districts increased at a faster clip than the statewide average: Columbus and Cleveland’s local revenues per pupil are up 22 and 29 percent, respectively.[2]
With money pouring into districts through property taxes—and citizens voicing concerns about their tax bills—state lawmakers recently enacted new guardrails and transparency measures that protect taxpayers from sticker shock. To help districts navigate these changes, the legislature approved more than $450 million in one-time state funding that will be distributed in FY27 and FY28. Districts’ local revenues will likely grow at more moderate rates moving forward, but that comes after many years of plenitude.
Figure 3: Inflation-adjusted local revenue per pupil, all Ohio districts, FY17 to FY25
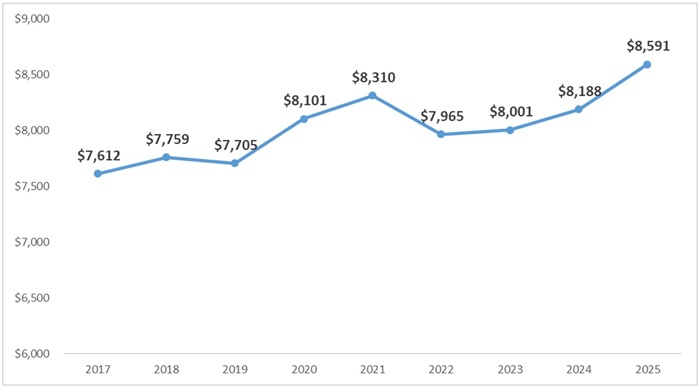
Figure 4: Inflation-adjusted local revenue per pupil, selected districts, FY17 to FY25
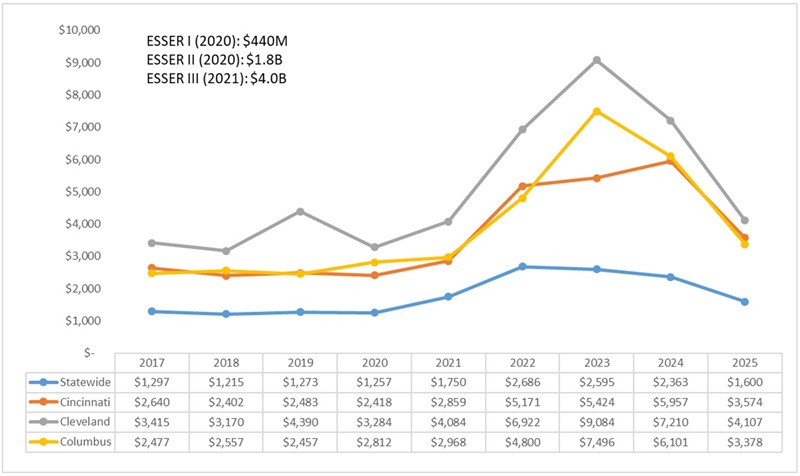
5. Federal aid spiked with an influx of emergency Covid-relief dollars but is returning to normal levels. If state and local funding are both up, why are schools feeling squeezed? One possibility is that districts have cost-containment issues, meaning expenditures are growing at a faster clip than their (increasing) revenues. If that’s happening, the focus should be on managing costs. But another factor is the end of the multibillion dollar federal emergency program, known as ESSER, that sought to assist schools during and after the pandemic. Figure 5 shows the sharp increase in federal revenues due to the influx of ESSER funds, especially in high-poverty districts, such as Cleveland and Columbus, that received the bulk of these dollars. With ESSER sunsetting over the past couple years, federal revenues have largely returned to pre-pandemic levels. We all warned that the federal tap would not remain open forever, and now we’re seeing a tough but necessary budget reset due to the expiration of ESSER.
Figure 5: Inflation-adjusted federal revenue per pupil, statewide and selected districts, FY17 to FY25
* * *
Fact-based analyses reveal an outlook for Ohio public schools that’s not nearly as grim as what’s being offered by the doomsdayers typically quoted in the media. Yes, leaner times may be ahead for schools after the inflation-juiced, pandemic-era largesse. But it also seems likely, based on historical patterns, that Ohioans will continue to recognize the importance of education and maintain their generous investments in public schools. That is the version of the story that should also be told.
[1] There is variation across districts in their state funding this year versus last: 464 districts receive more state aid per pupil in FY26 (ranging from $1 to $1,849 per pupil increases), while 143 districts receive less state aid per pupil in FY26 (ranging from -$1 to -$647 per pupil decreases).
[2] Public charter and STEM schools receive almost no local taxpayer funds, which explains the larger state funding amounts they receive compared to traditional districts.