Recent media coverage leaves an impression that Ohio public schools are being shortchanged when it comes to funding. But the sky is not falling and we follow the facts to prove it once again.
Recent media coverage leaves an impression that Ohio public schools are being shortchanged. The Parma City Schools superintendent recently told the press, “We continue to lose money and costs to operate the district continue to rise.” One news reporter wrote: “Public schools are being forced to operate under a new reality after steep cuts in state and federal cuts in school funding.” Sensationalist headline writers have used words like “devastating” and “terrifying” to characterize funding concerns. Big-city news outlets have recently covered the multimillion-dollar budget holes facing districts such as Columbus, Cleveland, and Toledo.
But is the fiscal situation for schools all doom and gloom? Not quite. Consider the following facts:
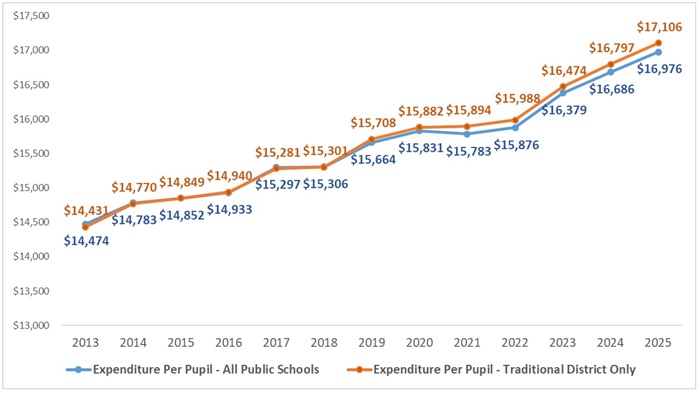
1. Public school expenditures have reached record levels, with spending increases outstripping inflation. After adjusting for inflation (including the Biden-era price spike), statewide public school spending has climbed from roughly $14,500 to $17,000 per pupil between 2013 and 2025—an increase of 17.3 percent. During this twelve-year period, traditional districts registered slightly higher spending increases (18.5 percent) than public charter schools and career-tech centers, a.k.a., JVSDs. Thanks to the state’s longstanding commitment to funding education, along with federal supplements, public schools have received increases that have more than covered the rising cost of doing business.
Figure 1: Ohio’s inflation-adjusted expenditures per pupil, FY13 to FY25
Source: Ohio Department of Education and Workforce, “Expanded List” files. Note: The blue line represents inflation-adjusted (CPI-U) expenditures per pupil for all public schools: traditional district, public charter/STEM schools, and joint-vocational school districts (JVSD). The orange line shows inflation-adjusted expenditures per pupil for traditional districts only. Spending amounts reflect dollars received through state, local, federal, and non-tax sources. The chart does not include capital outlay (e.g., construction and debt service).
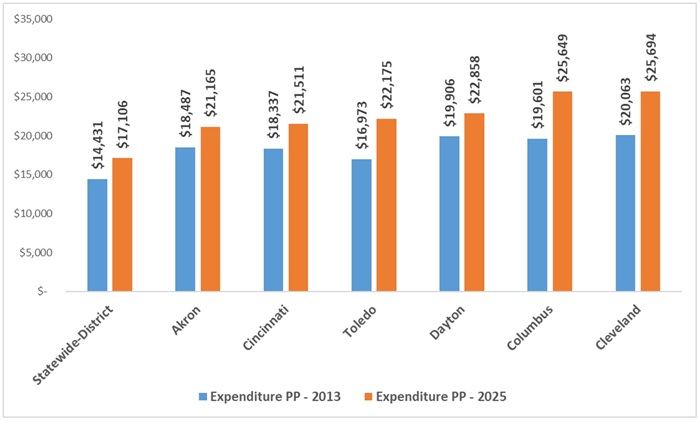
2. Spending in Ohio’s large urban districts tops the state average, and their spending increases have also outpaced inflation. One common claim is that urban districts are chronically underfunded. But this is more myth than reality for Ohio’s big-city school districts. Figure 2 shows that Akron, Cincinnati, Dayton, and Toledo all spent more than $20,000 per pupil in 2025—more than $3,000 per pupil above the state average. In Cleveland and Columbus, spending topped $25,000 per pupil. These figures exceed the statewide average by a range of 21 percent in Cincinnati to 37 percent in Columbus. Consistent with the statewide trend, spending increases in the big urban districts have also risen at a faster rate than inflation. For instance, Cleveland, Columbus, and Toledo all spent $5,000 per pupil more in FY25 than they did in FY13, an even larger increase than the statewide average increase of $2,675 per pupil.
Figure 2: Large urban districts’ expenditures per pupil versus statewide, FY13 and FY25
Source: Ohio Department of Education and Workforce, “Expanded List” files. Note: FY13 expenditures per pupil were adjusted for inflation to 2025 dollars using CPI-U.
3. State aid for public schools is up again this year. Another oft-repeated claim, typically from pundits on the left, is that the state legislature aggressively cut public school funding by putting the brakes on the Cupp-Patterson plan last year. But the numbers don’t support that contention, either. The table below shows that state spending on public schools is up by nearly $187 million compared to last year. Public charter schools and JVSDs receive larger bumps, which is partly explained by their increasing enrollment. Traditional districts in the aggregate receive smaller increases.[1] This is driven by enrollment losses and their soaring local property values—a topic discussed below—which in turn reduces districts’ state funding prescriptions under the Cupp-Patterson model. To be sure, these increases are more modest than what some education advocates had hoped for—who doesn’t dream about more money?—but the fact remains that state funding for public schools is up yet again.
Table 1: State funding for Ohio public schools, FY25 to FY26
Source: Ohio Department of Education and Workforce, Statement of Settlement reports (June 2025 and January 2026). Note: The amounts shown here include state foundation funding, but exclude state-funded property tax reimbursements, school construction funds, and other smaller funding streams. For both years, charter/STEM funding includes per-pupil facilities aid, equity supplements, and high-quality dollars. None of these amounts include local funds (including a state-required minimum 2 percent property tax) or federal dollars.
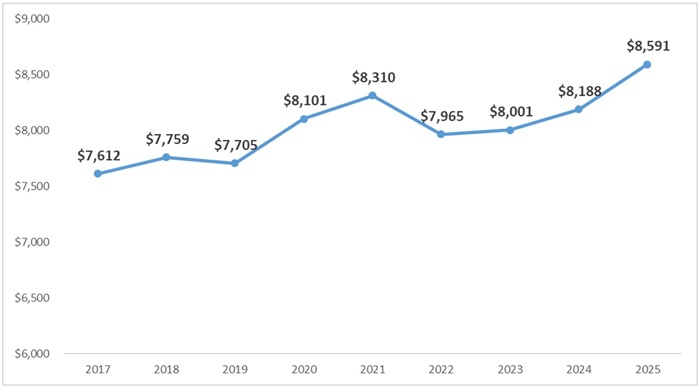
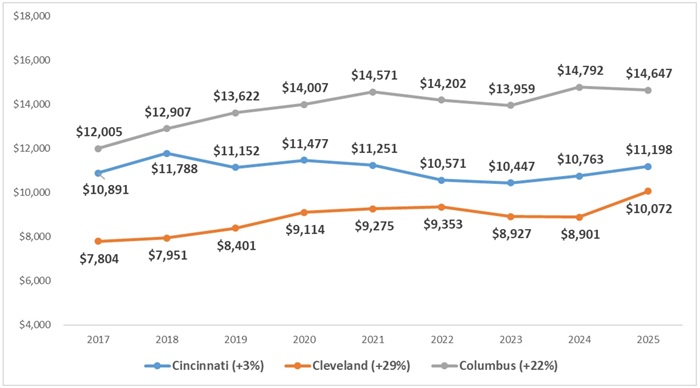
4. School districts’ local tax revenues have risen over the past decade. Funding Ohio schools has long been a joint responsibility of the state government and local districts. The local portion includes a state-required 2 percent property tax, as well as optional taxes that districts levy with voter approval. Widespread increases in property values have helped pushed districts’ local revenues upward at a rate exceeding inflation. In real dollars, statewide local revenue per pupil rose by nearly $1,000 per pupil, or 13 percent, between 2017 and 2025. As Figure 4 indicates, the local revenues of two of Ohio’s three largest urban districts increased at a faster clip than the statewide average: Columbus and Cleveland’s local revenuesper pupil are up 22 and 29 percent, respectively.[2]
With money pouring into districts through property taxes—and citizens voicing concerns about their tax bills—state lawmakers recently enacted new guardrails and transparency measures that protect taxpayers from sticker shock. To help districts navigate these changes, the legislature approved more than $450 million in one-time state funding that will be distributed in FY27 and FY28. Districts’ local revenues will likely grow at more moderate rates moving forward, but that comes after many years of plenitude.
Figure 3: Inflation-adjusted local revenue per pupil, all Ohio districts, FY17 to FY25
Source: Ohio Department of Education and Workforce, “Expenditure Rankings” files. Note: FY17 serves as baseline for the analysis based on data availability.
Figure 4: Inflation-adjusted local revenue per pupil, selected districts, FY17 to FY25
Note: The percentage shown in parentheses indicates the percentage change in local revenues per pupil between FY17 and FY25.
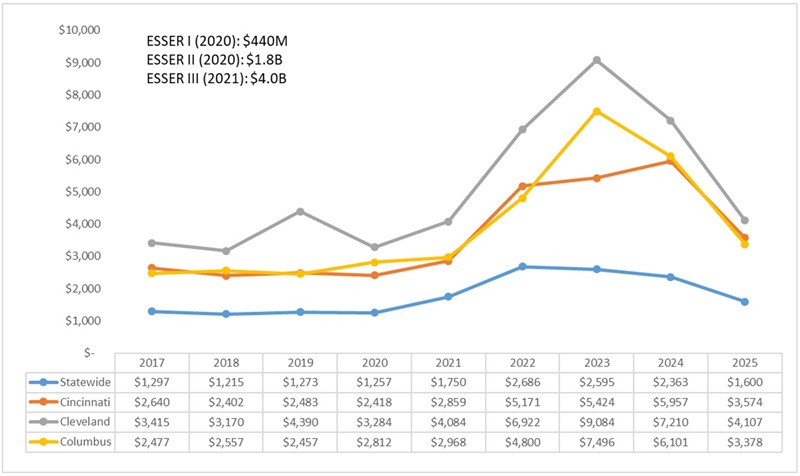
5. Federal aid spiked with an influx of emergency Covid-relief dollars but is returning to normal levels. If state and local funding are both up, why are schools feeling squeezed? One possibility is that districts have cost-containment issues, meaning expenditures are growing at a faster clip than their (increasing) revenues. If that’s happening, the focus should be on managing costs. But another factor is the end of the multibillion dollar federal emergency program, known as ESSER, that sought to assist schools during and after the pandemic. Figure 5 shows the sharp increase in federal revenues due to the influx of ESSER funds, especially in high-poverty districts, such as Cleveland and Columbus, that received the bulk of these dollars. With ESSER sunsetting over the past couple years, federal revenues have largely returned to pre-pandemic levels. We allwarned that the federal tap would not remain open forever, and now we’re seeing a tough but necessary budget reset due to the expiration of ESSER.
Figure 5: Inflation-adjusted federal revenue per pupil, statewide and selected districts, FY17 to FY25
Source: Ohio Department of Education and Workforce, “Expenditure Rankings” files. Note: States, and in turn schools, received Elementary and Secondary School Emergency Relief (ESSER) funds in three portions based on federal legislation passed in 2020 and 2021. The ESSER amounts shown above represent Ohio’s allotments.
* * *
Fact-based analyses reveal an outlook for Ohio public schools that’s not nearly as grim as what’s being offered by the doomsdayers typically quoted in the media. Yes, leaner times may be ahead for schools after the inflation-juiced, pandemic-era largesse. But it also seems likely, based on historical patterns, that Ohioans will continue to recognize the importance of education and maintain their generous investments in public schools. That is the version of the story that should also be told.
[1] There is variation across districts in their state funding this year versus last: 464 districts receive more state aid per pupil in FY26 (ranging from $1 to $1,849 per pupil increases), while 143 districts receive less state aid per pupil in FY26 (ranging from -$1 to -$647 per pupil decreases).
[2] Public charter and STEM schools receive almost no local taxpayer funds, which explains the larger state funding amounts they receive compared to traditional districts.
Ohio kids have recently missed quite a few days of school courtesy of abundant snow and frigid temperatures. For most, this brief time away won’t have a significant academic impact. Delaying lessons about foreshadowing or the slope of a line for a few days of sledding or hunkering down to watch movies isn’t a crisis. But for students who are already chronically absent, additional missed time could be.
Chronic absenteeism, which is defined as missing at least 10 percent of instructional time for any reason, can have a massive impact on academic outcomes. Students who have never been chronically absent are six times more likely to read on grade level by the end of third grade and nine times more likely to graduate from high school on time. Being chronically absent, meanwhile, can negatively impact both academic and social-emotional development. Recovering from pandemic era learning loss, boosting readingand math scores, and improving school quality all hinge on regular student attendance. And yet, according to state report cards, a fourth of Ohio students—roughly 400,000 kids—were chronically absent last year. Thousands more didn’t meet the chronic absenteeism threshold but still missed enough school for it to have a negative impact.
To their credit, state leaders have tried to tackle the problem. In 2023, the Ohio Attendance Taskforce released a series of recommendations aimed at bolstering attendance. In 2024, the Department of Education and Workforce (DEW) published the Ohio Attendance Guide, which outlined district and school practices for early intervention. That same year, Ohio joined more than a dozen other states in pledging to cut chronic absenteeism by half. So far, though, these efforts haven’t moved the needle. The statewide chronic absenteeism rate has improved by fewer than 2 percentage points over the last two years. In some districts, the numbers have actually gotten worse.
Part of the reason why state-level efforts aren’t moving the needle is that attendance is largely a local issue. There are common root causes that can be addressed by state policy, such as poor transportation or parental misconceptions about the importance of regular attendance. But absenteeism causes vary widely from student to student, and some kids have more than one reason for why they have trouble getting to school. State policy can’t and shouldn’t try to address thousands of unique situations. What state policy can do, though, is invest in innovative ideas that will help schools address students’ unique circumstances.
Connecticut offers a solid example. In the spring of 2021, state leaders launched a home-visit initiative called the Learner Engagement and Attendance Program (LEAP). Its primary goal was to address student absenteeism and disengagement by directly connecting with families. As part of the program, 15 high-need districts were provided with funding to pay for school staff and community organizers to visit nearly 8,700 chronically absent students in their homes. A mixed-methods evaluation conducted by the Center for Connecticut Education Research Collaboration indicates that the program had a meaningful impact. For most students, attendance rates increased by 4 percentage points in the month immediately following their first LEAP visit. In subsequent months, attendance rates continued to rise and reached an average increase of roughly 7 percentage points for students served in the summer of 2021 and nearly 15 percentage points for students served during the 2021–22 school year.
Connecticut is a much smaller state than Ohio, with 202 districts and roughly 513,000 public school students compared to Ohio’s 611 districts and nearly 1.7 million students. Connecticut also used federal Covid-relief dollars to fund LEAP,[1] which isn’t an option for Ohio, as those funds are now expired. But these differences don’t mean that the Buckeye State can’t create a similar program. Connecticut’s initial investment was limited to just twelve districts and only cost roughly $10 million. Ohio could follow suit by establishing a pilot project that limits participation to a small number of districts until there’s proof of success. Asking districts to apply if they’re interested, rather than forcing them to participate, would ensure local buy-in. And closely tracking chronic absenteeism rates among all applicants—districts that were accepted into the pilot, as well as those that weren’t—would allow for a genuine evaluation of the program’s effectiveness.
Another innovative way for state leaders to combat chronic absenteeism is by investing in attendance coaches. Similar to the home-visit proposal outlined above, state leaders could establish a pilot program that invites interested districts to apply for a state-funded attendance coach to work in their district. Coaches could collaborate with district and school administrators to analyze real-time data, evaluate current prevention and intervention efforts, identify ways to improve, and train staff on effective implementation. They could support teachers by managing communication with the families of chronically absent students, thereby freeing up teachers’ time to focus on teaching and learning. They could also support students by building relationships with those who are frequently absent, identifying the root causes of their attendance issues, and working alongside them and their families to solve problems.
Investing in attendance coaches is a particularly intriguing idea because state and local leaders are already familiar with the model. As part of Ohio’s early literacy efforts, DEW has sent nearly 100 literacy coaches into more than 100 schools to support educators as they implement the science of reading. During a public meeting last summer, officials from DEW noted that the number of sessions and time spent on coaching activities were “positively associated with increases in student achievement scores over time.” These positive results are likely why lawmakers opted to allocate an additional $24 million to literacy coaching on top of the initial $18 million investment. If state officials believe that reading coaches are boosting reading achievement, then why not try using attendance coaches to boost attendance?
Investing in attendance coaches also dovetails nicely with a recent overhaul of Ohio’s absenteeism policies. These changes were made after districts and schools reported dedicating “a significant amount of staff hours and resources” to implement previous state requirements. Ohio leaders were right to repeal burdensome requirements and leave intervention efforts up to districts. But there are plenty of schools that are going to need support to get it right. Providing the opportunity to work with an attendance coach could help.
***
Small-scale pilot programs aren’t as dramatic or headline-catching as sweeping statewide initiatives. But investing in these two pilots—a home-visit program and an attendance coach initiative—would give Ohio a chance to test innovative solutions without breaking the bank. The state’s current efforts clearly aren’t working. Now is the time to try something different—and these two programs would be a great place to start.
[1] Initially, Connecticut designated just over $10 million in federal Covid-relief funding to support these 15 districts. State lawmakers went on to appropriate additional funds—$7 million in 2022 and another $7 million in 2023—to sustain operations through December 2026.
State report cards have long provided essential transparency and accountability for student learning in Ohio schools. The current framework has commendable features, yet policymakers should make sure that the system functions well and meets intended goals. This is the second in a series that examines report card elements that could use refinement (part one covered chronic absenteeism).
With Ohio’s science of readinglaw on the books, one pressing question is how state policymakers will hold schools accountable for rigorous implementation. In this vein, the Ohio Department of Education and Workforce (DEW) last fall announced it would check whether schools have adopted state-approved reading curricula. That’s a good start, but surely more than compliance reviews will be required. More robust options might include forming an expert state support team—akin to the U.K.’s renowned inspectorate—that conducts site visits, evaluates practices, and recommends improvements. Restoring the state’s third grade retention policy would also heighten accountability for teaching children to read via effective practices.
Though often overlooked in early literacy discussions, another accountability tool is the school report card. To its credit, Ohio has featured an early literacy component on the report card since 2016. But does the measure provide a clear picture of which schools are most effective at teaching reading and which ones need the greatest help? Is the component—as currently designed—up to the task of fairly and rigorously holding schools accountable for literacy outcomes?
Early literacy measure, at a glance
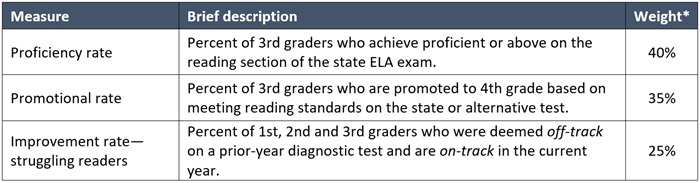
Before diving into policy issues, let us review the mechanics. As Table 1 shows, the early literacy component consists of three underlying elements, which combine and produce an early literacy rating based on a series of weights. The measures include third grade reading proficiency rates, the third-to-fourth grade promotional rate, and an improvement measure for students struggling to read.
Table 1: Structure of Ohio’s early literacy component
Note: (*) Weights are adjusted if a measure does not apply to a school. For more technical detail, see this document from the Ohio Department of Education and Workforce.
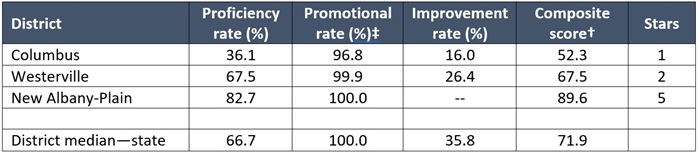
Table 2 illustrates how the measures work using data from three Central Ohio districts of varying levels of student poverty. Starting with Columbus, we see that third grade proficiency lags significantly behind the state’s district median, as well as the rates for Westerville and New Albany-Plain. This reflects, in part, socioeconomically driven achievement gaps (we know those gaps start early), but also—as suggested by its low improvement rate—ineffective reading instruction. Despite the academic challenges, Columbus records a 96.8 percent promotional rate, which mirrors the lofty rates statewide. Still, that’s not enough to help Columbus’s literacy rating, which is a lowly 1 out of 5 stars. As for the suburban districts, Westerville earned 2 stars and New Albany-Plain achieved a 5, though it was exempt from the improvement measure, a loophole discussed later.
Table 2: Ohio’s early literacy measure in action (data from 2024–25)
(†) The composite score is a weighted average across the three measures; the score produces a star rating based on a grading scale set in Ohio administrative rules. (‡) Moving forward, promotional rates are likely to decrease due to a recent legislative change that removes students promoted via parental exemption from the numerator (it will only count students promoted based on a state or alternative test).
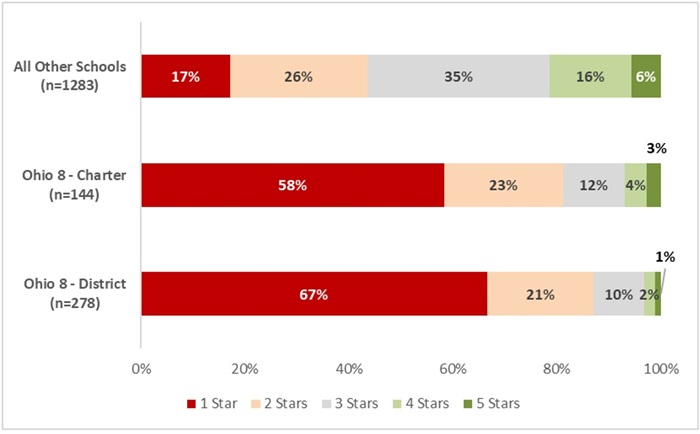
Looking more broadly at the statewide results, Figure 1 shows the early literacy ratings of district and charter schools located in the Ohio Eight cities, as well as all other elementary schools in the state. Very few urban, high-poverty schools fare well on the component: Just 19 out of 422 Ohio Eight schools received 4- or 5-star early literacy ratings (5 percent), while 359 received 1 or 2 stars (85 percent). Schools outside of the large urban areas received higher ratings, though the distribution still leans negative (43 percent 1 or 2 stars versus 22 percent 4 or 5 stars).
Lower early literacy ratings in high-poverty urban areas reflect achievement gaps, as well as the relatively heavy weight proficiency rates receives in the rating calculation. High-poverty urban schools also tend to struggle on the improvement measure, perhaps because they are more likely to enroll students who are furthest from the on-track bar.[1]
Figure 1: Distribution of school-level early literacy ratings, 2024–25
Note: The Ohio Eight cities are Akron, Canton, Cincinnati, Cleveland, Columbus, Dayton, Toledo, and Youngstown.
How to strengthen the early literacy measure
The early literacy component serves important purposes and has its strengths. The use of third grade proficiency rates maintains a clear focus on Ohio’s central goal of ensuring that all children are strong readers by the end of third grade. It’s also the data point that parents are likely to best understand and care about when they search for an elementary school. Including an improvement dimension is also critical in the effort to identify effective and ineffective schools. However, the current measure also has limitations. Below are ways that policymakers could improve it.
1. Eliminate the exemption from the improvement measure. Ohio statute exempts schools from the improvement measure when less than 10 percent of kindergartners are deemed off track in literacy. While this seems like a narrow carveout, it actually lets dozens of schools off the hook for helping struggling readers; 67 districts and 145 schools were exempt last year. It’s not like they are lacking students with reading challenges: In 41 exempt districts, more than 20 percent of third graders fell short of proficiency. All this loophole does is relieve—for no justifiable reason—certain (largely wealthy) schools of accountability for all students’ reading success.
2. Recalibrate the grading scale to better identify high- and low-performers. The state’s grading system produces ratings that make it hard to identify superstar elementary schools—the ones we should be learning from—or ones that require the most help. At the top end, just 80 out of 1,705 elementary schools received a 5-star rating last year (and of them, 56 were not subject to the improvement measure). In other words, it’s slim pickings—so far as the early literacy ratings go—in finding exemplars, particularly in urban communities, where fewer than 2 percent of schools earn 5 stars. At the bottom end, nearly 500 elementary schools received 1-star ratings, mainly located in the Ohio Eight. That’s way too many schools for the state to help with additional assistance or training. Reworking the grading scale, which can be done through revisions to administrative rules, would help ensure that the early literacy rating provides better differentiation in school performance.
3.Explore additional options for refining the improvement measure. The current method, which looks at whether off-track students move to on-track status, is a good start. But it could also miss improvements among students who are far below the “on-track” threshold, and it does not consider the continuing progress of on-track students. State policymakers should explore methods that might offer a sharper and more comprehensive picture of schools’ effectiveness in early literacy. For instance, could the state better leverage diagnostic tests to measure growth, perhaps by looking at changes in students’ scaled scores or percentile rankings? Could it implement a “gap-year” value-added measure that captures changes from the fall of kindergarten (KRA) to third grade state tests to supplement the diagnostic test data? A stronger K–3 growth measure would better assist policymakers and educators in nailing down what’s working schoolwide in early literacy—e.g., specific curricula or professional development. It might also encourage policymakers to increase the weight on growth in the early literacy rating, which could yield results that are more neutral to demographics and allow better identification of high- and low-performing schools, particularly in urban areas.
4. Remove the promotional rate from the component. Starting next year, the promotional rate will include only students who move to fourth grade based on the state’s ELA exam or an alternative assessment. This is an improvement relative to the former method used in 2024–25, as it removes a perverse incentive to socially promote students.[2] The shift, however, could produce early literacy ratings that are even more strongly tied to demographics, as promotional rates will more closely mirror proficiency rates.Including the third-to-fourth grade promotional rate was never a good idea to start with, and it’s best to drop an element that either creates bad incentives and astronomical rates or largely duplicates the information provided through proficiency rates.
* * *
Ohio’s science of reading law promises stronger literacy instruction statewide. But whether that promise is fulfilled in the form of increased reading proficiency hinges on rigorous implementation in thousands of elementary classrooms. Accountability for results is one policy tool that helps ensure schools stick with the science, and enables the state to provide effective, well-targeted supports. With some improvements, Ohio will have an early literacy measure that provides clearer information to parents, communities, and educators about the progress children are making in reading.
[1] At a district-level, improvement rates and student poverty (direct certified) are moderately correlated (r = -0.48), while third grade proficiency and poverty rates are strongly correlated (r = -0.73). Direct certification rates are not available at the school-level.
[2] House Bill 455, passed by the House in late 2025 and now pending in the Senate, proposes to reverse the change and revert to a promotional rate that counts in the numerator students promoted via parental exemption.
The debate over school choice—especially private school choice—is often contentious. Opponents regularly insist supporters are trying to “destroy” or “privatize” public education, and advocating for more options is seen as an attack on public schools.
But I’ve never seen it that way, and I certainly don’t support school choice because I’m anti-public school. I grew up attending public schools, and they helped me become the first person in my family to go to college. My children attended public schools, too. I’ve seen public schools at their best, and I know firsthand the incredible difference a great public school can make for kids and families.
And yet, I support the full range of school choice options—magnet schools, interdistrict open enrollment, public charter schools, private schools, and homeschooling. Not because I want to dismantle public education, but because I believe in a simple principle: Parents should be able to find the school that works best for their child without needing luck, money, or a real estate agent to make it happen.
Since it’s National School Choice Week, this seems like the right time to explain why I support it—especially as someone who believes deeply in public education. My support for school choice didn’t begin as a policy debate or a political campaign. It began in a kindergarten classroom, when I realized my son wasn’t getting what he needed.
How I became a school choice supporter
When I graduated from law school, I was saddled with significant student loan debt. After an extensive search, my wife and I bought a modest starter home in a growing part of Tallahassee that was low- to middle-income and had a highly-rated public school. We were confident our son would have access to a strong education.
After an incredible Montessori preschool experience, our son entered kindergarten eager and ready to learn. But it quickly became clear that something wasn’t right. The classroom didn’t have much for him academically, and instead of receiving instruction that matched where he was, he was often put off to the side. He spent large portions of the day coloring pictures.
As a result, he very quickly came to dislike school. He found it boring and started to disengage, and it was heartbreaking to watch. We worked with the school and advocated for him, but it became clear that the mismatch wasn’t going away.
The unspoken but widely exercised form of school choice
We didn’t have an easy way to choose a different school while staying in our neighborhood. So we did what many families do to access a better school—even if they don’t think of it as school choice. We moved. We sold our house just before Christmas and rented an apartment on the other side of Tallahassee, where we knew the schools were stronger.
When the second semester started, the difference was immediate. My son was assigned to a reading group even though he was still in kindergarten, and he finally started to receive instruction that matched his ability and interest. His learning took off.
By the end of kindergarten, he had read the first Harry Potter book. That didn’t happen because he suddenly became smarter in January, and it didn’t happen because I somehow became a better parent halfway through the school year. It happened because he was finally in a school that met him where he was and helped him keep growing.
A lifelong lesson
That experience changed me. It made something painfully obvious: Families shouldn’t have to sell their house and move just to find a school that works for their child. My family was fortunate. We were able to move, even though it was difficult and disruptive. But millions of families don’t have that option, especially in the middle of a school year.
The part that has stayed with me most is the honest reflection that my child is no more deserving of a high-quality education than anyone else’s. But because I was able to complete a real estate transaction, he gained access to a school that worked better for him. That’s not fairness, and it’s not how opportunity should work in a country that rightly values equal opportunity for all kids.
Why I’ll keep supporting school choice
I support school choice because my personal experience has shown me what happens when meaningful options are limited. I’ve seen how quickly a child can disengage when school becomes a place where they are merely occupying time instead of learning, and I’ve seen what can happen when parents are empowered to act.
During National School Choice Week, I’m proud to say I support school choice in all its forms—and I do so as someone who believes deeply in public education. Public schools will always be the backbone of our education system. We should invest in them and celebrate their successes. But families also deserve options when their assigned school isn’t the right fit. And remember, parents aren’t looking to “destroy” schools—they’re looking for a school that works for their child.
Traditional school districts have increasingly embraced giving students more options within their systems in recent decades, in response to growing charter and private school competition and the desire of district parents for more specialized programs and services for their children. How does district-centric school choice impact the pupil demographics of individual buildings, long governed by race- and income-basedresidential proscriptionsand district attendance lines? A trio of researchers has released a new working paper examining that question.
The research team, led by Francisco Lagos of the Inter-American Development Bank, looks at the 300 largest school districts in the United States to identify which of them implemented a choice-driven admission system any time between 2000 and 2022. They sought districts where at least 50 percent of schools participate in a centralized application process; where applications are submitted through a single, districtwide platform (rather than through individual schools); where parents are allowed to rank multiple choices for their children; and where student assignments occur via random allocation—including lottery for oversubscribed seats—without regard to academic, behavioral, or attendance records.
Seventy-one districts met all these criteria. The remainder comprised a comparison group of so-called “non-choice” districts, which may have incorporated some parental options but did not meet all the criteria. Choice districts were larger on average than non-choice districts (88,942 students compared to 42,844), number of buildings (128.7 versus 57.2), and total area population (611,000 versus 264,000). Choice districts had a higher percentage of charter schools within their borders and exhibited higher levels of school-aged poverty. The researchers use a difference-in-differences design, exploiting the staggered adoption of school choice programs over time, to determine the impact of these programs on school composition, racial exposure[1], and racial/ethnic distribution.
Overall, the introduction of a centralized school-choice admissions system was found to “modestly redistribute students” across district buildings. The exposure of non-White students to White students increased by 1.8 points in choice vs. non-choice districts, and Black students’ exposure to White students specifically rose by 1.6 percentage points. However, White students experienced reduced exposure to all other racial and ethnic groups, likely led by the somewhat surprising finding that the introduction of school choice boosted the number of White students enrolled in those districts. In total, although centralized school choice did impact individual buildings, it did little to alter district-wide patterns of racial and ethnic segregation.
These findings lead Lagos and his team to conclude that school choice should not be introduced into traditional districts as a means to reduce pre-existing segregation patterns, which—it should be stated—is their area of concern and motivation for undertaking the study. But it should not be construed as the primary concern of any of the districts involved. As pervasive as residential- and income-influenced segregation is within traditional school district boundaries, other research has shown that school choice for parents is more about academics, extracurriculars, and school quality than it is about racial or ethnic concerns. It seems more likely that districts are concerned primarily with these important points—specifically to keep their families from moving to charter, private, and micro-schools, or to homeschooling—than they are with unwinding decades of history.
[1] “Exposure” is defined as “the average racial and ethnic composition of the schools attended by students of a given group. This index reflects the probability that a randomly selected student from group A attends a school with students from group B, weighted by the group A population.”