Nearly twenty years ago, state leaders established Academic Distress Commissions (ADCs) as a way for the state to intervene in chronically underperforming districts. Lawmakers significantly strengthened the law in 2015 in the hopes of boosting lackluster results. Instead, they were met with fierce pushback from district officials. By 2021, they’d caved to political pressure and created an easy off-ramp for the three districts that were under ADC control at the time—Youngstown, Lorain, and East Cleveland.
As part of these changes, the school board in each district was required to develop an academic improvement plan. Of the three, East Cleveland submitted the most rigorous and detailed proposal. The plans crafted by Youngstown and Lorain weren’t nearly as promising. In fact, Lorain’s submission was littered with so many incomplete benchmarks that the state was forced to point them out in its review. Despite all this, lawmakers gave Lorain a free pass by dissolving its ADC and its plan before seeing any evidence of improvement.
Two years later, things aren’t looking great in Lorain. East Cleveland, on the other hand, is on the upswing, as evidenced by the three-star rating it earned on its most recent state report card. According to the Department of Education and Workforce, a three-star rating means the district is meeting state standards. That hasn’t happened in East Cleveland since…well, ever. The district earned just two stars during the last two years. Before that, when the state handed out A–F grades, it regularly earned an “F” overall and on most components. Even as far back as 15 years ago, before Ohio established its current report card system, East Cleveland was failing to meet state standards and was under academic watch.
In other words, this three-star rating is a really big deal. Overall ratings can mask issues in specific areas, though, so it’s important to look under the hood to get the full picture of East Cleveland’s performance. To do so, let’s examine results on three of the most significant report card components.
Achievement
Performance index (PI) scores determine a district’s achievement rating by measuring the test results for every student and awarding points based on the state’s six achievement levels. The higher a student’s achievement, the more points the district earns. For example, a student who scores at the advanced level earns their district 1.2 points, while a student testing at the basic level (just below proficient) earns 0.6 points.
Table 1 identifies East Cleveland’s PI scores during the three most recent academic years, as well as 2018–19, the final year before pandemic era disruptions. To put the district’s performance in perspective, the table also includes results from the original ADC districts (Youngstown and Lorain) and the neighboring district of Cleveland. Green shading in the final column indicates a PI score that’s higher than pre-pandemic levels, while red shading indicates that a district has yet to return to pre-pandemic achievement levels.
Table 1. Performance index scores in selected districts

Both East Cleveland and Youngstown earned PI scores in 2025 that were higher than their 2019 results. Not only have these districts bounced back to pre-pandemic levels, they’ve actually gotten better. A gap remains between pre-and post-pandemic numbers for Cleveland, but it’s only 2 percentage points. Lorain, on the other hand, has a gap of 11.4 points.
Progress
The progress component determines the academic growth students make over the course of a year. This measure is crucial, as it showcases a district or school’s contribution to student learning while yielding results that are closer to neutral with respect to demographics. Even in districts where students are far behind in reading and math achievement, the progress component can reveal positive academic growth. Table 2 identifies progress ratings from the last three academic years.
Table 2. Progress ratings on state report cards in selected districts
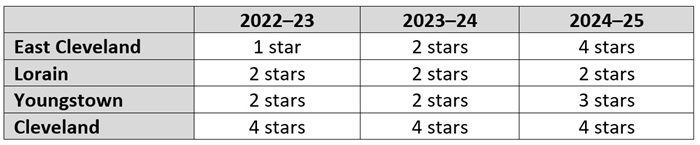
Between 2024 and 2025, East Cleveland’s progress rating jumped from two stars (falling short of state expectations) to four (exceeding state expectations). That kind of improvement is excellent news for kids. Youngstown also showed improvement, as it jumped from two stars to three. And while Cleveland didn’t improve this year, it’s achieved three straight years of four-star ratings. The only district that failed to either reach three stars or improve is Lorain, which has earned a two-star rating for three consecutive years.
Early literacy
The early literacy component offers a detailed look at districts’ progress in reading via three measures. The primary measure calculates how many students score proficient or above on the reading segment of the third grade English language arts test. Table 3 displays these percentages for the four selected districts, as well as the statewide average.
Table 3. Percentage of third graders scoring proficient on the reading segment of state ELA exam in selected districts

East Cleveland is the only district in this group that improved its third grade proficiency rate between 2024 and 2025. It’s important to note that the district still has one of the lowest percentages in the state—only 13 locales registered lower numbers, including Cleveland and Lorain—and that East Cleveland’s 2025 percentage is lower than what it posted in 2023. It’s also important to recognize that the district’s 2025 results are nearly 26 percentage points lower than the statewide average. That’s a huge gap. But even with those caveats, an improvement of 10 percentage points is progress that should be celebrated—especially when comparable districts slid backward.
The early literacy component’s “improving K–3 literacy” measure offers additional proof that East Cleveland is on the upswing in early literacy. This measure uses the results of fall diagnostic assessments to determine the percentage of students who move from “not on track” to “on track” in reading from one year to the next. These results indicate how well districts are improving K–3 literacy throughout all the early grades, not just third, and identifies those making critical progress with struggling readers. Table 4 displays the overall percentage of students that each district moved to on track in reading during the three most recent school years, as well as the difference between 2024 and 2025 results.
Table 4. Results for the improving K–3 literacy measure on state report cards in selected districts
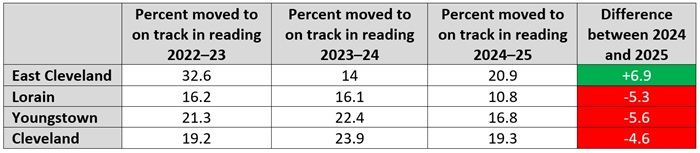
Just like with third grade reading proficiency, East Cleveland is the only district of the bunch that improved. Again, context is important: The district still moved just 20 percent of its off-track readers to on track, and its 2025 percentage is lower than what the district posted in 2023. But a jump of nearly 7 percentage points is still good news—especially when everyone else moved backward.
***
There are two major takeaways we can glean from these data.
First, East Cleveland is trending in the right direction. The district is making progress in several crucial areas, all of which add up to a better overall rating. There’s still plenty of work ahead to recover from more than a decade of poor performance. But district staff, students, and families deserve a lot of credit for how hard they’re working to turn things around. They also deserve credit for refusing to rest on their laurels now that they’re officially meeting state expectations. “It’s not a finish line,” superintendent and CEO Henry Pettiegrew II told Cleveland.com. “It’s definitely a starting point. And we want to see if we can get more stars.”
Second, the two ADC districts that didn’t get a free pass from lawmakers are outperforming the one that did. And it’s not by miniscule margins, either. PI scores in East Cleveland and Youngstown went up this year and are back to pre-pandemic levels. Meanwhile, Lorain’s PI score declined and the gap between its pre- and post-pandemic results is more than 11 percentage points. East Cleveland and Youngstown have improved on the progress component. Lorain hasn’t budged. And while East Cleveland now has an overall report card grade of three stars, Lorain has logged three straight two-star ratings.
Reasonable people can disagree about when and how the state should intervene in low-performing schools. But when a chronically underperforming district that isn’t being held to strict standards slides backward, while two others that are being held accountable leap forward, that seems like a pretty clear indicator that the hands-off approach doesn’t work.
The headline of all this, though, should be East Cleveland’s leap forward. Time will tell whether the district’s efforts produce stable, long-term improvements. But for now, things are definitely looking up.