Mobile Navigation

  • National
    • Policy
      • High Expectations
      • Quality Choices
      • Personalized Pathways
    • Research
    • Commentary
      • Gadfly Newsletter
      • Flypaper Blog
    • Events
    • Scholars Program
  • Ohio
    • Policy
      • Priorities
      • Media & Testimony
    • Research
    • Commentary
      • Ohio Education Gadfly Biweekly
      • Ohio Gadfly Daily
  • Charter Authorizing
    • Application
    • Sponsored Schools
    • Resources
  • About
    • Mission
    • Board
    • Staff
    • Career
Home
Home
Advancing Educational Excellence

Main Navigation

  • National
  • Ohio
  • Charter Authorizing
  • About

Ohio Menu

  • Topics
    • Accountability & Testing
    • Advanced Education
    • Career & Technical Education
    • Charter Schools
    • Curriculum & Instruction
    • ESSA
    • Evidence-Based Learning
    • Governance
    • Personalized Learning
    • Private School Choice
    • School Finance
    • Standards
    • Teachers & School Leaders
  • Research
  • Policy
  • Commentary
    • Ohio Gadfly Newsletter
    • Ohio Gadfly Blog
    • Events

The Education Gadfly Weekly

Sign Up to Receive Fordham Updates

We'll send you quality research, commentary, analysis, and news on the education issues you care about.
Thank you for signing up!
Please check your email to confirm the subscription.

Ohio Gadfly Biweekly—Why voucher opponents are wrong

Volume 14, Number 13
6.18.2020
6.18.2020

Ohio Gadfly Biweekly—Why voucher opponents are wrong

Volume 14, Number 13
view
Why voucher opponents are wrong image
School Choice

Why the opponents of vouchers are wrong

The growth of private school choice programs in Ohio has clearly struck a nerve with the education bureaucracy. After rapid expansion in the number of schools slated to be deemed “low-performing” in 2020–21, which ballooned the number of students eligible for vouchers, choice opponents pushed for massive changes in Ohio’s EdChoice program.

Chad L. Aldis 6.18.2020
OhioOhio Gadfly Daily

Why the opponents of vouchers are wrong

Chad L. Aldis
6.18.2020
Ohio Gadfly Daily

Course grades are no substitute for exam scores

Aaron Churchill
6.16.2020
Ohio Gadfly Daily

Coronavirus has made EdChoice debates even more complicated

Jessica Poiner
6.15.2020
Ohio Gadfly Daily

How do you measure remote learning engagement?

John A. Dues
6.9.2020
Ohio Gadfly Daily

Closing the digital divide for charters

Jessica Poiner
6.22.2020
Ohio Gadfly Daily

Stacks on stacks on stacks: More credentials, more money?

Jeff Murray
6.19.2020
Ohio Gadfly Daily

Resetting school accountability, from the bottom up

6.8.2020
Report
view
Course grades HB 164 blog image

Course grades are no substitute for exam scores

Aaron Churchill 6.16.2020
Ohio Gadfly Daily
view
Covid and vouchers blog image

Coronavirus has made EdChoice debates even more complicated

Jessica Poiner 6.15.2020
Ohio Gadfly Daily
view
Measuring remote learning engagement guest blog image

How do you measure remote learning engagement?

John A. Dues 6.9.2020
Ohio Gadfly Daily
view
Digital divide in charter schools SR image

Closing the digital divide for charters

Jessica Poiner 6.22.2020
Ohio Gadfly Daily
view
Stacking educational credentials SR image

Stacks on stacks on stacks: More credentials, more money?

Jeff Murray 6.19.2020
Ohio Gadfly Daily
view

Resetting school accountability, from the bottom up

Aaron Churchill, Chad L. Aldis 6.8.2020
Report
view
Why voucher opponents are wrong image

Why the opponents of vouchers are wrong

Chad L. Aldis
6.18.2020
Ohio Gadfly Daily

The growth of private school choice programs in Ohio has clearly struck a nerve with the education bureaucracy. After rapid expansion in the number of schools slated to be deemed “low-performing” in 2020–21, which ballooned the number of students eligible for vouchers, choice opponents pushed for massive changes in Ohio’s EdChoice program. Their goal was to shrink the program, and before Covid-19 burst upon the scene, this effort dominated Statehouse debate. 

In January and March, a couple of temporary measures passed that essentially kicked the can six months down the road without settling anything. Perhaps unsure of its legislative prospects and seeking to widen the battle, one prominent voucher critic, the Ohio Coalition for Equity & Adequacy of School Funding, announced last month that it will take to the courts to challenge the legality of EdChoice itself. No word yet on whether the suit will be based on state or federal law, though voucher advocates, mindful of the current composition of the U.S. Supreme Court—as well as past precedent, notably the Zelman decision arising from an Ohio voucher program!—are surely hoping to fight this suit in the federal courts.

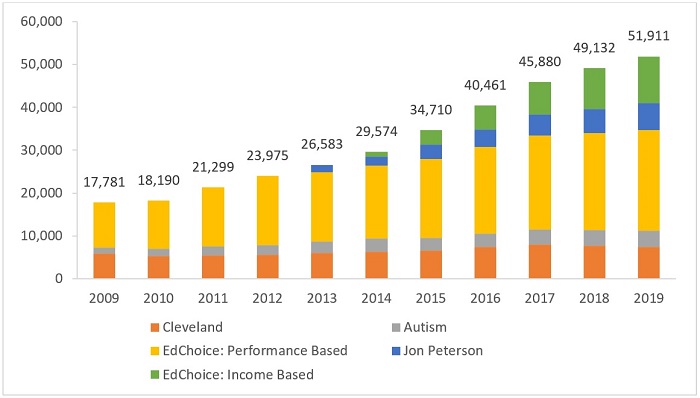
Why the renewed opposition to vouchers, which have been part of the Ohio education landscape for more than two decades? A part, but I think just part, was certainly the expansion of "voucher-eligible" public schools to 1200-plus, now all across the state, including some well-regarded suburbs. But it's not just kids getting EdChoice vouchers by virtue of attending ill-performing public schools. As we see in Figure 1, voucher use has been growing, year after year, tripling the number of participants over the last decade. The education establishment can't really be blamed for getting a little antsy.

Figure 1. Ohio voucher usage by program

Why voucher opponents are wrong figure 1​

The establishment arguments against vouchers, however, fall flat, at least as viewed by this public-school graduate and public-school parent. Here’s why.

First and foremost, when the government requires something of its citizens, as with compulsory education, as a matter of principle it should provide a wide variety of ways to meet the requirement. Between homeschooling, public charter schools, and open enrollment, there are more options available than ever before. Still, many of the options depend on where you live, and the open enrollment options are closed to many of our most disadvantaged students. Ohio has a vast array of private schools, some of which have served students for more than a century. Providing expanded access to them will give many families another way to comply with the state’s compulsory attendance requirements.

Second, we know that one size doesn’t fit all in education (or really much of anything). Yet we continue to assign most students to cookie-cutter schools based on their home address. We expect every local school to be all things to all kids. Then we act surprised when some students struggle. Despite the mounting number of such students, custodians of the current system seek to limit families’ alternatives, most especially when they include private schools.

Third, voucher opponents have spent more time inflaming public sympathies than making substantive arguments against vouchers. Consider the rallying cry that seeks to tie school choice to billionaires. With income inequality what it is, that naturally gets attention. But there’s no evidence that billionaires benefit from other families’ kids attending private schools. So why scapegoat them?

Fourth, opponents contend that vouchers don’t improve academic performance and that they sap traditional public schools of the capacity to serve the students who remain. It’s a powerful argument with obvious appeal. Yet there’s scant evidence that it’s true. Most rigorous analyses suggest that vouchers’ competitive effects—the impact on students who remain in public school—are positive. Participant effects—how voucher users fare academically—are more mixed but still mostly positive, especially if you consider long-term outcomes. If opponents are going to convince policymakers, they’re going to need data that actually support their assertion. Otherwise, erring on the side of liberty in the form of more educational options should continue to win the day.

Finally, when it comes to supporting students to attend private schools, the U.S. is a bit of an outlier—and not in the way you may think. In her report The Case for Education Pluralism, Ashley Berner noted many countries around the world that routinely fund private school education.[1] These countries often surpass the U.S. on international achievement tests. Thus, there’s every reason to think the U.S., if it chose, could devise a framework similar to that used in other countries getting strong results with both public and private schools.

***

While summer may provide a respite, the campaign against vouchers in general and EdChoice in particular will inevitably resume this fall. As we contemplate the claims and contentions of voucher opponents, let’s match them against these inconvenient truths.


[1] Like Berner, EdChoice has also documented the significant amount of private school choice available in other industrialized nations.

view
Course grades HB 164 blog image

Course grades are no substitute for exam scores

Aaron Churchill
6.16.2020
Ohio Gadfly Daily

In late March, state lawmakers gave local schools emergency authority to determine whether students in the class of 2020 satisfied graduation requirements. The reason was fairly straightforward: Due to the school closures, a number of seniors missed opportunities to meet standard graduation requirements, such as passing state end-of-course exams (likely primarily retakes), finishing an industry recognized credential, or completing a few other options. That legislation, however, was mum on requirements for future graduating classes—freshman, sophomores, and juniors, as well as some middle schoolers—whose state end-of-course exams (EOCs) were cancelled.

The just-passed House Bill 164 addresses this complication by allowing final course grades to substitute for scores on the EOCs students were unable to take. An A is equivalent to the top achievement mark on state exams (“advanced”), a B is equivalent to the next highest level (“accelerated”), and so forth. Earning a grade of C or above yields a “competency” designation on the ELA II and algebra I EOCs, the key assessments for meeting graduation requirements. To count toward graduation, the final grade must be earned in the course that is directly associated with the EOC exam. For instance, a pupil’s algebra I course grade substitutes for her state algebra I exam.

If I had my druthers, policymakers would have opted to administer missed EOCs this fall. Yes, much like AP exams, these tests are supposed to be taken shortly after course completion. But schools could have made efforts to review content prior to assessment—arguably time well spent, given the importance of mastery in subjects such as algebra and English. Alas, agreeing with recommendations from the Ohio Education Association and school administrator associations, legislators felt that defaulting to course grades was a better option given the trying circumstances.

While using course grades may be an acceptable Band-Aid for this year, using them in the place of exam scores should not become a permanent fixture in Ohio’s graduation policy. We at Fordham have previously warned against efforts to substitute course grades or grade point averages for state exams to determine graduation. Let’s review, once again, the formidable problems.

  1. Grading practices vary, resulting in a multiplicity of standards. Grading policies and practices are determined locally, and rightfully so. Schools and teachers can and should have flexibility in how they evaluate student work. But this flexibility also results in significant variation from school to school, and even from teacher to teacher. Some schools may have more relaxed grading practices—handing out “easy A’s”—while others have stricter standards. When course grades substitute for exam scores, no uniform bar exists that all students have to clear to earn diplomas. In a violation of basic principles of equity and fairness, some students will meet requirements under laxer academic standards, while others will have to do more in order to graduate.
     
  2. Double standards will hurt students over the long run. One could, of course, argue that all schools can be trusted to set rigorous expectations for student work. But various analyses cast doubt on whether each and every school maintains a high bar. Consider, for example, the findings from the recent curriculum audit of Columbus City Schools. The most common classroom activity in its high schools is “low-level worksheets.” One district administrator said this about the rigor of coursework: “I haven’t gone in one classroom where I have seen grade-level work yet.” Low expectations, likely also manifested in lenient grading, can only do harm to students. When they receive good grades—and are handed diplomas in turn—under soft standards, they’ll suffer the consequences of entering the “real world” without having gained the knowledge and skills needed for true success.
     
  3. Course grades are vulnerable to “gaming” especially when tied to high-stakes decisions. While many educators take grading student work seriously, there have been cases in which course grades have been manipulated. In Washington, D.C., educators awarded passing grades to students who hardly ever showed up for class. Something similar happened almost a decade ago in Columbus, where school officials retroactively changed course grades. In both cases, tampering with grades was done to inflate graduation rates. Though not as blatantly scandalous, teachers may also be pressured, whether by administration, parents, or even students, to award higher grades than they otherwise would—a perverse incentive that is only heightened when diplomas are on the line. These inflated grades can only hurt students who are not only misled by these evaluations but also, as a recent Fordham study found, learn less when teachers soften their grading standards.


  4. Course grades aren’t reliable indicators of academic competency. Much like a driver’s license test, Ohio’s exam requirements aim to ensure that students have the basic skills and abilities needed to navigate life after high school. For the reasons expressed above, course grades cannot provide the same assurances that students are competent in math and English. A study from North Carolina found that a significant number of students who scored poorly on algebra I exams received good course grades in the same subject. Unfortunately, Ohio does not collect course grades to check whether they agree with state exam scores. However, given the national trend in grade inflation, it wouldn’t be surprising to see a sizeable number of students receiving solid grades, but falling short of competency on state exams.

Course grades do, of course, have a place in educational practice. They reflect the evaluations of educators who observe students on a near-daily basis, and they may include other dimensions of a well-rounded education such as teamwork and class participation. But as a consistent yardstick of academic achievement, course grades are poor substitutes for Ohio’s end-of-course exams. As such, the emergency provisions granted to the classes of 2020 to 2023 shouldn’t become the “new normal.”

view
Covid and vouchers blog image

Coronavirus has made EdChoice debates even more complicated

Jessica Poiner
6.15.2020
Ohio Gadfly Daily

It’s no secret that Covid-19 has had a massive impact on schools. Traditional public, charter, and private schools are all feeling the strain of budget cuts, falling revenues, and potential learning loss.

These system-wide issues are critical and worthy of discussion. But it’s also important to remember that, within these larger systems, there are smaller programs and individual students facing unique challenges. For example, Ohio currently funds and operates five voucher programs in which nearly 52,000 students participated during the 2018–19 school year. That number is smaller than the 1.5 million children enrolled in traditional public districts and the 103,000 students who attend charter schools, but it still represents tens of thousands of families.

Each of these programs will be impacted by the pandemic in unique ways. But the state’s two largest voucher programs, both of which fall under the umbrella of the Educational Choice Scholarship Program known as EdChoice, will likely dominate headlines this fall and beyond. The attention they will receive isn’t purely a result of coronavirus; EdChoice has been the center of contentious debate in Ohio since its inception back in 2005. But the fallout of the pandemic has created even more uncertainty around the two programs.

For instance, there’s the issue of eligibility. To obtain a traditional EdChoice voucher, students must attend a school that’s been designated by the state as low-performing. Last fall, ODE released the list of EdChoice-designated schools for the 2020–21 school year. More than 1,200 of the state’s 3,186 traditional public schools made the list, double the number that were identified the previous year. This new list would have greatly increased the number of families who were eligible for a voucher. Unsurprisingly, the expanded list resulted in a ton of pushback from the education establishment. Lawmakers responded by temporarily freezing the list at 517 designated schools for the 2020–21 school year, the same number from the previous year. As a result, the number of participating students probably won’t drastically increase this fall.

But that could change for 2021–22. Lawmakers only temporarily froze the designated schools list. And with no state testing this spring and no report card ratings this fall thanks to the pandemic, the list for 2021–22 will again clock in at roughly 1,200 schools. Thousands of families will be newly eligible, including those who are now seeking an alternative because they are less than thrilled with what their school did (or didn’t) do during remote learning. Despite a potential surge in interest, though, families and voucher advocates shouldn’t hold their breath for a massive expansion. Lawmakers have already expressed an interest in adjusting performance criteria, which would again lower the number of designated schools. Either way, the pandemic and its effects are going to play a large part in the debate going forward.

Income-based vouchers, on the other hand, could see a significant increase in applicants. Students are eligible for this voucher if their family’s total household income is at or below 200 percent of the federal poverty guidelines. For a family of four, that’s a gross annual income of $52,400. The most recent state budget expanded eligibility to all low-income students in grades K–12, and added $50 million to the program starting in 2020–21. Prior to that, only students in grades K–8 would have been eligible. Even before the pandemic, this expansion would have resulted in additional families applying for a voucher. But now, thanks to lengthy school shutdowns and months of remote learning, it’s possible even more low-income families will be interested.

That could be a problem, since Ohio has been forced to conduct a lottery for income-based vouchers over the last several years because demand has exceeded the appropriation available for the voucher. It’s also possible that some state legislators could try to significantly cut funding to the program in an effort to mitigate the economic fallout of the pandemic on traditional public schools. That would leave even more students on the outside looking in, and could shape the debate around vouchers in pretty significant ways.

It’s worth noting that families who apply for a voucher but are rejected due to limited availability aren’t the only ones who are facing problems. EdChoice vouchers rarely cover full tuition, especially in the higher grades. After additional costs such as uniforms, books, and school fees are added to the bill, parents almost always end up supplementing the voucher with their own money. Lower-income families who were sacrificing heavily to supplement their income-based vouchers before the economic slump could soon be forced to make difficult decisions. Imagine being a parent with two children who attend private high schools via vouchers and realizing that, due to your recent job loss, you can only afford to supplement one of those vouchers. What do you do?

Even families who are still able to supplement their vouchers might be facing coronavirus impacts. As a result of the financial downturn, many private schools are facing serious financial problems. These struggles could force schools to downsize or close all together. Dozens across the nation already have. Closures mean there will be fewer seats available for new families, but they also threaten those who have participated in EdChoice for years. These students and their families specifically chose their private schools for academic, cultural, religious, and other reasons. Losing access to them because of an unprecedented, unexpected financial crisis will be extremely difficult to cope with. 

From a policy standpoint, it’s hard to determine how lawmakers could effectively address all these issues. Expanding eligibility and increasing funding so that all families who want a voucher have access to one is the right thing to do for kids. But the state is struggling through a serious economic downturn, and schools of all stripes are facing huge budget cuts and falling revenues. Providing additional funds for one subsection of schools while cutting funding for the rest isn’t fair. But neither is ignoring the outsized impact this virus has had on all children, not just those in traditional public schools. 

In the coming months, lawmakers will have a difficult road ahead of them. There are no easy answers. But as they debate how best to address the fallout of Covid-19, one thing is for certain: They need to identify solutions that will help all students.

view
Measuring remote learning engagement guest blog image

How do you measure remote learning engagement?

John A. Dues
6.9.2020
Ohio Gadfly Daily

Editor’s Note: The Thomas B. Fordham Institute occasionally publishes guest commentaries on its blogs. The views expressed by guest authors do not necessarily reflect those of Fordham.

Author’s Note: The School Performance Institute’s Learning to Improve blog series typically discusses issues related to building the capacity to do improvement science in schools while working on an important problem of practice. However, in the coming months, we’ll be sharing how the United Schools Network, a nonprofit charter management organization based in Columbus, Ohio, is responding to and planning educational services for our students during the COVID-19 pandemic and school closures.

For the last two months, my colleague Ben Pacht and I have been writing about the work we are doing at United Schools Network (USN) in response to the COVID-19 pandemic and the subsequent school closure order in Ohio (see here, here, and here). In this fourth post in the series, we’ll summarize some key points we’ve made before, plus offer a few ideas specific to measuring and analyzing remote learning engagement.

We’ve found that there are five foundational components to measuring engagement in this new remote environment. First, we had to work with teachers and principals in order to develop operational definitions of key remote learning concepts. Second, we had to understand the processes that teachers were using to design and deliver instruction. Third, our schools had to have a method in place to collect engagement data. Fourth, we needed to have a tool for displaying engagement data. Finally, we had to have knowledge of variation in order to interpret the engagement data. The ability to improve engagement is built on this foundation.

1. Operational Definitions. As Ben pointed out recently, the education sector doesn't have a unified definition of student engagement now that we've transitioned to remote learning. Operational definitions for concepts such as remote learning engagement require both a method of measurement as well as a set criteria for judgement. At USN, we first developed operational definitions for lesson, feedback, and grading. These three definitions served as baseline expectations for teachers as they transitioned to designing and delivering remote lessons. For engagement, we settled on the following operational definition: “A USN student demonstrates engagement in a remote lesson by completing the accompanying practice set in its entirety.”

2. Understanding Instructional Processes. As we were developing these operational definitions, we were beginning to study each teacher’s remote learning processes. Even with a well-defined set of procedures, there was variability in individual teacher’s processes due to how fast we had to shift to remote learning. The best way to do this study is to visually represent each teacher’s system through a flow diagram. In our second article in the COVID series, we did a deep dive into an eighth grade math teacher’s lesson design and delivery processes. The important take away is that by representing a teacher’s processes visually, you get a clearer understanding where opportunities exist for improving the system and in turn, student engagement levels.

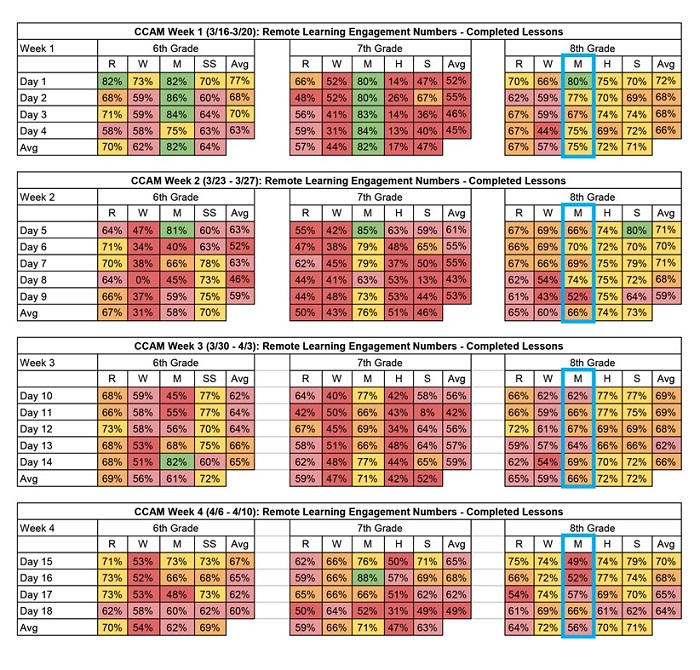
3. Collecting Engagement Data. As a general rule, when it comes to data used for improvement purposes, the more timely the better. Daily is better than weekly, which is better than monthly, as long as we don’t overreact to every data point. At one USN middle school, the leadership team very wisely put a plan in place to track daily engagement levels by student, by grade level, and by subject area within each grade level. A snapshot of these data for the first four weeks (eighteen days) of remote learning engagement is captured in the tables below.
Measuring remote learning engagement chart 1​

The school has continued to collect these data each day during the closure order. Having the data in tables like this is a helpful first step in the measurement process, but it is tough to determine how things are going by looking at the table alone. For example, if you focus on the highlighted eighth grade math column and ask questions like “Are we improving?”, it is pretty tough to answer. Because of this issue, we’ve been studying a method for displaying our engagement data called a Process Behavior Chart.

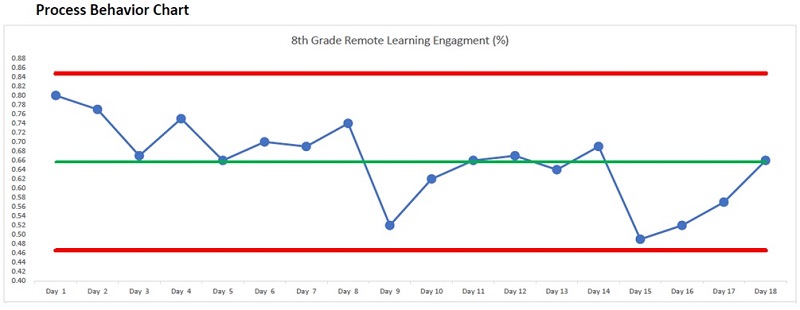
4. Displaying Engagement Data. It’s not an overstatement to say that Process Behavior Charts (PBC) are revolutionizing the way Ben and I are thinking about data analysis. The charts were originally developed at Bell Labs by Walter Shewhart in the 1920’s and then later refined by improvement giants such as W. Edwards Deming. While they can initially be a bit intimidating, they are a powerful tool for both displaying and analyzing data. We’ve included the data for the first eighteen days of remote learning for the eighth grade math class highlighted in the table above in the chart below. Note that PBCs typically have another chart that displays the moving ranges of the data as well but we didn’t include it here for simplicity's sake.
Measuring remote learning engagement chart 2​

Even if you don’t know anything about Process Behavior Charts, just seeing the data from the tables displayed in this way makes an analysis much more intuitive than viewing the data in the tables alone. (A detailed explanation is beyond the scope of this article, but we suggest Mark Graban’s Measures of Success for a great introductory text to PBCs.) When you combine the power of the Process Behavior Chart tool with knowledge of variation, you can then start making better decisions regarding how and when to improve your data.

5. Knowledge of Variation. Without possessing knowledge about systems and variation, there’s a propensity to misinterpret the data. That becomes particularly problematic when these misinterpretations become the basis for policies and blame. There will always be variation in how well individual students, teachers, or schools perform. The key question is: What is the variation telling us about the remote learning system and about the people that work in it? Unfortunately, our brains have biases that make interpreting data extremely difficult. One such bias is that we tend to default to an assumption that there is a single, specific, and often readily observable reason for why results vary. While every data set contains noise, some data sets may contain signals. Therefore, before you can detect a signal within any given data set, you must filter out the noise. Noise is the routine variation of a data set and is not an indication of a meaningful change. Signals are changes of significance within a data set that need attention. The Process Behavior Chart and the way of thinking that goes along with them allow us to distinguish between noises and signals, and in so doing, allow us to make better decisions. This is the foundation of knowledge of variation.

Returning to the eighth grade math chart example above, we can learn a few important things. First, the data indicate a stable system because the plotted points for the first eighteen days remain between the red control limits. (There are other rules for interpreting the data, but those are beyond the scope of this article.) This means that we can reasonably expect that the engagement levels for this eighth grade math class will produce similar results over time, and now that we have the data through Day 43 of remote learning, that is mostly what we see. Second, in the first eighteen days of remote learning, we don’t see any signals of special events in the data. One indicator of a signal would be a single point outside of the red control limits. This means that there haven’t been any significant events, either in a positive or a negative direction, to attend to in this eighth grade math remote learning system. Third, and most importantly, if we are not satisfied with the overall engagement levels in eighth grade math then we have to work on improving the system that is producing those results. This is very different from an approach where we attempt to improve the people working in the system.

With the five foundational components to measuring engagement in this new remote environment in place at United Schools Network, we can now turn our attention to a structured methodology for improving our engagement levels. This improvement methodology will be the focus of our next article in our COVID series.

John A. Dues is the Managing Director of School Performance Institute and the Chief Learning Officer for United Schools Network, a nonprofit charter-management organization that supports four public charter schools in Columbus. Send feedback to [email protected].

view
Digital divide in charter schools SR image

Closing the digital divide for charters

Jessica Poiner
6.22.2020
Ohio Gadfly Daily

Approximately nine million students across the nation lack access to the internet or to internet-connected devices. Lawmakers and educators have known for years that this disparity, often referred to as the “digital divide,” can contribute to achievement and attainment gaps based on race and income. But the sudden and large-scale transition to full-time remote learning brought about by the coronavirus has sparked renewed concerns.

A recently published white paper from the National Alliance for Public Charter Schools (NAPCS) aims to shed additional light on the digital divide by exploring how many charter school students have limited internet connectivity and device availability. Because charter schools generally serve a higher percentage of low-income students than districts, it stands to reason that they would have a higher rate of students with limited access.

Very little data exist at the school level. But the authors were able to approximate connectivity and device access by using the American Community Survey (ACS), which provides household data at the census tract level. Connectivity data indicate the type of internet present in each household, including broadband and dial-up. Low-access homes are those that have dial-up or no internet. Device data indicate whether a household has digital devices such as computers, smartphones, or tablets.

To determine whether students at a specific school lack access, the authors geolocated schools to a census tract. Census tracts contain anywhere from 4,000 to 9,000 people, making it reasonable to assume that a significant portion of a school’s students live in the census tract where the school is located. The authors then used the 2018 ACS data to estimate digital access by multiplying the percentage of low-access households by school enrollment. Virtual charter schools were excluded from the calculations because their students are not tied to a specific geographical location, and because they need devices and connectivity in order to enroll.

The results indicate that although student-level gaps exist in both the traditional public and charter sector, they are likely somewhat larger for charter schools. More than 22 percent of charter students are estimated to lack connectivity, compared to 19 percent of district students. An estimated 13 percent of charter students lack devices, compared to 11 percent of district students. The device results are less compelling, since smartphones—which are typically considered unsuitable for schoolwork—are included in the ACS count of devices.

The paper also estimates digital access at the school level. Schools are considered low access if they are located within a census tract where one third or more of households lack devices or high speed connectivity. In terms of connectivity, approximately one in five charter students and one in eight district students attend a school located in a low-access tract. Charter students are around 60 percent more likely than their district peers to attend a school located in one of these tracts. They are also more than twice as likely as their district peers to be enrolled in a school located in a tract with low access to devices.

The paper also presented student connectivity by state and city. There is considerable variation between states, but of the forty-four with charter sectors, thirty-one have an estimated 20 percent or more of charter students lacking connectivity. Tennessee (nearly 37 percent) and Arkansas (nearly 34 percent) have the highest rates. In terms of total numbers, six states have more than 30,000 charter students who lack connectivity. California and Texas have the largest numbers, at 102,447 and 90,558, respectively.

The fifty cities with the largest number of charter students who have low access account for more than 51 percent of all charter students who likely face connectivity challenges. The top five are Los Angeles (22,150 students), Houston (21,896 students), Philadelphia (19,417 students), Chicago (18,655 students), and Detroit (14,565 students). Four Ohio cities made the top fifty: Cleveland (6,880 students), Columbus (5,643 students), Cincinnati (2,720 students), and Toledo (2,053 students). In all four of these cities, the share of charter students with low access is 25 percent or higher. In Cincinnati, the share is a whopping 39 percent.

The paper estimates that closing the digital divide for charters would cost around $243 million during the first year. Arriving at this dollar amount required making several assumptions, including the type of connection needed (wired versus wireless) and the total cost of devices, support, and insurance for each student. Given the current economic crisis, $243 million seems like a big chunk of change. But even with widespread funding cuts, it’s still a drop in the bucket. There’s a ton of uncertainty around reopening schools in the fall, but many leaders are leaning toward the possibility of hybrid schedules, with plenty of remote learning still happening from home. That means students will need device and connectivity access—and lawmakers will need to decide if paying to close the digital divide is a necessary expense.

Source: Nathan Barrett and Adam Gerstenfeld, “Closing the Digital Divide,” National Alliance for Public Charter Schools (June 2020).

view
Stacking educational credentials SR image

Stacks on stacks on stacks: More credentials, more money?

Jeff Murray
6.19.2020
Ohio Gadfly Daily

Stackable credentials are coordinated pathways of two or more occupation-specific educational credentials—up to and including an associate degree—designed to share coursework and to build upon one another toward greater competency in a job field. Those pathways can be vertical (such as earning a certificate in medical coding followed by an associate degree to administer and manage health IT systems), horizontal (such as a certificate program for energy technology fundamentals that then branches out into related specializations in solar systems and energy efficiency), or lattice (which combines aspects of both). Ohio was a pioneer in developing stackable credential programs, passing its first legislation in 2006. This paved the way for local and statewide initiatives aimed at boosting the program’s effectiveness by creating multiple entry points, establishing credit transfer agreements across institutions, and aligning programs with employer needs.

After more than a decade of effort, very little is known about which pathways students pursue, their completion rates, and outcomes by program. To shed some light on these important questions, RAND researchers partnered with the Ohio Department of Higher Education (ODHE) to examine enrollment and completion data in credential programs from three prominent and high-demand fields: health care, manufacturing and engineering technology (MET), and information technology (IT).

To establish a trendline, the researchers use ODHE data to identify students who completed a first certificate (any credential below an associate degree) in those chosen fields from 2005 to 2013. In 2005, before the stacking push, they find over 2,700 first-time certificate-earners, with the vast majority of those in the health care field. The IT field is at the bottom with just 185 certificates earned. That breakdown continues—and widens—over the years, as the overall number of certificate-earners nearly doubles to over 5,200 by 2013. The IT field shows the fewest number of certificates earned in every year observed, and MET typically records between double and triple the number of IT certificate earners over the years.

However, in looking specifically at stacking, the picture turns upside down. In all but two years, IT certificate-earners lead the stack pack, with 50 percent or more stacking one or more additional credentials (up to and including an associate degree) within two years. By 2013, 59 percent of the individuals who earn a first-time IT certificate go on to stack additional credentials within two years. Meanwhile, only 33 percent of the health care certificate-earners in 2013 do the same. MET certificate-earners are in the middle at 43 percent.

Efforts to make sure that stacking benefits populations traditionally underrepresented in these fields show mixed results. Overall, Black men and women make up just 9 percent of first-time certificate-earners over the observation period; Hispanics, just 6 percent. The racial breakdown of stackers is more even, however: 27 percent of stackers over the observation period are Black, 29 percent are Hispanic, and 30 percent are White. Hispanic stackers predominate in both the IT and MET fields. Demographic variation in stacking is not fully explained by the data, although the researchers note that credential-earners attending Ohio Technical Centers (OTC) are less likely to stack future credentials than are those attending community colleges or universities. They speculate that better access to the latter institutions for minority students could help raise the percentage of stackers in those demographic groups even more.

Within four years of earning their first certificate, 71 percent of stackers top out at the associate degree level, indicating a fairly robust vertical stacking framework. Twenty percent top out at the certificate level—horizontal stackers—and a not-insignificant 9 percent top out with a bachelor’s degree. It should be noted that more than double the percentage of IT stackers top out at a bachelor’s compared to the other two fields. Additionally, a majority of stackers complete their multiple credentials at the same institution, bolstering the notion that Ohio would be well-served by increasing certificate programs—and access to them—at community colleges and universities rather than at OTCs.

As a first look at the data on credential stacking, this report is a helpful starting point. For many individuals, Ohio’s efforts to help build a ladder of credentials appears to be working. But without employment and income data, the analysis is limited to a rough snapshot of who earns credentials, how, and in what fields. It’s also critical for policymakers to know if increased competency also leads to better, higher paying jobs. That’s a question for a future study.

SOURCE: Lindsay Daugherty, et. al., “Stacking Educational Credentials in Ohio: Pathways Through Postsecondary Education in Health Care, Manufacturing and Engineering Technology, and Information Technology,” RAND Corporation (May 2020).

view

Resetting school accountability, from the bottom up

6.8.2020
Report

After a one-year pause in Ohio's school accountability system, the road back to normalcy is uncertain. Fordham's new policy brief titled Resetting school accountability, from the bottom up offers a clear and concise plan to restart state assessments and school report cards. It also proposes solutions that would resolve several hot-button accountability debates, including the use of report card ratings to drive formal policy decisions.

The report includes the following recommendations for 2020–2021:

  • Administer state exams and report all assessment data, but withhold all school ratings

  • Repeal the state’s academic distress commission law

  • Eliminate automatic closure for charter schools

  • Review and evaluate Ohio’s existing school improvement efforts

Starting in 2021–2022, the recommendations include:

  • Implement a revamped report card and issue school ratings

  • Pare back eligibility for performance-based EdChoice vouchers

  • Expand eligibility for income-based EdChoice vouchers

  • Require, subject to capacity, district participation in open enrollment

  • Remove geographic restrictions on charter schools

  • Expand the number of districts eligible for regulatory exemptions

  • Provide bonus funding to both high achieving and improving schools

  • Expand the quality charter school incentive fund

Taken together, these recommendations would allow Ohio to restart—and reset—its education policies in a way that puts transparency about student outcomes and Ohio families and communities at the heart of school accountability.

Fordham Logo

© 2026 The Thomas B. Fordham Institute
Privacy Policy
Usage Agreement

National

P.O. Box 110
Burke, VA 22009

202.223.5452

[email protected]

Ohio

P.O. Box 82291
Columbus, OH 43202

614.223.1580

[email protected]

Sponsorship

130 West Second Street, Suite 410
Dayton, Ohio 45402

937.227.3368

[email protected]