In the wake of the biggest education crisis in living memory, the need for transformational change is palpable and urgent. Accordingly, this report takes a fresh look at a question that is fundamental to the goals of many education reformers: Can a rising tide of charter schools carry students in America's largest metro areas—including those in traditional public schools—before it? And if so, how far?
To address these questions, Fordham's associate director of research, David Griffith, analyzed a decade of data on reading and math achievement at the metropolitan level, as well as nearly two decades of data on charter and traditional public school enrollment. The results are summarized in three findings:
For a more detailed account of the study’s methods, the full results, and the implications for policy, read the full report below. For the full report and Technical Appendix, click “DOWNLOAD PDF.”
 FOREWORD
By Amber M. Northern and Michael J. Petrilli
The education reform engine known as results-based accountability—which was sputtering in the pre-pandemic period—has now all but stalled out. In contrast, the engine known as school choice is firing on all cylinders. Across the country, private school choice programs are proliferating, charters are burgeoning, new models that defy traditional classification are being invented, and a nontrivial percentage of families is leaving the traditional public school system—perhaps for good.
Renewed demand for more effectual alternatives to traditional school districts is one reason that billionaire Michael Bloomberg has doubled down on his investment in urban charter schools. That demand—and his promise of additional supply—is warranted in light of rigorous studies that show attending an urban charter school is associated with faster progress in reading and math, greater odds of enrolling and persisting in an institution of higher learning, and voting—plus a lower likelihood of being incarcerated.
Nationally, charters account for an ever-growing share of total public school enrollment, and they remain the most consequential school choice offering in most metropolitan areas, with 240,000 U.S. students newly enrolled since the start of the pandemic.[1]
Yet much remains poorly understood about the wider implications of charter growth. After all, most estimates of charters’ effects on students are driven by schools that serve a subset of a community’s students—or of a racial or socioeconomic minority—whose families have self-selected into this alternative form of public education. And, like any other promising education innovation, charters may struggle to replicate the successes of early exemplars as they expand to serve a larger and/or more representative population of students and staff. We don’t know whether charter schools can close achievement gaps at scale or whether urban charters can serve as a rising tide that lifts all boats in large metro areas, including student performance in traditional public schools.
Of course we need to be cautious about “gap closing,” for this can also happen when the achievement of higher-scoring kids takes a nosedive. Our preoccupation with learning gaps has also narrowed the scope of schooling and thwarted their transformation. Still, given the mountains of research showing that students who fall behind early have a hard time catching up, it’s worth asking whether education’s greatest innovation has improved the success rates of all children.
As readers may recall, a 2019 study conducted by Fordham’s associate director of research David Griffith found that an increase in the share of Black and Hispanic students who enrolled in charter schools was indeed correlated with a district-wide increase in Black and Hispanic students’ reading and math achievement. That important finding led the Wall Street Journal editorial board to declare that “Charter Schools Ace Another Test.”
The story doesn’t end there. Good reasons exist to keep asking about the impact of growing charter school enrollments on the achievement of all students, whether they attend charters or traditional (district-operated) public schools. First, the data continue to improve. Second, the boundaries that one uses to define a charter “market” could make a big difference. For example, the Phoenix metropolitan area contains at least thirty school districts, and students move relatively freely among them,[2] so any analysis that is limited to individual school districts risks missing the forest for the trees. The metro area is where the market for better schools ultimately operates.
In addition, we recently published an analysis (and interactive website) examining school quality in the nation’s larger metro areas. That study addressed which metro areas were performing well in the pre-pandemic era, not why. One possible explanation is that metros with more charter school attendees perform better. A third purpose of the present study is to test that hypothesis.
So, with David on board again, we decided to revisit in greater depth and with better data the impacts of charter school enrollment share at the metropolitan level.
Our new sample includes 400 metropolitan statistical areas and 534 micropolitan statistical areas—all of which are referred to as “metros” in the report and most of which include not only the urban cores that are the stuff of “I heart New York” postcards but also the surrounding suburbs and exurbs.
Here’s what the new study found:
First, an increase in total charter school enrollment share is associated with a significant increase in the average math achievement of low-income, Black, and Hispanic students, especially in larger metro areas.
This is a big deal. After all, the country’s hundred largest metro areas enroll two thirds of its K–12 pupils, so any policy that works for poor students and students of color in “large” metros has game-changing potential. And because charter schools’ share of total enrollment averages 7 percent in these places, even a conservative reading of the results suggests that most large metro areas would benefit from an increase in charter school enrollment.
Second, increases in Black and Hispanic charter school enrollment share are associated with sizable increases in the average math achievement of these student groups, especially (again) in larger metro areas.
In the average “large” metro area, roughly one in ten poor kids, one in eight Black students, and one in fifteen Hispanic students is currently enrolled in a charter school. To repeat, policies that allow those proportions to rise could yield significant gains for these student groups.
Some of the report’s most compelling results are for Hispanic students, consistent with a 2015 CREDO study that found Hispanic youngsters enrolled in urban charters gained twenty-two days of math learning per year.[3] Yet despite their seemingly transformative outcomes, predominantly Hispanic charters are woefully understudied. To us, this suggests that more attention should be paid to better understanding charters’ successes with Hispanic students.
Third, an increase in total charter school enrollment share is associated with a significant narrowing of a metro area’s racial and socioeconomic math achievement gaps.
It’s possible this result is partly due to declines in the achievement of higher income and/or white students (though the estimates for these groups aren’t statistically significant). That wouldn’t be good. Still, critics who allege that charters exacerbate educational inequality for low-income students and students of color will find no support for that allegation in this report. Rather, the findings suggest that large increases in charter school enrollment share could yield similarly large reductions in longstanding racial and socioeconomic math achievement gaps.
***
It’s not hard to connect the dots: the United States is reeling from a pandemic that has widened and deepened achievement gaps that were already pernicious while depressing the achievement of most students. Getting more children into charter schools could help reverse those dire trends.
INTRODUCTION
This study builds on a 2019 Fordham Institute report that examined the relationship between charter school enrollment share—that is, the share of students in a community who enroll in a charter school—and the average achievement of all the students in that community, including those in traditional public schools.
Like its predecessor, this report seeks to understand the systemic effects of charter schools as well as the potential for diminishing returns as their enrollment share increases. However, unlike the first report, which focused on school districts, this one focuses on metropolitan statistical areas (MSAs), which are an order of magnitude larger and typically encompass multiple school districts (see How is this study different from Fordham’s first Rising Tide report?).
As noted in the Foreword, the broader context—a global pandemic that has scarred the educational experiences of students in every corner of the United States—makes the quest for academic accelerants unusually pressing. But of course, policymakers needn’t start from scratch. Nor should they, if making the most of the current window of opportunity is the goal.
Accordingly, we are taking this opportunity to revisit one of the central questions of education reform: Can a rising tide of charter schools carry all students—including those in traditional public schools—before it? And if so, how far?
Specifically, this study seeks answers to the following research questions:
1. How does an increase in total charter school enrollment share—that is, the percentage of students who enroll in charter schools—affect a metro area’s average reading and math achievement? Are these effects bigger for certain student groups?
2. How do increases in the percentages of Black, White, and Hispanic students who enroll in charter schools affect the average reading and math achievement of each of these student groups?
3. How do increases in charter school enrollment share affect the size of a metro area’s racial and socioeconomic achievement gaps in reading and math?
The report is organized as follows: Background discusses prior research on charter schools and student achievement. Data and methods describes the data, the sample, and the methods. Findings presents the findings. And Takeaways discusses the implications for education policy and practice.
BACKGROUND
Numerous studies have found that enrolling in urban charter schools boosts the academic achievement of low-income, Black, and/or Hispanic students.[5] Other research has found that charter schools’ effects on the achievement of students in traditional public schools in their vicinity are neutral to positive.[6] Together, these literatures imply that the equilibrium effects of charter schools—that is, their effects on all students’ average achievement after accounting for whatever spillover effects are associated with charter school enrollment—are also positive, at least in major urban areas and for the student groups in question.[7] Yet direct evidence on this point is limited, and even observers who believe that charters are having a positive impact acknowledge that we know little about the extent to which returns diminish (or increase) as charter schools’ enrollment share increases within communities—that is, whether a community should expect the same benefits from its fiftieth charter that it derives from its fifth.
To date, only two studies have addressed that last question: The first, a 2019 Fordham report entitled Rising Tide: Charter School Market Share and Student Achievement found a positive relationship between the percentage of Black and Hispanic students who enrolled in a charter school at the geographic school district level and the average achievement of students in these groups—at least in the largest urban districts (see How do this report’s findings compare to those of the first Rising Tide report?).[8] The second study, by Chen and Harris, used similar data but different methods. It found a positive relationship between the percentage of “all students” who enrolled in charter schools and the average achievement of all publicly enrolled students, especially in math.[9]
Still, as anyone who has worked in or attended a charter school in Arizona or Michigan can attest, the boundaries of a traditional school district don’t necessarily define the boundaries of the local education market. And regardless of the unit of analysis, important questions remain unexplored. For example, no extant study has examined the effect that an increase in charter school enrollment share has on the achievement of economically disadvantaged (ECD) students or the racial and socioeconomic achievement gaps that exist within communities. Accordingly, this study utilizes new and better data to examine the relationships between charter school enrollment share and a broader set of achievement outcomes at the metropolitan level (rather than the district level).
DATA AND METHODS
Data for this study come from two sources: The first is the Common Core of Data collected by the National Center for Education Statistics, which includes school-by-grade-by-year-level information on total and subgroup enrollment for every school and year for which states reported such data. The second is the most recent version of the Stanford Education Data Archive (SEDA 4.1), which includes nationally comparable estimates of average metro-area-by-year-by-grade-level achievement in Reading Language Arts and math for ten school years (2008–09 through 2017–18) and six grade levels (grades 3–8), plus a host of other variables.[10]
Per the SEDA documentation, a unit increase in reading or math achievement can be thought of as the progress made by the average student in the average metro area in the average school year—or, for the purposes of this report, as one “year of learning” or “grade level.”
Importantly, SEDA’s achievement estimates reflect the performance of essentially all regular public schools that were physically located within a metro area, including nearly all “brick-and-mortar” charters not classified as “special education” or “alternative” schools;[11] however, more recent versions of SEDA don’t include data on charter school enrollment. Consequently, the variable of interest (“charter school enrollment share”) was constructed by (1) downloading school-by-grade-by-year-level enrollment data from NCES for every charter and traditional public school and every school year from 2000–01 through 2017–18, (2) merging the resulting dataset with SEDA 4.1 at the school-by-year level, and (3) calculating a cohort’s average exposure to charter school enrollment share between Kindergarten and the assessed grade level by dividing total charter school enrollment across relevant grade levels by total public school enrollment across those same grade levels.
Taking the steps outlined above for the “all-students” group yields a “total charter school enrollment share” variable that ranges from zero to 47 percent across a total of 100,477 metro-area-by-grade-by-year-level observations, 5,596 metro-area-by-grade-level units, and 934 metro areas, of which 450 had at least one charter school in the study period (in addition to 400 metropolitan statistical areas, SEDA 4.1 includes 534 micropolitan statistical areas, which are included in the analysis; for simplicity’s sake, we refer to both groups as “metros”).
As Table 1 illustrates, this variable is highly skewed. Still, we do observe total charter school enrollment share in excess of 10 percent 5,064 times across 117 different metro areas, including twenty of the largest one hundred metro areas in the country. Similarly, the distributions of our three measures of subgroup charter school enrollment share—which are based on the percentages of Black, Hispanic, and White students who enrolled in charters—are skewed. However, there are still enough metro areas with white, Black, and Hispanic charter school enrollment share above 10 percent to permit a meaningful analysis of the implications for the average achievement of the students in these groups.
Table 1. Distribution of metro areas with nonzero total or subgroup charter school enrollment share
|
|
0–10%
|
10–25%
|
25–50%
|
50–100%
|
|
Total charter school enrollment share
|
440
|
117
|
19
|
0
|
|
White charter school enrollment share
|
431
|
127
|
25
|
2
|
|
Hispanic charter school enrollment share
|
414
|
118
|
23
|
2
|
|
Black charter school enrollment share
|
330
|
154
|
33
|
4
|
Notes: Columns show the number of metro areas with at least one observation in the specified range of total or subgroup charter school enrollment share for which contemporary reading and math estimates exist for all students and the relevant subgroup. Because many metro areas experienced increases or decreases in charter school enrollment share during the study period, some metro areas are reflected in multiple columns.To isolate the relationship between charter school enrollment share and average reading language arts and math achievement, this study relies on a combination of MSA-by-grade fixed effects, MSA-by-year fixed effects, and state-by-grade-by-year fixed effects, plus a rich collection of observable MSA-by-grade-by-year characteristics (see Technical Appendix). In a nutshell, this "triple differences" model compares different grade levels within the same MSA to see if those where charter school enrollment share grew or shrank experienced relative increases or decreases in achievement—after taking into account observable changes in student demographics and statewide factors that could have impacted scores in the relevant years and grade levels (e.g., an easier standardized test).
Standard errors are clustered at the metro level to account for potential autocorrelation. Unless otherwise noted, data are weighted by the number of tested students in a metro area, grade, year, and subject (see Technical Appendix for unweighted and variance weighted estimates). Finally, because one goal of the report is exploring the potential for diminishing returns, rather than assuming a linear relationship between charter school enrollment share and average achievement, some specifications allow the slope and curve of this relationship to change at the tenth, fiftieth, and ninetieth percentiles of charter school enrollment share.
FINDINGS
Finding 1: On average, an increase in total charter school enrollment share is associated with a significant increase in the average math achievement of poor, Black, and Hispanic students, which is concentrated in larger metro areas.
On average, a one-percentage-point increase in a metro area’s total charter school enrollment share is associated with a 0.025 grade-level increase in the average math achievement of its economically disadvantaged and/or Hispanic students, and there is suggestive evidence that it is associated with a similar increase in Black students’ math achievement (Figure 3).
Figure 3. On average, an increase in total charter school enrollment share is associated with a significant increase in poor and minority students’ math achievement.
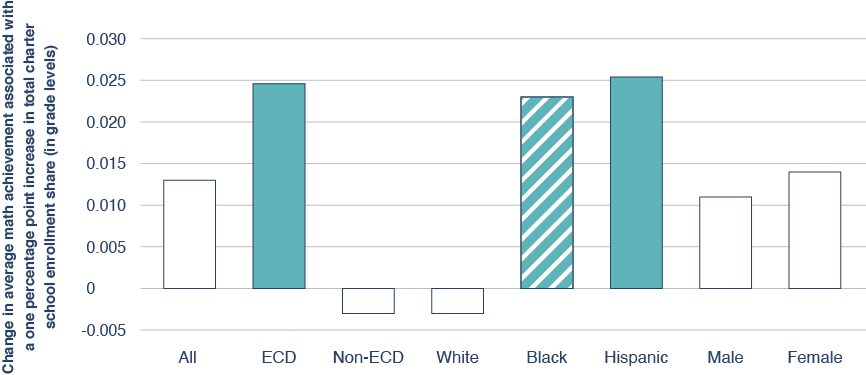
Notes: Solid bars denote significance at the 95 percent confidence level. Striped bars denote significance at the 90 percent confidence level. Empty bars denote estimates that are not statistically significant at conventional levels. ECD stands for economically disadvantaged students.
Notes: Solid bars denote significance at the 95 percent confidence level. Striped bars denote significance at the 90 percent confidence level. Empty bars denote estimates that are not statistically significant at conventional levels. ECD stands for economically disadvantaged students.In contrast, the relationship between total charter school enrollment share and average reading achievement is positive but statistically insignificant for most student groups, with the notable exception of economically disadvantaged students (Figure 4). Per the figure, there is suggestive evidence that, on average, a one-percentage-point increase in total charter school enrollment share is associated with 0.015 grade-level increase in economically disadvantaged students’ reading achievement. And, despite failing to achieve statistical significance, the estimate for Hispanic students’ reading achievement is notably large and positive.
Figure 4. There is suggestive evidence that an increase in total charter school enrollment share is associated with an increase in economically disadvantaged students reading achievement.
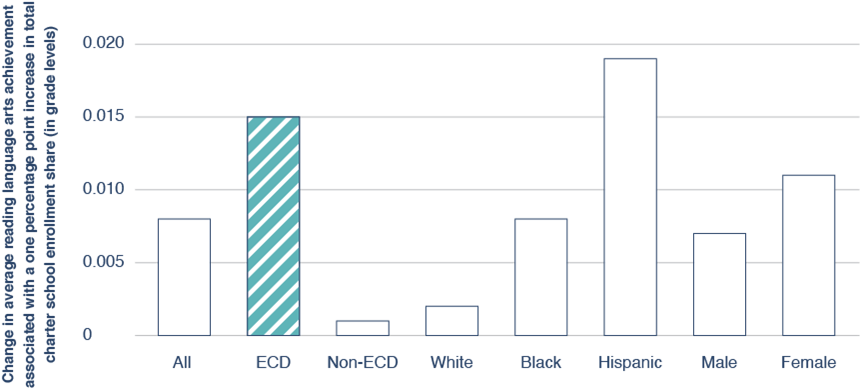
Notes: Striped bars denote significance at the 90 percent confidence level. Empty bars denote estimates that are not statistically significant at conventional levels. ECD stands for economically disadvantaged students.To grasp the implications of these estimates, it helps to consider the potential effects of larger increases in charter school enrollment share. Accordingly, Figure 5 shows the relationship between total charter school enrollment share and economically disadvantaged students’ average math achievement for the full range of charter school enrollment share that we observe—that is, from zero to 47 percent.
Figure 5. On average, an increase in total charter school enrollment share is associated with a significant increase in economically disadvantaged students’ average math achievement.
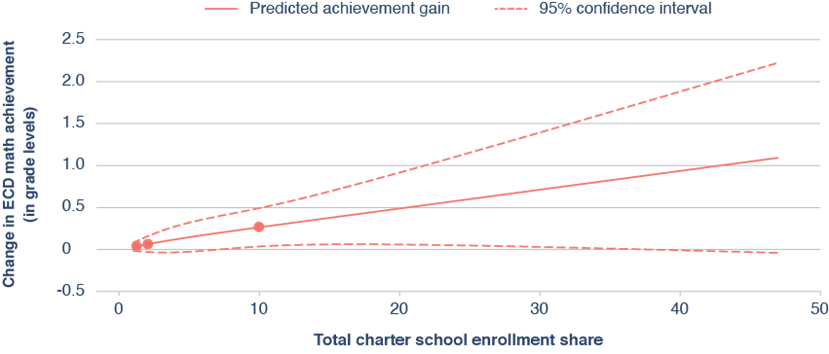
Notes: This graph was generated using the mkspline2 command in Stata. The three red dots are “knots” (i.e., inflection points), which are placed at the tenth, fiftieth, and ninetieth percentiles of total charter school enrollment share. The dotted lines show the 95 percent confidence interval.Because no individual metro area actually experienced a forty-seven-percentage-point increase in total charter school enrollment share during the study period, this figure should be interpreted carefully. Still, a reasonable interpretation of the graph is that, on average, a move from zero to 10 percent charter school enrollment share—that is, a move that more than a dozen metro areas did make during the study period—is associated with a 0.25 grade-level increase in economically disadvantaged students’ average math achievement.[12] Moreover, the slope of the graph beyond the 10 percent threshold suggests that further increases in charter school enrollment share are associated with gains of similar magnitude (note that the assumption that this relationship is linear has been relaxed for the purposes of this figure).
Importantly because the estimates that are the basis for the figure are weighted by enrollment, these gains are probably a better guide to the experiences of larger metros than smaller metros (though, of course, no specific metro area’s experience will match the graph precisely). And in fact, estimates from alternative specifications suggest that these gains are indeed concentrated in larger metro areas (see Technical Appendix).
Finding 2: On average, increases in Black and Hispanic charter school enrollment share are associated with sizable increases in the average math achievement of these student groups, especially in larger metro areas.
On average, a one-percentage-point increase in Hispanic charter school enrollment share is associated with a 0.016 grade-level increase in Hispanic students’ average math achievement (Figure 6). Similarly, there is suggestive evidence that an increase in Black school charter school enrollment share is associated with an increase in Black students’ average math achievement. Specifically, a one-percentage-point increase in Black charter school enrollment share is associated with a 0.01 grade-level increase in average Black achievement.
In contrast, increases in Black and Hispanic charter school enrollment share are not associated with significant increases in those student groups’ reading achievement (though both estimates are positive), nor is an increase in white charter school enrollment share associated with a significant increase in white students’ average reading or math achievement (though, again, the estimates for both subjects are positive).
Figure 6. On average, increases in Black and Hispanic charter school enrollment share are associated with sizable increases in the average math achievement of students in these groups.
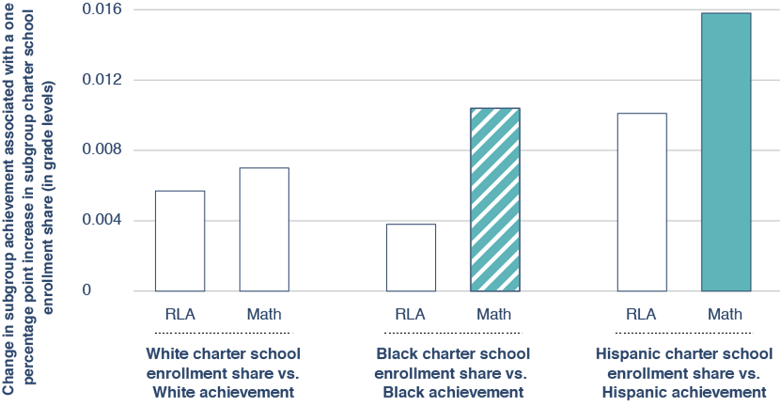
Notes: Solid bars denote significance at the 95 percent confidence level. Striped bars denote significance at the 90 percent confidence level. Empty bars denote estimates that are not statistically significant at conventional levels. RLA stands for Reading Language Arts.To illustrate the potential implications of these results, Figure 7 shows the relationship between Hispanic charter school enrollment share and Hispanic students’ average math achievement for the full range of Hispanic charter school enrollment share—i.e., from zero all the way to 55 percent.
Figure 7. On average, an increase in Hispanic charter school enrollment share is associated with a significant increase in the average math achievement of Hispanic students.
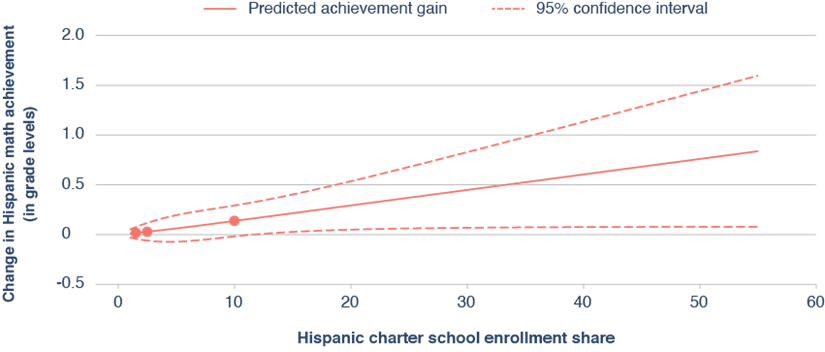
Notes: This graph was generated using the mkspline2 command in Stata. The three red dots are “knots” (i.e., inflection points), which are placed at the tenth, fiftieth, and ninetieth percentiles of Hispanic charter school enrollment share. The dotted lines show the 95 percent confidence interval.Like Figure 5, this figure should be interpreted cautiously, as no individual metro area actually moved from zero to 55 percent Hispanic charter school enrollment share during the study period. Still, a reasonable interpretation of Figure 7 is that, on average, a move from zero to 10 percent Hispanic charter school enrollment share—a move some metro areas did make during the study period[13]—was associated with a 0.14 grade-level increase in Hispanic students’ average math achievement. Moreover, the shape of the graph, which is nearly indistinguishable from a straight line, suggests that further increases in Hispanic charter school enrollment share are associated with similar increases in Hispanic achievement (note that the assumption of linearity has been relaxed for the purposes of this figure).
Because the estimates that are the basis for the figure are weighted by enrollment, these gains are probably a better guide to the experiences of larger metros than smaller metros. And, in fact, evidence from alternative specifications suggests they are highly concentrated in larger metro areas (see Technical Appendix).
Finding 3: On average, an increase in total charter school enrollment share is associated with a significant narrowing of a metro area’s racial and socioeconomic math achievement gaps.
On average, a one-percentage-point increase in total charter school enrollment share is associated with a 0.025 grade-level narrowing of the gap between ECD and non-ECD students’ average math achievement, although there is no significant relationship for reading (Figure 8).
Similarly, a one-percentage-point increase in total charter school enrollment share is associated with a 0.032 grade-level decline in a metro area’s Black-White math achievement gap (though, again, there is no significant relationship for reading).
Figure 8. On average, an increase in total charter school enrollment share is associated with a significant narrowing of a metro area’s Black-White and ECD–non-ECD math achievement gaps.
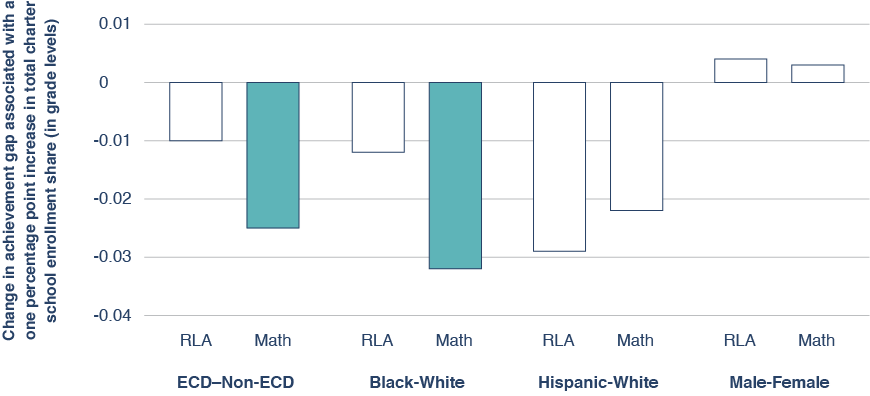
Notes: Solid bars denote significance at the 95 percent confidence level. Empty bars denote estimates that are not statistically significant at conventional levels. ECD stands for economically disadvantaged students.Once again, it is illuminating to see what effects of this magnitude imply about the potential consequences of larger increases in charter school enrollment share. For example, Figure 9 shows the relationship between total charter school enrollment share and the Black-White math achievement gap for the full range of charter school enrollment share—i.e., from zero all the way to 47 percent.
Figure 9. On average, an increase in total charter school enrollment share is associated with a significant decline in a metro area’s Black-White math achievement gap.
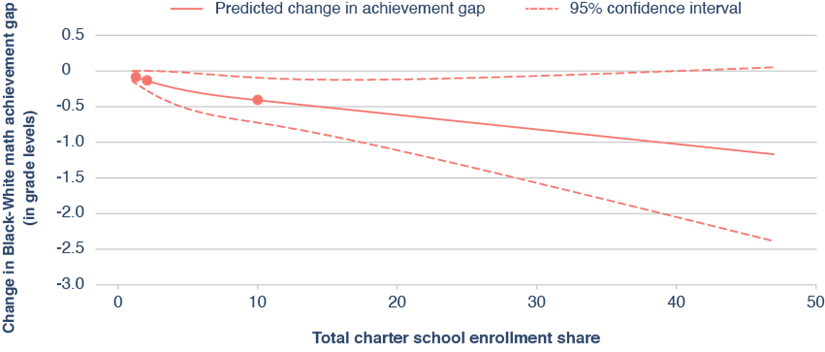
Notes: This graph was generated using the mkspline2 command in Stata. The three red dots are “knots” (i.e., inflection points), which are placed at the tenth, fiftieth, and ninetieth percentiles of total charter school enrollment share. The dotted lines show the 95 percent confidence interval.Like figures 5 and 7, this figure should be interpreted with care, as no individual metro actually moved from zero to 47 percent charter school enrollment share during the study period. Still, a reasonable interpretation is that moving from zero to 10 percent total charter school enrollment share is, on average, associated with a 0.4 grade-level decline in the Black-White math achievement gap, and there is suggestive evidence that further increases in charter school enrollment share are associated with further narrowing of the aforementioned gap.
Similarly, Figure 10 shows the relationship between total charter school enrollment share and the math achievement gap between ECD and non-ECD students.
Figure 10. On average, an increase in total charter school enrollment share is associated with a significant decline in a metro area’s ECD–non-ECD math achievement gap.
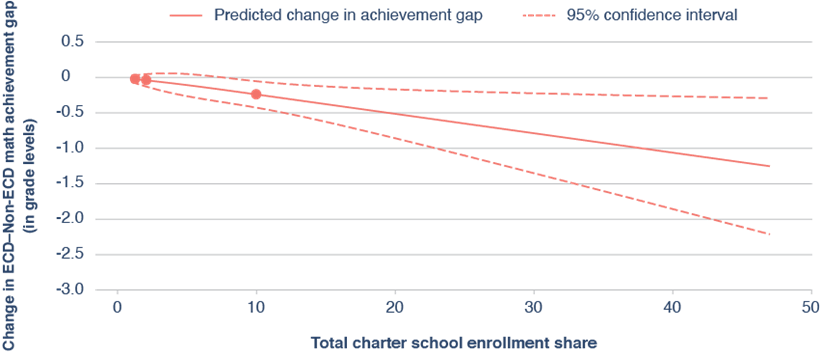
Notes: This graph was generated using the mkspline2 command in Stata. The three red dots are “knots” (i.e., inflection points), which are placed at the tenth, fiftieth, and ninetieth percentiles of total charter school enrollment share. The dotted lines show the 95 percent confidence interval.Like the previous figure, this one should be interpreted cautiously. Still, a conservative interpretation is that a move from zero to 10 percent total charter school enrollment share—that is, a move that at least some MSAs made during the study period—is associated with a 0.25 grade-level decline in a metro area’s ECD–non-ECD math achievement gap. Moreover, the slope of the graph beyond the 10 percent threshold suggests that further increases in charter school enrollment share are associated with similarly meaningful declines.
Because of the glacial speed at which the charter sector has expanded in most places, readers will have to judge for themselves whether it is reasonable to assume that the benefits that some metros reaped by moving from zero to 10 percent charter school enrollment share during the study period can be added to the benefits that other metros seem to have reaped by moving from 10 to 20 percent (and beyond).
Admittedly, some of these changes could be attributable to lower achievement for white and/or non-ECD students, rather than higher achievement for Black and ECD students. But in general, the estimates that are the basis for Findings 1 and 2 suggest the latter is a bigger driver.
For context, the same achievement data that are the basis for these results also suggest that, on average, Black students and ECD students were approximately 2.5 years behind White students and non-ECD students in both reading language arts and math before the pandemic struck.[14]
TAKEAWAYS
1. In general, the growth of charter schools benefits low-income, Black, and Hispanic students academically.
Because this study makes no distinction between the achievement of students in charter schools and that of students in traditional public schools, it’s impossible to say if or to what extent the gains associated with higher charter school enrollment share reflect charter schools’ impacts on enrolled students, as opposed to their competitive effects (or other factors). But regardless of the mechanism, the biggest takeaway from this study is that charters’ effects on the achievement of poor, Black, and Hispanic students are positive, consistent with prior research.
Notably, the results are more consistent and definitive for math than for reading—though even there the estimates for historically disadvantaged groups are encouraging—consistent with the only other study to estimate the effects of increases in charter schools’ enrollment share.[17]
2. More attention should be paid to charter schools’ impressive results with Hispanic students.
Like previous studies, this analysis suggests that many Hispanic students benefit from enrolling in charter schools, especially in the biggest metropolitan areas and in math. Yet the literature on the rapidly expanding supply of predominantly Hispanic charters is shockingly thin.
Because the success of these schools could hold lessons for charters and traditional public schools alike, it would be nice to know how they are approaching things like bilingual education—or at least the education of bilingual students. For example, research suggests that English-language learners in Boston charter schools are well served despite—or perhaps because of—the dearth of specialized programming.[18] But of course, most of the country’s predominantly Hispanic charters are in places like Texas, Florida, and Arizona, all of which have different student populations.
3. Charter schools have the potential to significantly reduce America’s racial and socioeconomic achievement gaps.
Despite the complexity of the data, the salutary effects of increases in charter school enrollment share on racial and socioeconomic achievement gaps are detectable at the metropolitan level. Moreover, the evidence suggests that these reductions are mostly attributable to gains among Black and Hispanic students (though some of the estimates for white and non-ECD students are negative).
Notably, the gains for historically disadvantaged groups seem to be concentrated in the country’s largest communities—that is, in places like New York and Houston, as opposed to Ketchikan and Beeville. Moreover, although caution is clearly warranted, on balance the results suggest that metro areas with higher baseline charter penetration tended to benefit from further increases.
In the wake of a crisis that has seriously exacerbated America’s racial and socioeconomic achievement gaps, any policy that helps to narrow those gaps deserves policymakers’ consideration.
ENDNOTES
[1] Debbie Veney and Drew Jacobs, Voting with Their Feet: A State-Level Analysis of Public Charter School and District Public School Trends (Washington, D.C.: National Alliance for Public Charter Schools, 2021), https://www.publiccharters.org/sites/default/files/documents/2021-09/napcs_voting_feet_rd6.pdf.
[2] Jeanne M.Powers, Amelia M. Topper, and Michael Silver, “Public School Choice and Student Mobility in Metropolitan Phoenix,” Journal of School Choice 6, no. 2 (2012): 209–34, doi:10.1080/15582159.2012.673862.
[3]Center for Research on Education Outcomes, Urban Charter School Study Report on 41 Regions (Stanford, CA: CREDO, 2015), https://www.heartland.org/_template-assets/documents/publications/2016-….
[4]Because of the way the SEDA data were constructed, calculating average exposure to charter school enrollment share for every metro-area-by-grade-by-year-level observation in the dataset is a fraught endeavor; however, while the noisiness of charter school enrollment share makes it harder to detect its effects on student achievement, there is no reason to believe that it is a source of bias. And because charter school enrollment share is highly autocorrelated within cohorts, accounting for prior exposure has little impact on the overall story.
[5] Julian R. Betts and Y. Emily Tang, “The Effects of Charter Schools on Student Achievement,” in School Choice at the Crossroads: Research Perspectives, ed. Mark Berends, R. Joseph Waddington, and John Schoenig (New York: Routledge, 2018), 69–91.
[6]Sarah R.Cohodes and Katharine S. Parham, “Charter Schools’ Effectiveness, Mechanisms, and Competitive Influence” (NBER Working Paper 28477, National Bureau of Economic Research, Cambridge, MA, 2021), doi:10.3386/w28477.
[7] Strictly speaking, this line of reasoning does not account for the possibility that charter schools affect the performance of private schools; however, because those effects are likely positive—or, at worst, neutral—accounting for them is unlikely to affect the bottom line.
[8]David Griffith, Rising Tide: Charter School Market Share and Student Achievement (Washington, D.C.: Thomas B. Fordham Institute, 2019), https://fordhaminstitute.org/national/research/rising-tide-charter-market-share.
[9] Feng Chen and Douglas N. Harris, “The Effects of Market-Based School Reforms on Student Outcomes: A National Analysis of Charter Effects on District-Level School Systems” (working paper, Tulane University, 2020), https://appam.confex.com/appam/2020/mediafile/ExtendedAbstract/Paper361….
[10] For the purposes of this report, we rely on the “gcs” achievement estimates, which allow the estimates to be interpreted in terms of “years of learning.” However, substituting the “cs” estimates yields nearly identical results.
[11]All special education and virtual schools, many alternative schools, and approximately half of schools in highly “remote” or “distant” town/rural locales are not assigned to a specific metro area in SEDA and are therefore excluded from the analysis.
[12] Eight metro areas made this specific move (i.e., moved from zero to at least 10 percent charter school enrollment share). Another ten metro areas made moves of equal or greater magnitude (i.e., experienced at least a 10 percent increase in charter school enrollment share during the study period but from a different starting point). Finally, sixty metro areas experienced five- to ten-percentage-point increases in charter school enrollment share during the study period.
[13] Specifically, at least seven metro areas made this exact move, and at least sixteen others with higher baseline charter school enrollment made moves of similar or greater magnitude.
[14]More precisely, in the average metro, grade, and year in the study period, the gap between White and Black students’ average achievement was approximately 2.1 years of learning in both reading language arts and math; however, when the data are weighted by enrollment, this gap increases to 2.5 years of learning. Similarly, the gap between ECD and non-ECD students’ average achievement was 2.1 years of learning in RLA and 1.9 years of learning in math in the average metro, year, and grade; however, when the data are weighted by total enrollment, these gaps increase to 2.5 and 2.3 years of learning, respectively.
[15]Center for Research on Education Outcomes, National Charter School Study 2013 (Stanford, CA: CREDO, 2013), https://credo.stanford.edu/publications/national-charter-school-study.
[16] For example, CREDO estimates that students in urban charters gained twenty-nine days of learning per year in 2008–09 and fifty-eight days of learning per year in 2011–12.
[17] As noted in the Background section, Chen and Douglas (2020) also find significant gains in math and smaller and less consistent gains in reading language arts, despite having a different unit of analysis and employing different methods.
[18] Elizabeth Setren, “Targeted vs. General Education Investments: Evidence from Special Education and English Language Learners in Boston Charter Schools,” Journal of Human Resources 56, no. 4 (2021): 1073–112, doi:10.3368/jhr.56.4.0219-10040R2.
[19] Notably, one recent study authored by Kyle Abbott, Eric Houck, and Douglas Lee Lauen at UNC Chapel Hill, estimated that 23 percent of charter school students in North Carolina attended a charter school that was located outside their district of residence. To our knowledge, there is no equivalent estimate for any other state, nor are we aware of any attempts to estimate the share of charter school students whose commutes take them across MSA boundaries. Kyle Abbott, Eric Houck, and Douglas Lee Lauen, “Out of Bounds: The Implications of Non-Resident Charter Attendees for North Carolina,” (forthcoming).
[20] For example, Chen and Harris (2020) estimate that moving from zero to >10 percent charter school market share reduces private schools’ enrollment share by one to two percentage points.
[21] For example, suppose that half of the Hispanic students who attend charter schools within the borders of the largest MSAs in the country are “metro switchers” from neighboring MSAs and that these students outperform their Hispanic counterparts in receiving MSAs’ traditional public schools by an average of three grade levels in math. In this hypothetical scenario, a move from zero to 50 percent Hispanic charter school market share would artificially boost Hispanic math achievement in these MSAs by 0.75 grade levels ceteris paribus—that is, roughly as much as the graph relating Hispanic charter school market share to Hispanic math achievement implies. But of course, this scenario is highly unlikely. After all, some of the largest MSAs are more than one hundred miles across, and most MSAs are drawn around (not through) major population centers—and Hispanic students in charter schools do not outperform those in traditional public schools by three grade levels. More plausibly, we might imagine that 20 percent of Hispanic students in charter schools are “metro switchers” and that these students outperform Hispanic students in receiving MSAs by an average of one grade level. In this alternative scenario, the artificial boost to Hispanic students’ average math achievement as Hispanic charter school market share increased from zero to 50 percent would be 0.1 grade levels. In other words, “MSA switchers” would have to be both implausibly high achieving and implausibly numerous to explain the observed relationships between charter school market share and all publicly enrolled students’ academic achievement.
ABOUT THIS STUDY
This report was made possible through the generous support of the Walton Family Foundation, as well as our sister organization, the Thomas B. Fordham Foundation. We are deeply grateful to external reviewer Martin West, professor of education at the Harvard Graduate School of Education, for offering feedback on the methodology.
On the Fordham side, we express gratitude for the careful work of Fordham’s associate director of research, David Griffith, in conducting the study and authoring the report. Thanks also to Chester E. Finn, Jr. for providing feedback on drafts, Pedro Enamorado for managing report production and design, Victoria McDougald for overseeing media dissemination, Will Rost for handling funder communications, and Jeremy Smith for assistance at various stages in the process. Finally, kudos to Pamela Tatz for copyediting, Jonathan Lutton for developing the original (adapted) cover image, and Dave Williams for creating the report’s figures.