
Mobile Navigation

  • National
    • Policy
      • High Expectations
      • Quality Choices
      • Personalized Pathways
    • Research
    • Commentary
      • Gadfly Newsletter
      • Gadfly Podcast
      • Flypaper Blog
      • Events
    • Covid-19
    • Scholars Program
  • Ohio
    • Policy
      • Priorities
      • Media & Testimony
    • Research
    • Commentary
      • Ohio Education Gadfly Biweekly
      • Ohio Gadfly Daily
  • Charter Authorizing
    • Application
    • Sponsored Schools
    • Resources
    • Our Work in Dayton
  • About
    • Mission
    • Board
    • Staff
    • Career
Home
Home
Advancing Educational Excellence

Main Navigation

  • National
  • Ohio
  • Charter Authorizing
  • About

National Menu

  • Topics
    • Accountability & Testing
    • Career & Technical Education
    • Charter Schools
    • Curriculum & Instruction
    • ESSA
    • Evidence-Based Learning
    • Facilities
    • Governance
    • High Achievers
    • Personalized Learning
    • Private School Choice
    • School Finance
    • Standards
    • Teachers & School Leaders
  • Research
  • Commentary
    • Gadfly Newsletter
    • Flypaper Blog
    • Gadfly Podcast
    • Events
  • COVID-19
  • Scholars Program

The Education Gadfly Weekly

Sign Up to Receive Fordham Updates

We'll send you quality research, commentary, analysis, and news on the education issues you care about.
Thank you for signing up!
Please check your email to confirm the subscription.

The Education Gadfly Weekly: The excellence gap and underrepresentation at America’s most selective universities

Volume 22, Number 20
5.19.2022
5.19.2022

The Education Gadfly Weekly: The excellence gap and underrepresentation at America’s most selective universities

Volume 22, Number 20
view
High Expectations

The excellence gap and underrepresentation at America’s most selective universities

America’s education system suffers from a variety of “excellence gaps”—sharp disparities in performance by race and class at the highest levels of academic achievement. These gaps explain why college administrators turn to various forms of affirmative action in order to create freshmen classes that more closely represent the nation’s diversity—actions that may soon be declared unconstitutional. But when do these gaps start?

Michael J. Petrilli 5.19.2022
NationalFlypaper

The excellence gap and underrepresentation at America’s most selective universities

Michael J. Petrilli
5.19.2022
Flypaper

“What do you mean, ‘proficient’?” The saga of NAEP achievement levels

Chester E. Finn, Jr.
5.19.2022
Flypaper

Evidence, struggling math students, and California’s 2022 math framework

Tom Loveless
5.19.2022
Flypaper

What does teacher certification contribute to outcomes for students with disabilities?

Jeff Murray
5.19.2022
Flypaper

More data on the impact of remote and hybrid learning during the pandemic

Julia Wolf
5.19.2022
Flypaper

Education Gadfly Show #820: Social-emotional learning doesn’t have a hidden agenda

5.18.2022
Podcast

Cheers and Jeers: May 19, 2022

The Education Gadfly
5.19.2022
Flypaper

What we're reading this week: May 19, 2022

The Education Gadfly
5.19.2022
Flypaper
view

“What do you mean, ‘proficient’?” The saga of NAEP achievement levels

Chester E. Finn, Jr. 5.19.2022
Flypaper
view

Evidence, struggling math students, and California’s 2022 math framework

Tom Loveless 5.19.2022
Flypaper
view

What does teacher certification contribute to outcomes for students with disabilities?

Jeff Murray 5.19.2022
Flypaper
view

More data on the impact of remote and hybrid learning during the pandemic

Julia Wolf 5.19.2022
Flypaper
view

Education Gadfly Show #820: Social-emotional learning doesn’t have a hidden agenda

Michael J. Petrilli, Robert Pondiscio, Amber M. Northern, Ph.D. 5.18.2022
Podcast
view

Cheers and Jeers: May 19, 2022

The Education Gadfly 5.19.2022
Flypaper
view

What we're reading this week: May 19, 2022

The Education Gadfly 5.19.2022
Flypaper
view

The excellence gap and underrepresentation at America’s most selective universities

Michael J. Petrilli
5.19.2022
Flypaper

Last fall, I wrote about the gender gap in America’s universities and argued that its primary cause is what was happening—or not—in our elementary schools. In short, boys fall behind girls in reading in the earliest grades, and they never catch up. And it is this factor more than anything else—more than some calamity impacting teenage boys, more than a tsunami of disaffected young men—that explains why so many more women graduate high school prepared to succeed in college. If we could improve America’s approach to early literacy instruction, particularly for boys, we might nip the gender gap in the bud.

Now I’d like to turn to what Jonathan Plucker and Scott Peters have termed the “excellence gap”—the sharp disparity by race and class in performance at the highest levels of academic achievement. Here I find myself interested in what may happen if the newly assertive Supreme Court conservative majority bans affirmative action on the basis of race in college admissions, as seems likely.

The connection between the excellence gap and affirmative action should be obvious. College administrators would not have to twist themselves into knots to find ways to admit more Black, Hispanic, and low-income students into highly selective institutions were it not for the pervasiveness of the excellence gap.

Consider: In 2015–16, the most recent year for which we have national data, Black, Hispanic, and poor students remained underrepresented in America’s “very selective”[1] universities—this despite widespread use of various forms of affirmative action.

Table 1: Student composition of America’s “very selective” colleges, 2015–16

1

Sources: Digest of Education Statistics 2016, National Center on Education Statistics, Table 101.20., “Estimates of resident population, by race/ethnicity and age group: Selected years, 1980 through 2016,”; Race and Ethnicity in Higher Education (REHE): A Status Report, American Council on Education, by Lorelle L. Espinosa, Jonathan M. Turk, Morgan Taylor, and Hollie M. Chessman; “A Rising Share of Undergraduates Are From Poor Families, Especially at Less Selective Colleges,” Pew Research Center, by Richard Fry and Anthony Cilluffo; and “People in Poverty by Selected Characteristics: 2015 and 2016,” Income and Poverty in the United States: 2016, Census Bureau, by Jessica L. Semega, Kayla R. Fontenot, and Melissa A. Kollar.

Yet if the racial and socioeconomic composition of this cohort of students reflected academic achievement, complete with the excellence gaps we see among groups, the underrepresentation of poor, Black, and Hispanic students would have been much worse.

To illustrate this, let’s add to the picture the composition of students scoring at the “advanced” level of the National Assessment of Educational Progress in reading and math when this cohort of students was in the twelfth grade.

Table 2: Student composition of America’s “very selective” colleges, 2015–16, versus student composition of twelfth graders who scored “advanced,” 2013

2

Source: National Assessment of Educational Progress, twelfth Grade Reading and Math, 2013 (when this cohort of students was in high school). Note: Poor is defined as eligible for free or reduced-price lunch; that includes students whose families earn up to 185 percent of the federal poverty line. * Fewer than one percent of Black students and poor students scored at Advanced.

This is a devastating picture of the lack of diversity among America’s academic high achievers at the end of high school. Just 2 percent of high-achieving twelfth graders in reading are Black; the number is likely even lower when it comes to math. Hispanic students only fare better in comparison, comprising 7 and 5 percent, respectively, of the highest achievers in reading and math, despite making up 20 percent of the overall student population. Meanwhile, the number of poor students achieving at the highest level in reading is a third of the size it would be if income levels didn’t matter, comprising just 12 percent of the high-achieving group versus 36 percent overall. And as with Black students, the results are even worse for math.

This is how it looks if we examine a somewhat broader group of students—those scoring in the top quartile of NAEP in the twelfth grade.

Table 3: Student composition of America’s “very selective” colleges, 2015–16, versus student composition of twelfth graders who scored in the top quartile, 2013

3

Source: National Assessment of Educational Progress, twelfth Grade Reading and Math, 2013 (when this cohort of students was in high school).

This picture is not much prettier, particularly for Black students, who made up just 4 percent of top-quartile achievers in reading and math in the twelfth grade.

Now, to be clear, tests aren’t the only way to measure college readiness, and they certainly are no measure of someone’s character or human worth. But there’s little doubt that they are related to the skills needed to excel in college—which, after all, is fundamentally an academic pursuit, especially at our most selective universities.

In coming weeks, in a series of posts, I’m going to try to make sense of these data and understand what might be done to change these outcomes. At the risk of giving away the ending, let me foreshadow my basic findings:

1. To a very large degree, these disparities are explained by socioeconomic differences. That lines up with previous research, and also fits with common sense. The students who perform well academically, especially at the tippy-top of the distribution, are much more likely to come from the upper middle class and above; to live in safe and affluent neighborhoods, full of two-parent families; and to have two college-educated parents themselves. Students who struggle, on the other hand, are much more likely to live in poverty and amid all of the scourges it presents, from “adverse childhood experiences” to lead poisoning to unaffordable child care and on and on.

And it is a simple but tragic fact that, in America today, White students are much more likely to grow up in middle and upper middle class families than Hispanic and, especially, Black students. The socioeconomic excellence gap explains much of the racial excellence gap, and is in turn explained mostly by socioeconomic inequality itself. As we will see, these patterns are in place, more or less, as early as the start of elementary school. That indicates that socioeconomic inequality, especially between conception and kindergarten, explains much of what we’re seeing.

2. However, there’s evidence that the excellence gap widens somewhat while students are in the K–12 system, especially in the earliest years. Using NAEP exams and the Early Childhood Longitudinal Study, we can travel in our Wayback Machine to look at the patterns at high levels of achievement when this cohort of students was in the eighth grade, fourth grade, and even kindergarten. And we will see that the excellence gap is not quite as large in early grades, especially in kindergarten. There’s something of a silver lining in that finding because it indicates that something is happening in our schools that is causing the gap to widen—meaning that there’s something our schools can do to address it.

If we could imagine a world in which excellence gaps did not exist, we could picture a world in which college admissions processes could be much more straightforward. They could ditch affirmative action and be neutral when it comes to race, class, and yes, gender and still yield freshman classes that represent the nation’s diversity.

Alas, we don’t live in that world, at least not yet. But there are clues that making changes in the earliest years of elementary school could indeed make a big difference—and a big dent in the excellence gap. We’ll explore those clues next time.


[1] According to the REHE report, “The measure of institutional selectivity used in this chapter was created by NCES to classify public and private nonprofit four-year institutions only. The measure uses three criteria derived from the Integrated Postsecondary Education Data System (IPEDS): (1) whether an institution was open admission, (2) the undergraduate admission rate, and (3) the 25th and 75th percentiles of ACT and/or SAT scores. For non-open admission institutions, an index was created from the admission rate and ACT/SAT data (weighted equally). Institutions were classified as very selective if they were among the top quartile of the index.” “Very selective universities” serve about 19 percent of all college students, or 8 percent of all 18- to 24-year-olds.

view

“What do you mean, ‘proficient’?” The saga of NAEP achievement levels

Chester E. Finn, Jr.
5.19.2022
Flypaper

As I write this, representative samples of fourth and eighth graders are taking National Assessment of Educational Progress tests in math and English. These exams must be held every two years in accordance with federal law to determine how well ongoing education reforms are working, whether achievement gaps between key demographic groups are growing or shrinking, and to what extent the nation is still “at risk” due to weakness in its K–12 system. Best known as “The Nation’s Report Card,” the NAEP results have long displayed student achievement in two ways: as points on a stable vertical scale that typically runs from 0 to 300 or 500 and as the percentages of test takers whose scores reach or surpass a trio of “achievement levels.” These achievement levels—dubbed “basic,” “proficient,” and “advanced”—were established by the National Assessment Governing Board, an almost-independent twenty-six-member body, and have resulted in the closest thing America has ever had to nationwide academic standards.

Though the NAEP achievement levels have gained wide acceptance amongst the public and in the media, they are not without their detractors. At the outset, the idea that NAEP would set any sort of achievement standards was controversial; what business had the federal government in getting involved with the responsibilities of states and localities? Since then, critics have complained that the achievement levels are too rigorous and are used to create a false sense of crisis. Now, even after three decades, the National Center for Education Statistics continues to insist that the achievement levels should be used on a “trial basis.”

How and why all this came about is quite a saga, as is the blizzard of controversy and pushback that has befallen the standards since day one.

Recognizing the need for performance comparisons

In NAEP’s early days, results were reported according to how test takers fared on individual items. It was done this way both because NAEP’s original architects were education researchers and because the public-school establishment demanded that this new government testing scheme not lead to comparisons between districts, states, or other identifiable units of the K–12 system. Indeed, for more than two decades after the exams’ inception in 1969, aggregate NAEP data were generated only for the nation as a whole and four large geographic quadrants. In short, by striving to avoid political landmines while pleasing the research community, NAEP’s designers had produced a new assessment system that didn’t provide much of value to policymakers, education leaders, journalists, or the wider public.

Early critical appraisals pointed this out and suggested a different approach. A biting 1976 evaluation by the General Accounting Office said that “unless meaningful performance comparisons can be made, states, localities, and other data users are not as likely to find the National Assessment data useful.” Yet nothing changed until 1983, when two events heralded major shifts in NAEP.

The first stemmed from a funding competition held by the National Institute of Education. That led to moving the main contract to conduct NAEP to the Princeton-based Educational Testing Service from the Denver-based Education Commission of the States. ETS’s successful proposal described plans to overhaul many elements of the assessment, including how test results would be scored, analyzed, and reported.

The noisier event that year, of course, was the declaration by the National Commission on Excellence in Education that the nation was “at risk” because its schools weren’t producing adequately educated graduates. Echoed and amplified by education secretaries Terrel Bell and Bill Bennett, as well as President Reagan himself, A Nation at Risk led more state leaders to examine their K–12 systems and find them wanting. But they lacked clear, comparative data by which to gauge their shortcomings and monitor progress in reforming them. The U.S. Department of Education had nothing to offer except a chart based on SAT and ACT scores, which dealt only with a subset of students near the end of high school. NAEP was no help whatsoever. The governors wanted more.

Some of this they undertook on their own. In mid-decade, the National Governors Association, catalyzed by Tennessee governor Lamar Alexander, launched a multi-year education study-and-renewal effort called “Time for Results” that highlighted the need for better achievement data. And the Southern Regional Education Board (also prompted by Alexander) persuaded a few member states to experiment with the use of NAEP tests to compare themselves.

At about the same time, Secretary Bennett named a blue-ribbon “study group” to recommend possible revisions to NAEP. Ultimately, that group urged major changes, almost all of which were then endorsed by the National Academy of Education. This led the Reagan administration to negotiate with Senator Ted Kennedy a full-fledged overhaul that Congress passed in 1988, months before the election of George H.W. Bush, whose campaign for the Oval Office included a pledge to serve as an “education president.”

The NAEP overhaul was multi-faceted and comprehensive, but, in hindsight, three provisions proved most consequential. First, the assessment would have an independent governing board charged with setting its policies and determining its content. Second, in response to the governors’ request for better data, NAEP was given authority to generate state-level achievement data on a “trial” basis. Third, its newly created governing board was given leeway to “identify” what the statute called “appropriate achievement goals for each age and grade in each subject to be tested.” (A Kennedy staffer later explained that this wording was “deliberately ambiguous” because nobody on Capitol Hill was sure how best to express this novel, inchoate, and potentially contentious assignment.)

In September 1988, as Reagan’s second term neared an end and Secretary Bennett and his team started packing up, Bennett named the first twenty-three members to the new National Assessment Governing Board. He also asked me to serve as its first chair.

The lead up to achievement levels

The need for NAEP achievement standards had been underscored by the National Academy of Education: “NAEP should articulate clear descriptions of performance levels, descriptions that might be analogous to such craft rankings as novice, journeyman, highly competent, and expert… Much more important than scale scores is the reporting of the proportions of individuals in various categories of mastery at specific ages.”

Nothing like that had been done before, though ETS analysts had laid essential groundwork with their creation of stable vertical scales for gauging NAEP results. They even placed markers at fifty-point intervals on those scales and used those as “anchors” for what they termed “levels of proficiency,” with names like “rudimentary,” “intermediate,” and “advanced.” Yet there was nothing prescriptive about the ETS approach. It did not say how many test takers should be scoring at those levels.

Within months of taking office, George H.W. Bush invited all the governors to join him—forty-nine turned up—at an “education summit” in Charlottesville, Virginia. Their chief product was a set of wildly ambitious “national education goals” that Bush and the governors declared the country should reach by century’s end. The third of those goals stated that “By the year 2000, American students will leave grades four, eight, and twelve having demonstrated competency in challenging subject matter including English, mathematics, science, history, and geography.”

It was a grand aspiration, never mind the unlikelihood that it could be achieved in a decade and the fact that there was no way to tell if progress were being made. At the summit’s conclusion, the United States had no mechanism by which to monitor progress toward that optimistic target, no agreed-upon way of specifying it, nor yet any reliable gauge for reporting achievement by state (although the new NAEP law allowed for this). But such tools were obviously necessary for tracking the fate of education goals established by the governors and president.

They wanted benchmarks, too, and wanted them attached to NAEP. In March 1990, just six months after the summit, the National Governors Association encouraged NAGB to develop “performance standards,” explaining that the “National Education Goals will be meaningless unless progress toward meeting them is measured accurately and adequately, and reported to the American people.”

Conveniently, if not entirely coincidentally, NAGB had already started moving in this direction at its second meeting in January 1989. As chair, I said that “we have a statutory responsibility that is the biggest thing ahead of us to—it says here: ‘identify appropriate achievement goals for each age and grade in each subject area to be tested.’ …It is in our assignment.”

I confess to pushing. I even exaggerated our mandate a bit, for what Congress had given the board was not so much assignment as permission. But I felt the board had to try to do this. And, as education historian Maris Vinovskis recorded, “members responded positively” and “NAGB moved quickly to create appropriate standards for the forthcoming 1990 NAEP mathematics assessment.”

In contrast to ETS’s useful but after-the-fact and arbitrary “proficiency levels,” the board’s staff recommended three achievement levels. In May 1990, NAGB voted to proceed—and to begin reporting the proportion of students at each level. Built into our definition of the middle level, dubbed “proficient,” was the actual language of the third goal set in Charlottesville: “This central level represents solid academic performance for each grade tested—four, eight, and twelve. It will reflect a consensus that students reaching this level have demonstrated competency over challenging subject matter.”

Thus, just months after the summit, a standard-setting and performance-monitoring process was in the works. I accept responsibility for nudging my NAGB colleagues to take an early lead on this, but they needed minimal encouragement.

Early attempts and controversies

In practice, however, this proved to be a heavy lift for a new board and staff, as well as a source of great contention. Staff testing specialist Mary Lyn Bourque later wrote that “developing student performance standards” was “undoubtedly the board’s most controversial responsibility.”

The first challenge was determining how to set these levels, and who would do it. As Bourque recounted, we opted to use “a modified Angoff method” with “a panel of judges who would develop descriptions of the levels and the cut scores on the NAEP score scale.” The term “modified Angoff method” has reverberated for three decades now in connection with those achievement levels. Named for ETS psychologist William Angoff, this procedure is widely used to set standards on various tests. At its heart is a panel of subject-matter experts who examine every question and estimate how many test takers might answer it correctly. The Angoff score is commonly defined as the lowest cutoff score that a “minimally qualified candidate” is likely to achieve on a test. The modified Angoff method uses the actual test performance of a valid student sample to adjust those predicted cutoffs in case reality doesn’t accord with expert judgments.

As the NAEP level-setting process got underway, there were stumbles, missteps, and miscalculations. Bourque politely wrote that the first round of standard-setting was a “learning experience for both the board and the consultants it engaged.” It consumed just three days, which proved insufficient, leading to follow-up meetings and a dry run in four states. It was still shaky, however, leading the board to dub the 1990 cycle a trial and to start afresh for 1992. The board also engaged an outside team to evaluate its handiwork.

Those reviewers didn’t think much of it, reaching some conclusions that in hindsight had merit but also many that did not. But the consultants destroyed their relationship with NAGB by distributing their draft critique without the board’s assent to almost 40 others, “many of whom,” wrote Bourque, “were well connected with congressional leaders, their staffs, and other influential policy leaders in Washington, D.C.” This episode led board members to conclude that their consultants were keener to kill off the infant level-setting effort than to perfect its methodology. That contract was soon canceled, but this episode qualified as the first big public dust-up over the creation and application of achievement levels.

NCLB raises the stakes

Working out how best to do those things took time, because the methods NAGB used, though widespread today, were all but unprecedented at the time. In Bourque’s words, looking back from 2007, using achievement-level descriptions “in standard setting has become de rigueur for most agencies today; it was almost unheard of before the National Assessment.”

Meanwhile, criticism of the achievement-level venture poured in from many directions, including such eminent bodies as the National Academy of Education, National Academy of Sciences, and General Accounting Office. Phrases like “fundamentally flawed” were hurled at NAGB’s handiwork.

The achievement levels’ visibility and combustibility soared in the aftermath of No Child Left Behind, enacted in early 2002, for that law’s central compromise left states in charge of setting their own standards while turning NAEP into auditor and watchdog over those standards and the veracity of state reports on pupil achievement. Each state would report how many of its students were “proficient” in reading and math according to its own norms as measured on its own tests. Then, every two years, NAEP would report how many of the same states’ students at the same grade levels were proficient in reading and math according to NAGB’s achievement levels. When, as often happened, there was a wide gap—nearly always in the direction of states presenting a far rosier picture of pupil attainment than did NAEP—it called into question the rigor of a state’s standards and exam scoring. On occasion, it was even said that such-and-such a state was lying to its citizens about its pupils’ reading and math prowess.

In response, of course, it was alleged that NAEP’s levels were set too high, to which the board’s response was that its “proficient” level was intentionally aspirational, much like the lofty goals framed back in Charlottesville. It wasn’t meant to shed a favorable light on the status quo; it was all about what kids ought to be learning, coupled with a comparison of present performance to that aspiration.

Some criticism was constructive, however, and the board and its staff and contractors—principally the American College Testing organization—took it seriously and adjusted the process, including a significant overhaul in 2005.

Tensions with the National Center for Education Statistics

Statisticians and social scientists want to work with data, not hopes or assertions, with what is, not what should be. They want their analyses and comparisons to be driven by scientific norms such as validity, reliability, and statistical significance, not by judgments and aspirations. Hence the National Center for Education Statistics’ own statisticians resisted the board’s standard-setting initiative for years. At times, it felt like guerrilla warfare as each side enlisted external experts and allies to support its position and find fault with the other.

As longtime NCES commissioner Emerson Elliott reminisces on those tussles, he explains that his colleagues’ focus was “reporting what students know and can do.” Sober-sided statisticians don’t get involved with “defining what students should do,” as that “requires setting values that are not within their purview. NCES folks were not just uncomfortable with the idea of setting achievement levels, they believed them totally inappropriate for a statistical agency.” He recalled that one of his senior colleagues at NCES was “appalled” when he learned what NAGB had in mind. At the same time, with the benefit of hindsight, Elliott acknowledges that he and his colleagues knew that something more than plain data was needed.

By 2009, after NAEP’s achievement levels had come into widespread use and a version of them had been incorporated into Congress’s own accountability requirements for states receiving Title I funding, the methodological furor was largely over. A congressionally mandated evaluation of NAEP that year by the Universities of Nebraska and Massachusetts finally recognized the “inherently judgmental” nature of such standards, noting the “residual tension between NAGB and NCES concerning their establishment,” then went on to acknowledge that “many of the procedures for setting achievement levels for NAEP are consistent with professional testing standards.”

That positive review’s one big caveat faulted NAGB’s process for not using enough “external evidence” to calibrate the validity of its standards. Prodded by such concerns, as well as complaints that “proficient” was set at too high a level, the board commissioned additional research that eventually bore fruit. The achievement levels turn out to be more solidly anchored to reality, at least for college-bound students, than most of their critics have supposed. “NAEP-proficient” at the twelfth-grade level turns out to mean “college ready” in reading. College readiness in math is a little below the board’s proficient level.

As the years passed, NAGB and NCES also reached a modus vivendi for presenting NAEP results. Simply stated, NCES “owns” the vertical scales and is responsible for ensuring that the data are accurate, while NAGB “owns” the achievement levels and the interpretation of results in relation to those levels. The former may be said to depict “what is,” while the latter is based on judgments as to how students are faring in relation to the question “how good is good enough?” Today’s NAEP report cards incorporate both components, and the reader sees them as a seamless sequence.

Yet the tension has not entirely vanished. The sections of those reports that are based on achievement levels continue to carry this note: “NAEP achievement levels are to be used on a trial basis and should be interpreted and used with caution.” The statute still says, as it has for years, that the NCES commissioner gets to determine when “the achievement levels are reasonable, valid, and informative to the public,” based on a formal evaluation of them. To date, despite the widespread acceptance and use of those levels, that has not happened. In my view, it’s long overdue.

Looking ahead

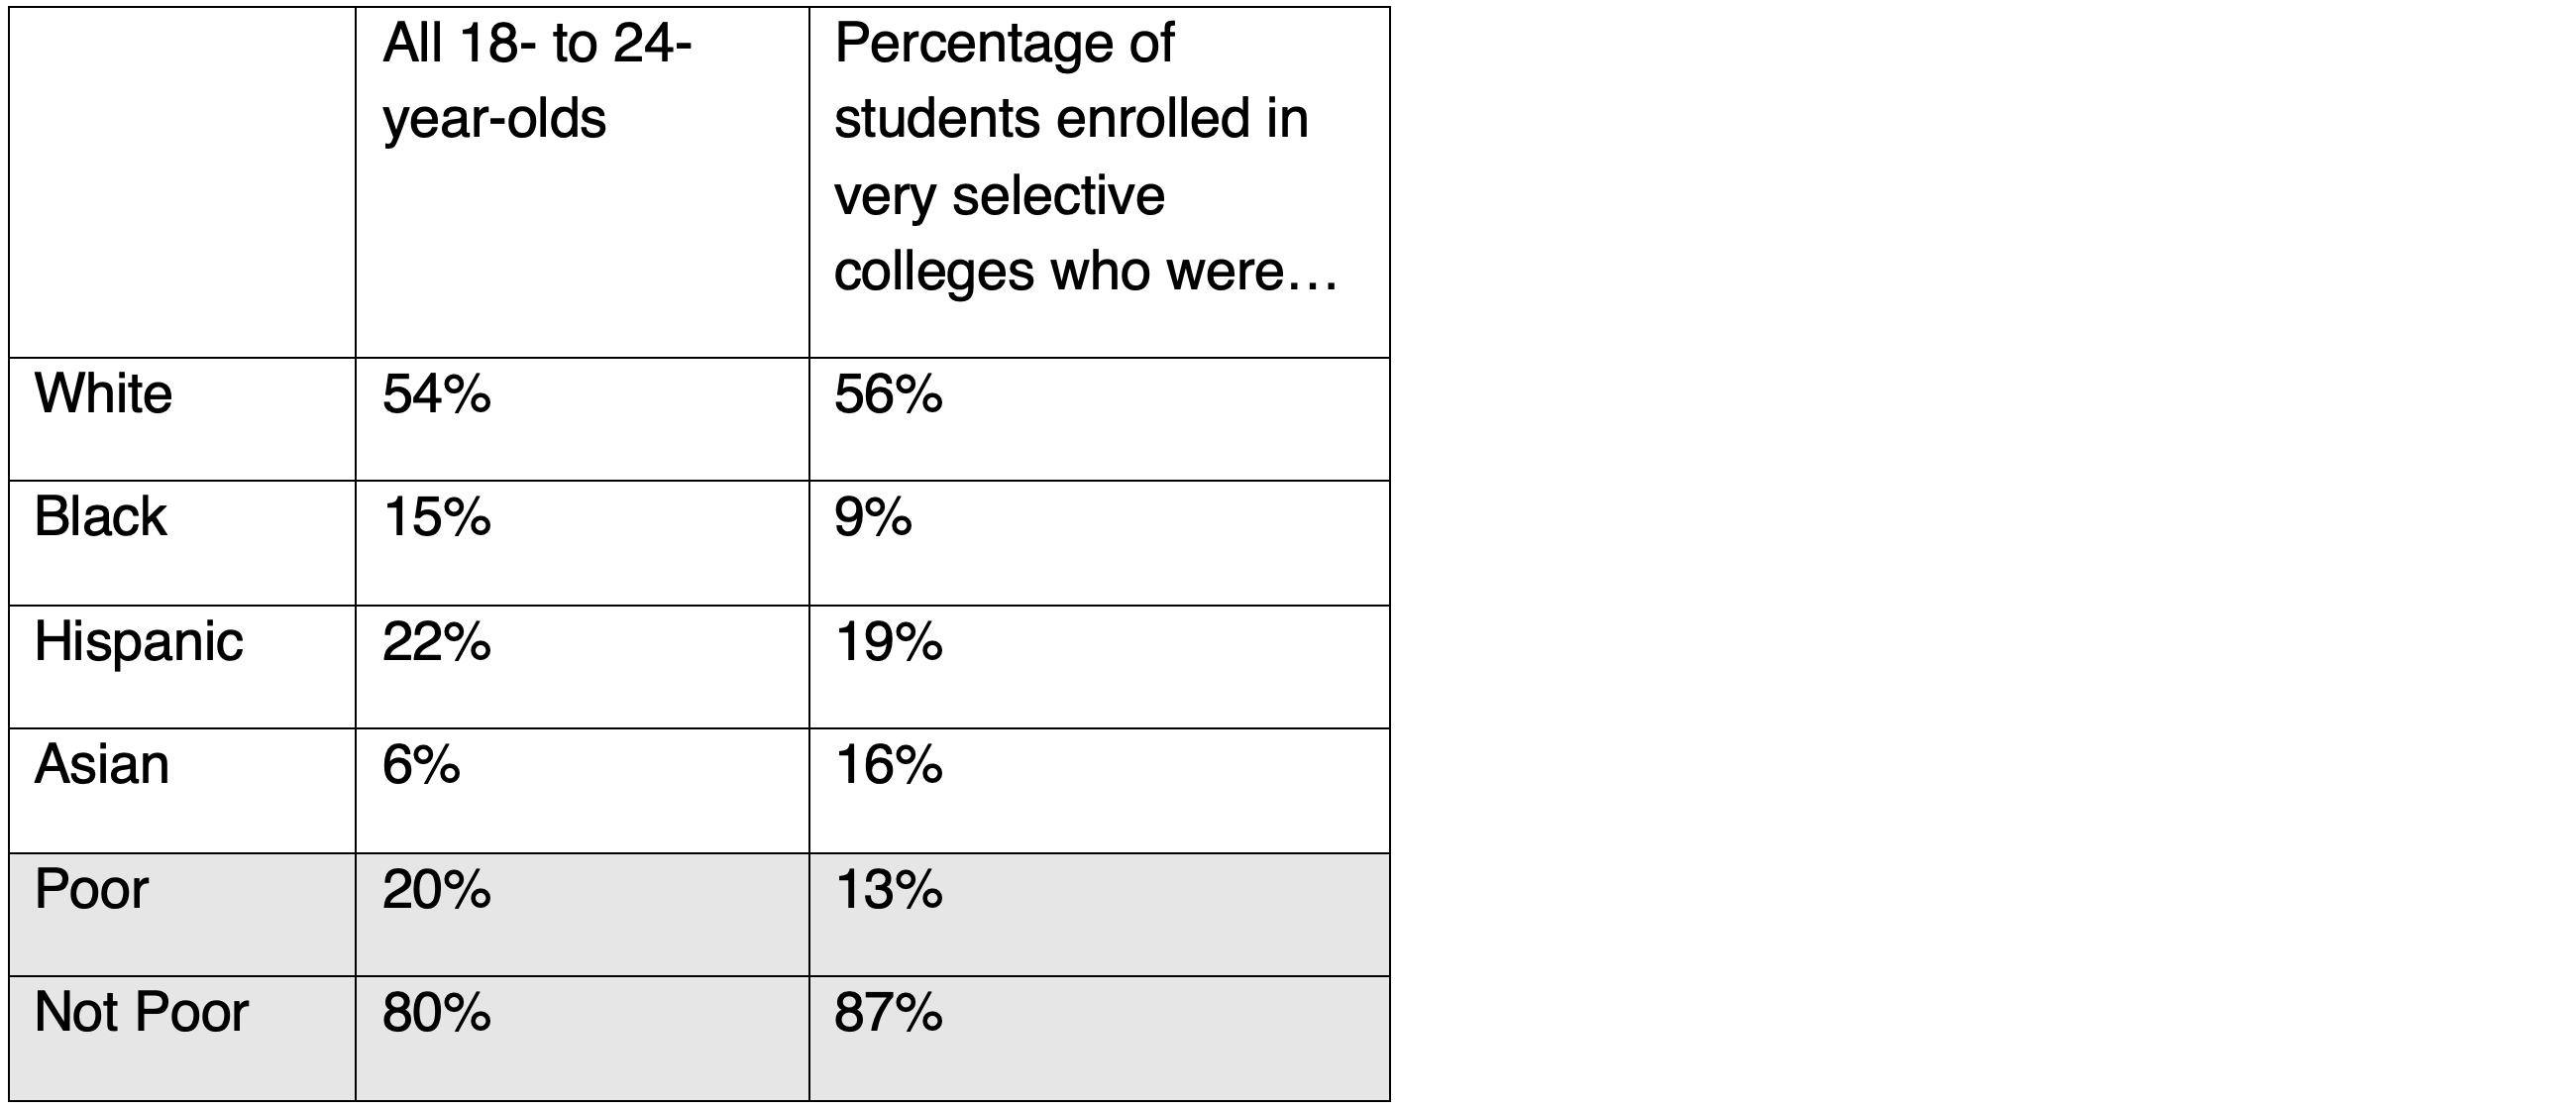
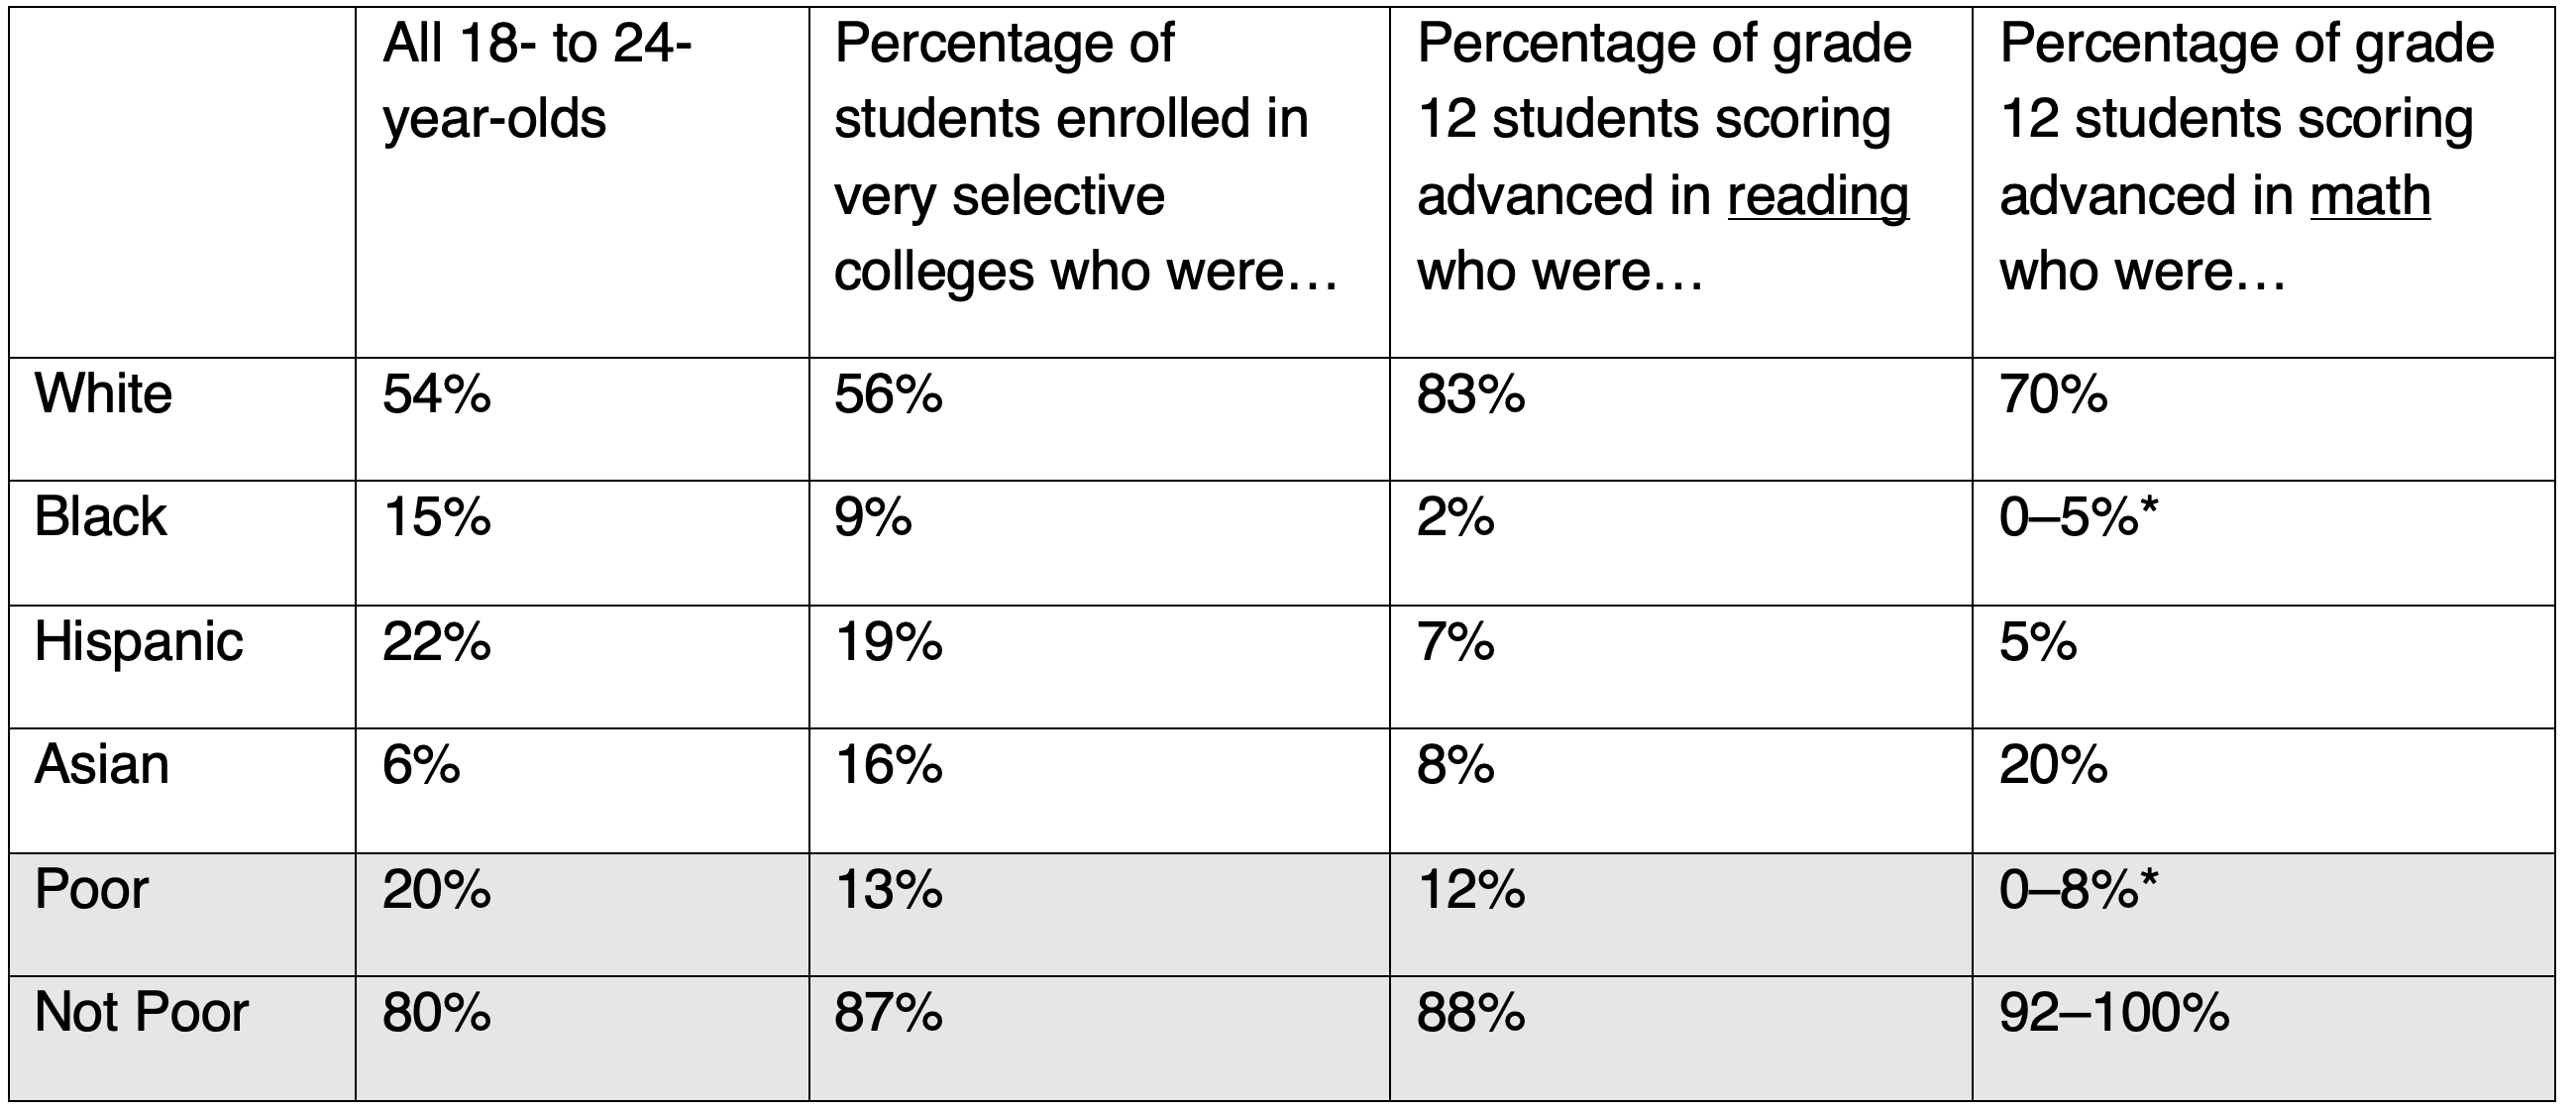
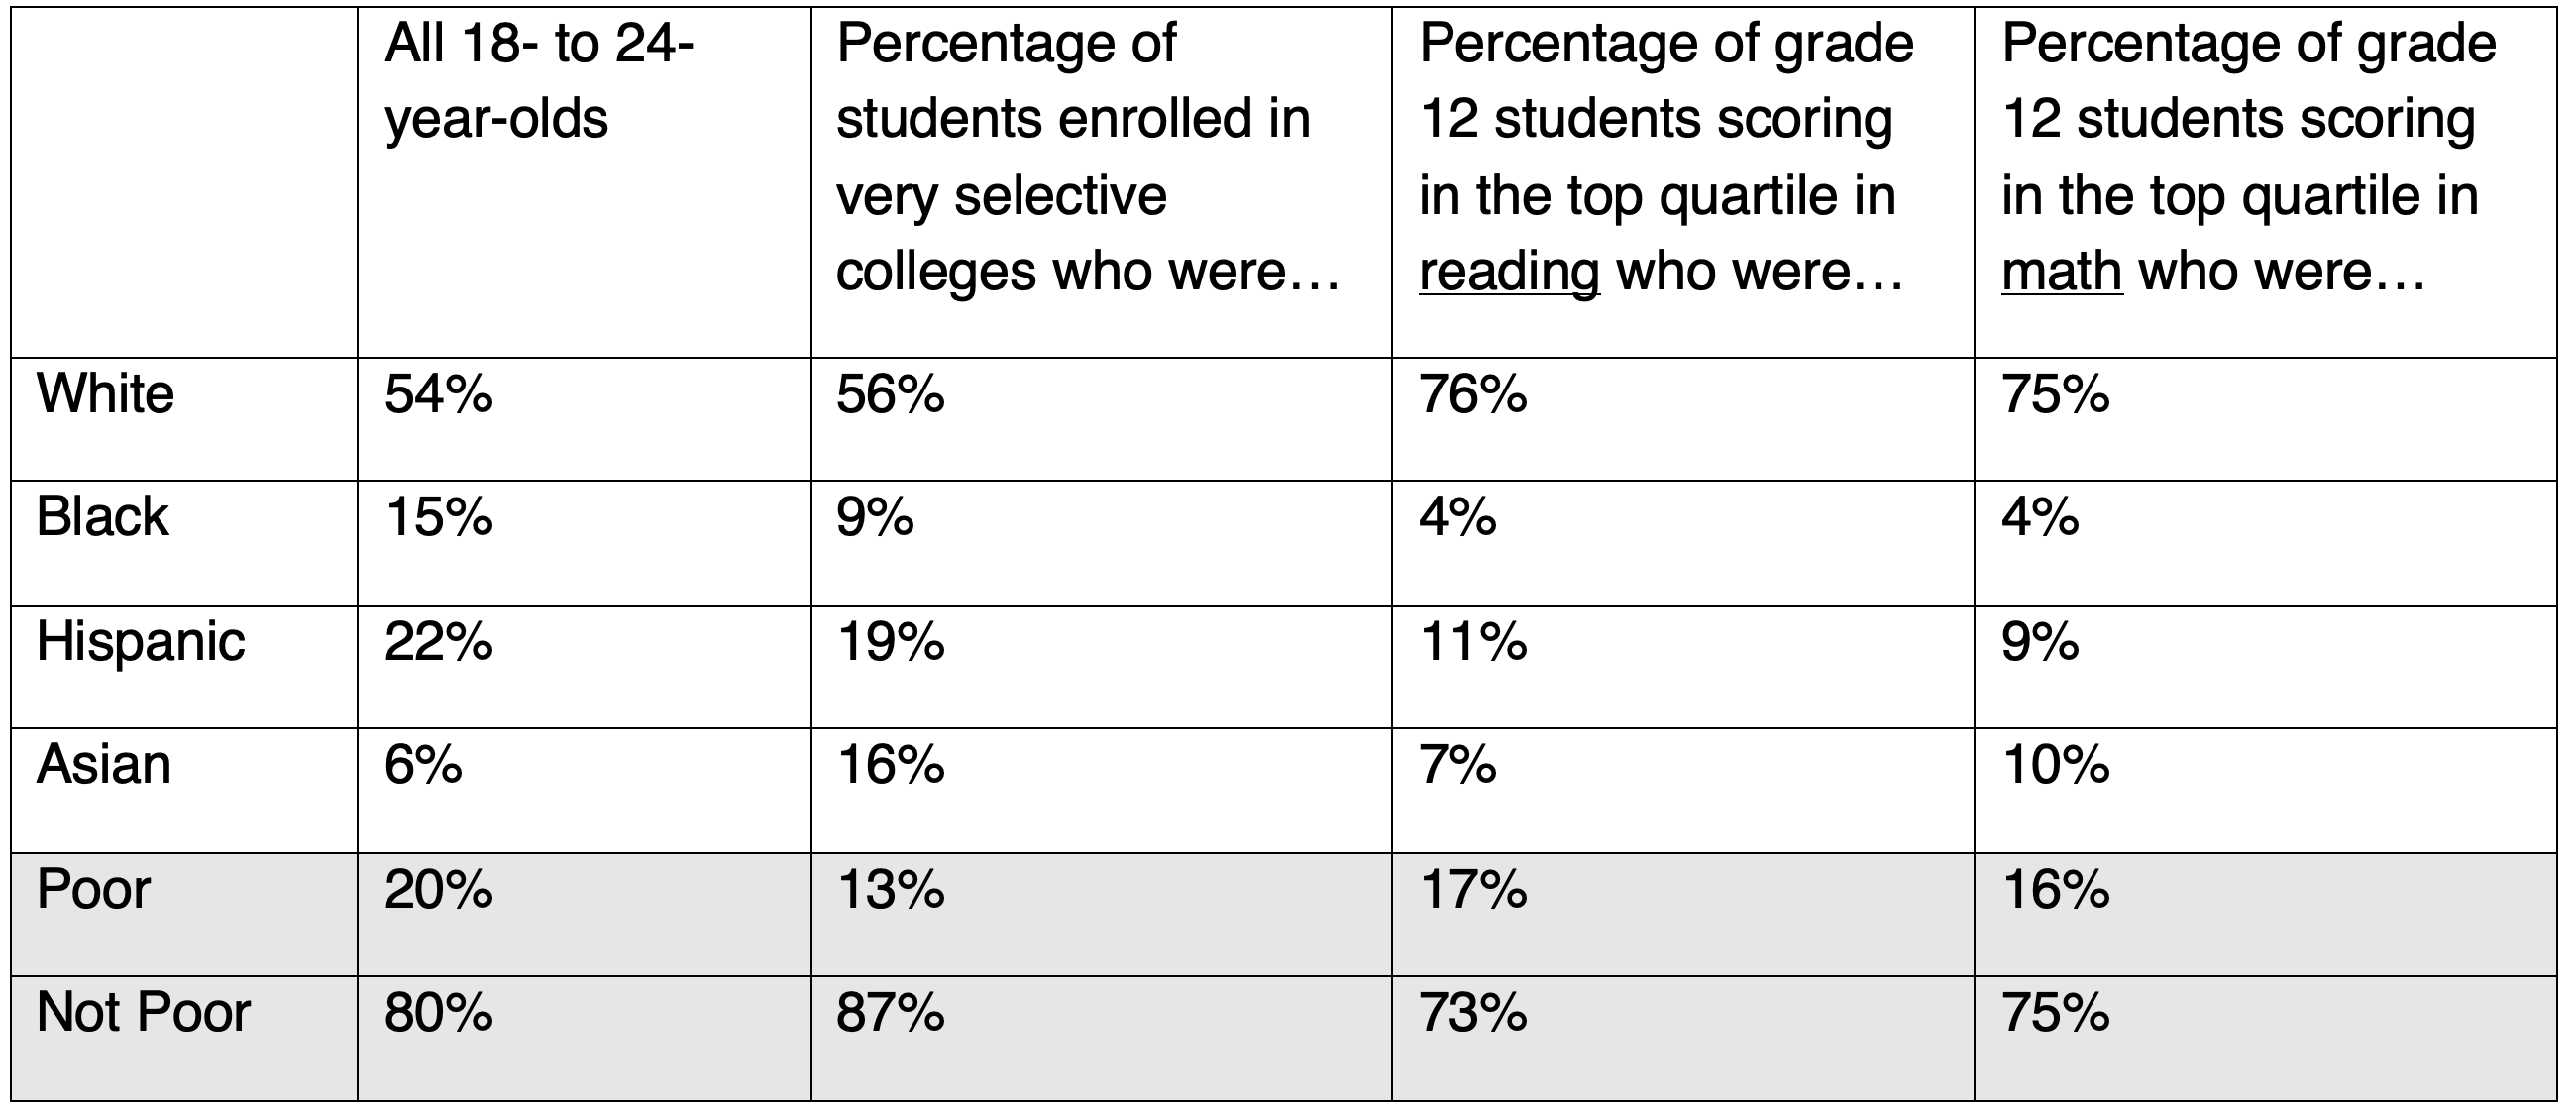
Accusations continue to be hurled that the achievement levels are set far too high. Why isn’t “basic” good enough? And—a concern to be taken seriously—what about all those kids, especially the very large numbers of poor and minority pupils, whose scores fall “below basic?” Shouldn’t NAEP provide much more information about what they can and cannot do? After all, the “below basic” category ranges from completely illiterate to the cusp of essential reading skills.

The achievement-level refresh that’s now underway is partly a response to a 2017 recommendation from the National Academies of Sciences, Engineering, and Medicine that urged an evaluation of the “alignment among the frameworks, the item pools, the achievement-level descriptors, and the cut scores,” declaring such alignment “fundamental to the validity of inferences about student achievement.” The board engaged the Pearson testing firm to conduct a sizable project of this sort. It’s worth underscoring, however, that this is meant to update and improve the achievement levels, their descriptors, and how the actual assessments align with them, not to replace them with something different.

I confess to believing that NAEP’s now-familiar trinity of achievement levels has added considerable value to American education and its reform over the past several decades. Despite all the contention that they’ve prompted over the years, I wouldn’t want to see them replaced. But to continue measuring and reporting student performance with integrity, they do require regular maintenance.

Editor’s Note: This article was first published by Education Next.

view

Evidence, struggling math students, and California’s 2022 math framework

Tom Loveless
5.19.2022
Flypaper

The proposed California Mathematics Framework generated a storm of controversy when the first draft was released in early 2021. Critics objected to the document’s condemnation of tracking and negative portrayal of acceleration for high-achieving students. Indignation focused on the recommendation that schools stop offering Algebra I to mathematically precocious eighth graders. A revised draft was released in 2022, softening the harsh language of the original text while leaving intact the framework’s dim view of course acceleration or other forms of tracking.

Those are important issues; however, this post is concerned with students on the opposite end of the distribution of achievement: students who struggle with math. Over the past decade, math scores on the National Assessment of Educational Progress (NAEP) have been declining at the 25th percentile, indicating that struggling students are falling even further behind their peers. Moreover, as schools recover from the pandemic, the percentage of students with disappointing math achievement is sure to go up. What does the framework portend for them? What evidence does the framework rely upon to build its recommendations for these vulnerable youngsters?

The IES practice guide on struggling students

About the same time that the first draft of the framework came out, the What Works Clearinghouse of the Institute of Education Sciences (IES) published “Assisting Students Struggling with Mathematics: Intervention in the Elementary Grades” (hereafter referred to as “Struggling Math Students”) as part of its ongoing series of practice guides for educators. The practice guides distill the latest high-quality research on a specific, practical topic into a few clear recommendations that are useful to practitioners—in particular, classroom teachers.[1]

The practice guides are developed following set protocols. First, a literature search is conducted of terms related to the guides. In the case of “Struggling Math Students,” 2,653 records were identified. Then the studies are screened for topic relevance and eligibility, the latter including criteria for sample size, clear learning outcomes, and research design. These criteria are meant to single out research producing findings with a strong causal warrant. The design criteria are especially important because they include longstanding hallmarks of good policy evaluations, including either randomized assignment of subjects to treatment and control groups or an acceptable quasi-experimental approach, standardized measures of outcomes, verification of group equivalence at baseline, and low sample attrition. Fifty-six studies survived these requirements.

After a final screen that focused on quality and relevance to the topic at hand, forty-three studies met criteria, encompassing 6,990 students and 490 schools. The studies are described in Appendix C of the practice guide, including explanations for how they support six recommendations:

1. Provide systematic instruction.

2. Teach clear and concise mathematical language.

3. Use well-chosen representations.

4. Use number lines.

5. Provide deliberate instruction on word problems.

6. Regularly include timed activities to build fluency.

The guide offers examples of how teachers can implement recommendations in classrooms, along with suggestions for addressing obstacles that may arise. By focusing on students who struggle with mathematics, the studies are limited in what they can say about whole-class instruction (Tier 1), the exception being middle schools, in which struggling students may be grouped together in the same class. The findings mostly pertain to instruction of students in small groups, often referred to as Tier 2 interventions, or one-on-one instruction (Tier 3). The latter two forms of intervention could involve working with a math specialist, special education teacher as part of an individualized education plan (IEP), or a tutor.

The practice guides are not infallible. Their value is in following a transparent, replicable process to summarize the best scholarship on practical problems facing educational practitioners. The practice guide on students who struggle to learn mathematics represents what we currently know about addressing those students’ needs.

Are the studies cited in the practice guide cited in the 2022 California Math Framework?

I searched to see how many of the practice guide’s forty-three studies are cited in the California Math Framework. None. Zero. When I couldn’t find a single citation in the list of references, I searched the framework text to make sure a cited study hadn’t been inadvertently omitted. Nope. None are mentioned in the document’s 1,100+ pages.

California publishes frameworks to provide guidance to local educators in implementing standards—in the case of mathematics, the Common Core Math Standards. Some students have struggled with that learning. The 2022 California Math Framework overlooks the body of scientific evidence addressing how educators can best serve the needs of students for whom math is difficult.

How could that possibly happen?

How the framework addresses struggling students

The framework’s treatment of how struggling students’ needs should be met seems to be a mixture of wishful thinking—every student will succeed if teachers simply follow the framework’s commands—and the attitude that the topic is outside the framework’s mandate:

Students develop at different times and at different rates; what educators perceive as an apparent lack of understanding may not indicate a real lack of understanding. The implementation of mathematics routines that encourage students to use language and discuss their mathematics work are of benefit to all students, particularly those who are learning English or who are challenged by the demands of academic language for mathematics. Such supports allow educators to help students strengthen understandings that may have been weak or incomplete in their previous learning without formal intervention program. When more support is warranted, teachers can access California’s Multi-Tiered System of Support (MTSS) (California Department of Education, n.d.), which is designed to provide the means to quickly identify and meet the needs of all students (Chapter 6).

This is a strange passage. The first sentence almost denies that many students struggle with math. It then asserts that adopting classroom “routines” involving mathematical discussions, as urged by the framework, can be counted on to take care of misunderstandings by English learners or those “challenged by the demands of academic language for mathematics.” No evidence for either claim is provided. Multi-tiered support is not mentioned until the end of the passage—and only then by pointing to another state document.

The role of ideology

It appears that the framework’s ideological commitment to the principle that all students should be treated the same—same curriculum, same instruction—is the primary reason why the extensive literature on struggling students is ignored. Effective interventions require identifying students who are falling behind and creating supplemental instructional settings for them, either in small groups or individually. In contrast, the framework places all its bets on instruction that attends to mindset theory, lessons using math to explore social justice topics, and Universal Design for Learning (UDL) to reduce the number of students who need extra help. The framework doesn’t say it out loud, but the idea that students could fall behind once this instructional regime is established is treated as unlikely.

The framework’s second ideological commitment is to inquiry. Topics are organized around “big ideas” and “drivers of investigation.” Inquiry methods have a century-long checkered history, particularly for struggling students in the primary grades. As a long time reader of California’s frameworks, I can say that the 2022 Math Framework is the most inquiry-oriented that I’ve seen since the 1992 California Math Framework. This statement from the 1992 framework could have easily come from the 2022 version: “Children often misinterpret and misapply arithmetic and algebraic procedures taught the traditional way. This program, in contrast, values developing number and symbol sense over mastering specific computational procedures and manipulations.” The 1992 framework flew under the radar until a coalition of concerned parents and mathematicians, in what became known as “The Math Wars,” rallied against the textbooks and instructional methods that the framework spawned and drove them all out of state policy.

The “traditional way” that inquiry advocates would like to upend goes by several terms, the most common being “direct” or “explicit” instruction. Take another look at the six recommendations supported by evidence. Three of them—provide systematic instruction, teach clear and concise mathematical language, and provide deliberate instruction on word problems—are predicated on explicit instruction. Teachers intentionally explain the how and why of mathematics, ask students to practice new knowledge, and check to see if students have learned the material. Exploration or discovery is not the governing activity.

The recommendation to use timed activities to build fluency is opposed by the 2022 framework. The Common Core math standards define fluency as “speed and accuracy,” identifying two components also common to instruction in reading and foreign languages. The framework believes that speed should be dropped in favor of flexibility, arguing that an emphasis on speed creates math anxiety.[2]

This is a mistake. Students who struggle with math often have not mastered basic facts of whole number addition, subtraction, multiplication, or division (e.g., 4 + 7 = 11, 16 – 8 = 8, 4 x 9 = 36, 72 / 8 = 9). Asked to apply these facts quickly in multidigit calculations, the students flounder. So much working memory is devoted to simple calculations, the new procedures students encounter with multidigit arithmetic and fractions—and later algebra—cannot command sufficient cognitive resources. Fluency with basic facts often goes by the term “automaticity,” the ability to retrieve math facts effortlessly from long-term memory. The word does not appear in the California Math Framework. Nor do the terms “retrieval practice” or “interleaved practice” appear, instructional strategies for enhancing students’ automaticity and long-term memory.

Conclusion

The 2022 California Math Framework does not reflect current scholarship on how to serve students who struggle when learning mathematics. A search of studies cited in a recent What Works Clearinghouse publication, “Assisting Students Struggling with Mathematics: Intervention in the Elementary Grades,” reveals absolutely no overlap. None of the studies cited in “Struggling Math Students” are cited in the framework. This is particularly troubling because of the transparent, rigorous process followed in producing the practice guide, ensuring that recommendations are based on scientifically sound research. In sharp contrast, the process employed to search literature and select evidence for the framework’s recommendations is unknown. It is not described in the document or on the framework’s website.

The California State School Board will consider the framework for adoption in July, 2022. All students will be poorly served if the state endorses inquiry over explicit instruction. Students who dream of pursuing a STEM major will arrive at college unprepared. Students who have difficulty learning math will see their frustrations increase and challenges multiply as they fall further behind their peers.

The Board should reject this framework.

Editor's note: This article was first published by the author on his blog, TomLoveless.com.


[1] Full disclosure. I served as a elementary math content expert for the What Works Clearinghouse from 2013–18. I did not work on any of the practice guides.

[2] From the framework’s glossary: “Fluency. The ability to select and flexibly use appropriate strategies to explore and solve problems in mathematics.”

view

What does teacher certification contribute to outcomes for students with disabilities?

Jeff Murray
5.19.2022
Flypaper

Reams of research have reported contradictory outcomes for students with disabilities (SWDs) who are taught in general education classrooms alongside their non-disabled peers versus learning in settings with only SWDs. A new report focuses on teacher certification as a possible mechanism to explain the variations in outcomes.

J. Jacob Kirksey from Texas Tech University and Michael Lloydhauser from the University of California, Santa Barbara use data from the Early Childhood Longitudinal Study—Kindergarten Class of 2010–2011 (ECLS-K) to identify 2,370 unique SWDs and observe them over three school years. Students were included if they had an Individualized Education Plan (IEP) on file with their school in kindergarten, first, or second grade and if data indicated that they were primarily educated in general education classrooms instead of specific classrooms for SWDs. While the original ECLS-K sample was nationally representative, the researchers do not provide a breakdown of their final sample on any demographic criteria.

Students’ academic achievement was assessed in math and reading in both the fall and spring of kindergarten as well as the spring of the next two years. The mathematics assessment included questions on number sense, properties, and operations; measurement; geometry and spatial sense; data analysis; and patterns and functions. The reading assessment had questions on print familiarity, letter recognition, and recognition of common words. Analysts used the scores to construct value-added estimates of student achievement over time. Teachers reported their certification in elementary education, early childhood education, some version of English as a second language/bilingual education, or special education. Single-credential teachers abounded in the sample, but a small minority had dual credentials in special education and one of the other areas. Kirksey and Lloydhauser compared academic outcomes for SWDs whose teachers only had special education certification, SWDs whose teachers only had a single general education certification, and SWDs whose teachers had dual certification in special and general education.

They find that SWDs with teachers holding only a special education credential fared worse in math (0.14 standard deviations) compared to their SWD peers whose teachers had a single elementary education certification. There was no difference observed in reading achievement. Dual-certification teachers, likewise, seemed to have no observable impact on SWD student achievement in this initial analysis.

A second model looked at school-level fixed effects and found no difference in achievement for SWDs based on teacher certifications. The authors’ third and preferred model combined school and child fixed effects (largely eliminating “school and child-level confounding bias”) and found positive, statistically-significant results (0.09 standard deviations) linking dual certification to higher math outcomes for SWDs.

As long as parents continue to want their children with IEPs to learn in general education classrooms, the question of how best to serve those students will loom large. This research offers few answers. Variations in disability type, size and composition of different classrooms, and out-of-classroom supports are all unmeasured factors which could have influenced the observed outcomes, and thus are worthy of deeper investigation.

SOURCE: J. Jacob Kirksey and Michael Lloydhauser, “Dual Certification in Special and Elementary Education and Associated Benefits for Students With Disabilities and Their Teachers,” AERA Open (April 2022).

view

More data on the impact of remote and hybrid learning during the pandemic

Julia Wolf
5.19.2022
Flypaper

Throughout the pandemic, we encountered much speculation about the impact that remote learning would have on student performance. The expected learning loss was a concern not just of American parents and educators, but of citizens all around the world. Research is now being conducted in other countries and some states, but to date we have no comprehensive evaluation of how virtual learning impacted students across America.

To fill this gap, Rebecca Jack, Clare Halloran, James Okun, and Emily Oster investigated how children’s schooling modes during the pandemic affected their test scores. The research team used state assessment data in math and English language arts for grades three through eight across eleven states to compare pass rates prior to and during the pandemic. They started by comparing these pass rates, and they then looked deeper into how the effects of the pandemic on pass rates vary by state, school mode, and demographics to get a better understanding of the various ways students were impacted by virtual learning.

The researchers used data from the COVID-19 School Data Hub (which was created by their team using state level data) to identify district-level schooling mode data from 2020–21. Schooling modes were sorted into three categories: in-person, virtual, and hybrid. Schools were grouped as in-person if most or all students had access to in-person instruction, and schools were grouped as virtual if most or all students received instruction virtually. Any combination of instruction modes qualified as hybrid instruction.

The researchers used district level state standardized test scores from spring 2016–19 and 2021, and first used these data to identify states that could be included in their analysis. States were selected that had at least two years of pre-pandemic test scores available, as well as scores from spring 2021. The researchers included states only if no significant changes were made to the state’s standardized test content. This process resulted in a sample of eleven states.

The research team also used district demographic data from NCES and county data for controls. This told them the share of enrolled students by race and ethnicity, English-learner status, and information on the share of students enrolled in subsidized lunches.

With this data, the researchers used a regression analysis to compare district schooling mode and the district’s average pass rate for third through eighth graders on state standardized ELA and math exams, controlling for regional differences, changes in school enrollment, and test participation. By doing so, the team did their best to account for any changes that would be due to changes outside of schooling mode that occurred in schools during the pandemic.

Not surprisingly, the study found declines in the pass rates in spring 2021 across all districts and groups of students. The average pass rate, between the years 2019 and 2021, declined by 12.8 percentage points in math and by 6.8 points in ELA. Yet virtual learning seems to have impacted math scores more than ELA; this might be due to the differences in skills that are taught and applied in these different subjects, and how teaching hard skills in subjects like math might have been more difficult to translate into virtual instruction.

The researchers also found greater pass rate declines in districts that offered less in-person schooling. And in schools with higher populations of historically underserved students, there was a smaller chance the schools would offer access to in-person learning. Larger declines were also found in districts with a larger proportion of Black students, which may be tied to the finding that underserved communities had less access to in-person learning.

The magnitudes of these effects are significant. Moving from completely virtual to full access to in-person learning would have reduced the declines in pass rates by 13 or 14 percentage points in math and by about 8 percentage points in ELA. This again shows a significant difference in the effects on learning in the two subjects. Additionally, the researchers found that moving from fully virtual to hybrid instruction would have reduced the declines by 7 percentage points in math and 5 or 6 points in ELA.

The study has some caveats. It is limited in its selection of states, for example, especially since the selection was based on the availability of test scores. In states where there were no documented test scores for the 2020–21 school year, there may be different or more severe effects.

But overall, the study provides important, albeit predictable, implications about how there are specific populations that may need more targeted attention during the Covid recovery process. Underserved communities were disproportionately affected by pandemic instruction, and thus have greater ground to makeup. Recovery funds might, then, be focused on areas that struggled the most to get their students back in person.

SOURCE: Rebecca Jack, Clare Halloran, James Okun, and Emily Oster, “Pandemic Schooling Mode and Student Test Scores: Evidence from U.S. School Districts” (April 2022).

view

Education Gadfly Show #820: Social-emotional learning doesn’t have a hidden agenda

5.18.2022
Podcast
 

On this week’s Education Gadfly Show podcast, Robert Pondiscio, senior fellow at the American Enterprise Institute (AEI) and senior visiting fellow here at Fordham, discusses his wariness about social-emotional learning but rebuts the claim that it’s a “Trojan horse” for critical race theory. Then, on the Research Minute, Amber Northern reviews a study on how well teachers understand their pension plans.

Recommended content:

  • Robert’s piece on SEL: “No, social and emotional learning is not a “Trojan horse” for CRT.”
  • Nathanial Grossman’s piece: “Schools have no choice but to teach social and emotional skills.”
  • Fordham’s parent survey: How to Sell SEL: Parents and the Politics of Social-Emotional Learning.
  • The study that Amber reviewed on the Research Minute: Dillon Fuchsman, Josh B. McGee, and Gema Zamarro, Teachers’ Knowledge and Preparedness for Retirement: Results from a Nationally Representative Teacher Survey, Sinquefield Center for Applied Economic Research Working Paper (January 20, 2022).

Feedback welcome!

Have ideas or feedback on our podcast? Send them to our podcast producer Pedro Enamorado at [email protected].

view

Cheers and Jeers: May 19, 2022

The Education Gadfly
5.19.2022
Flypaper

Cheers

  • Fowler High School in rural Colorado has been graduating college-going students at rates above the state average for generations. —Chalkbeat Colorado
  • “Both charter and traditional public school leaders are happy with [the Missouri legislature’s] funding compromise.” —St. Louis Public Radio

Jeers

  • Dubious grading “reforms” are leading to lower standards and less learning. —Jay Mathews
view

What we're reading this week: May 19, 2022

The Education Gadfly
5.19.2022
Flypaper
  • “Many progressives view the [the study of economics] as their adversary. Yet it has often proved to be a singularly powerful ally.” —New Yorker
  • During the pandemic, leniency in college grading and attendance policies made sense. “[B]ut the learning breakdown has convinced me that continuing to relax standards would be a mistake.” —New York Times
  • “School accountability is restarting after a two-year pause. Here’s what that means.” —Education Week
  • Republicans risk squandering the perfect moment for school choice on the culture wars. —Reason

Sign Up to Receive Fordham Updates

We'll send you quality research, commentary, analysis, and news on the education issues you care about.
Thank you for signing up!
Please check your email to confirm the subscription.
Fordham Logo

© 2020 The Thomas B. Fordham Institute
Privacy Policy
Usage Agreement

National

1016 16th St NW, 8th Floor 
Washington, DC 20036

202.223.5452

[email protected]

  • <
Ohio

P.O. Box 82291
Columbus, OH 43202

614.223.1580

[email protected]

Sponsorship

130 West Second Street, Suite 410
Dayton, Ohio 45402

937.227.3368

[email protected]