Last fall, I wrote about the gender gap in America’s universities and argued that its primary cause is what was happening—or not—in our elementary schools. In short, boys fall behind girls in reading in the earliest grades, and they never catch up. And it is this factor more than anything else—more than some calamity impacting teenage boys, more than a tsunami of disaffected young men—that explains why so many more women graduate high school prepared to succeed in college. If we could improve America’s approach to early literacy instruction, particularly for boys, we might nip the gender gap in the bud.
Now I’d like to turn to what Jonathan Plucker and Scott Peters have termed the “excellence gap”—the sharp disparity by race and class in performance at the highest levels of academic achievement. Here I find myself interested in what may happen if the newly assertive Supreme Court conservative majority bans affirmative action on the basis of race in college admissions, as seems likely.
The connection between the excellence gap and affirmative action should be obvious. College administrators would not have to twist themselves into knots to find ways to admit more Black, Hispanic, and low-income students into highly selective institutions were it not for the pervasiveness of the excellence gap.
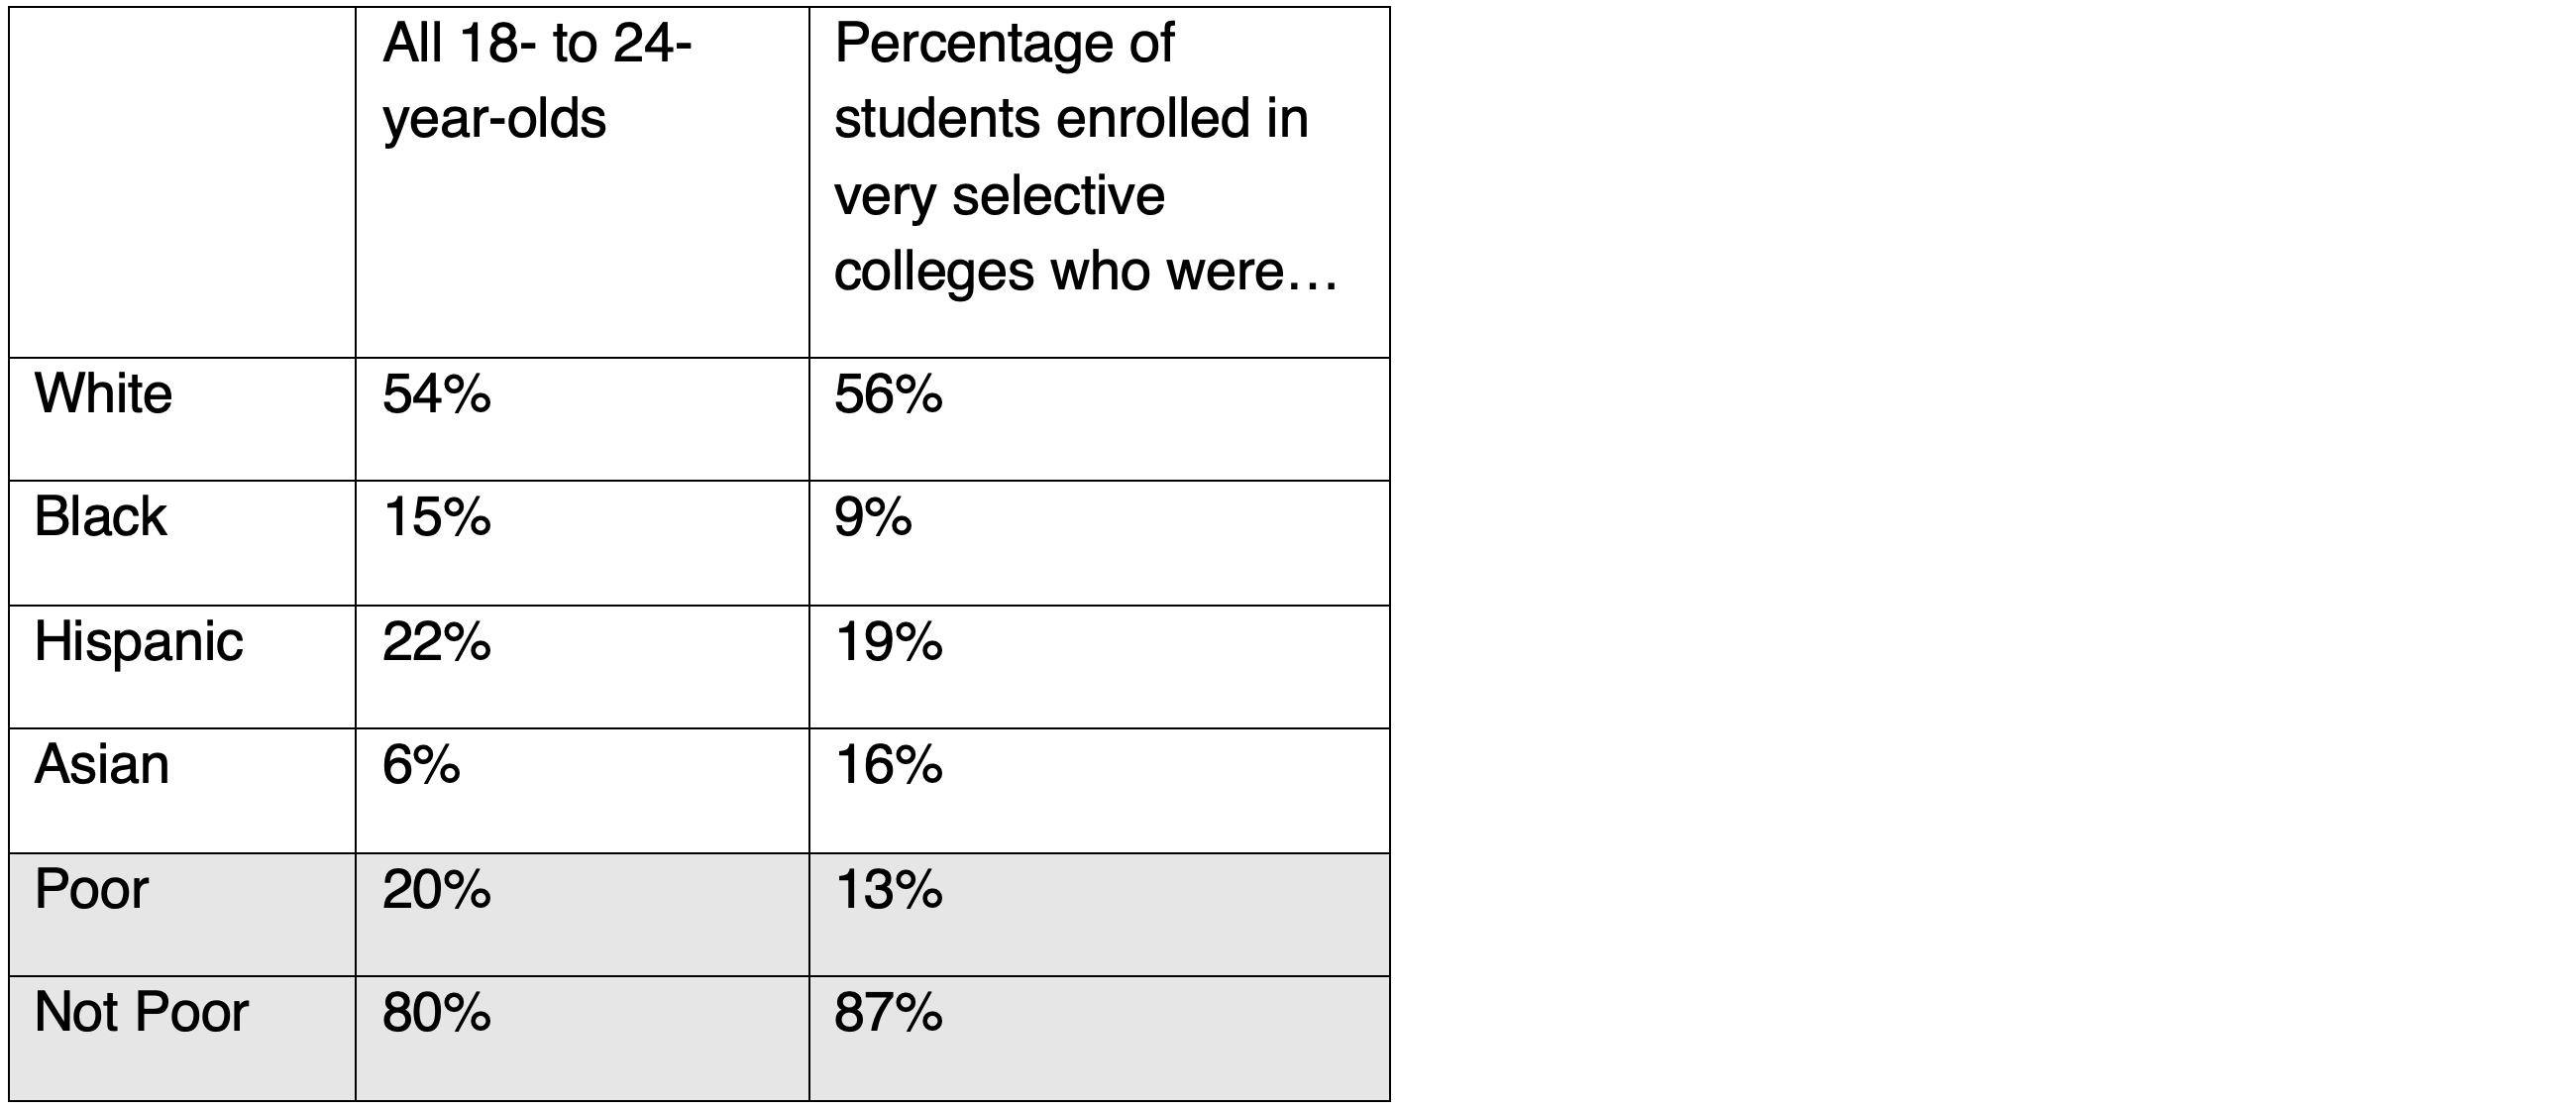
Consider: In 2015–16, the most recent year for which we have national data, Black, Hispanic, and poor students remained underrepresented in America’s “very selective”[1] universities—this despite widespread use of various forms of affirmative action.
Table 1: Student composition of America’s “very selective” colleges, 2015–16

Sources: Digest of Education Statistics 2016, National Center on Education Statistics, Table 101.20., “Estimates of resident population, by race/ethnicity and age group: Selected years, 1980 through 2016,”; Race and Ethnicity in Higher Education (REHE): A Status Report, American Council on Education, by Lorelle L. Espinosa, Jonathan M. Turk, Morgan Taylor, and Hollie M. Chessman; “A Rising Share of Undergraduates Are From Poor Families, Especially at Less Selective Colleges,” Pew Research Center, by Richard Fry and Anthony Cilluffo; and “People in Poverty by Selected Characteristics: 2015 and 2016,” Income and Poverty in the United States: 2016, Census Bureau, by Jessica L. Semega, Kayla R. Fontenot, and Melissa A. Kollar.
Yet if the racial and socioeconomic composition of this cohort of students reflected academic achievement, complete with the excellence gaps we see among groups, the underrepresentation of poor, Black, and Hispanic students would have been much worse.
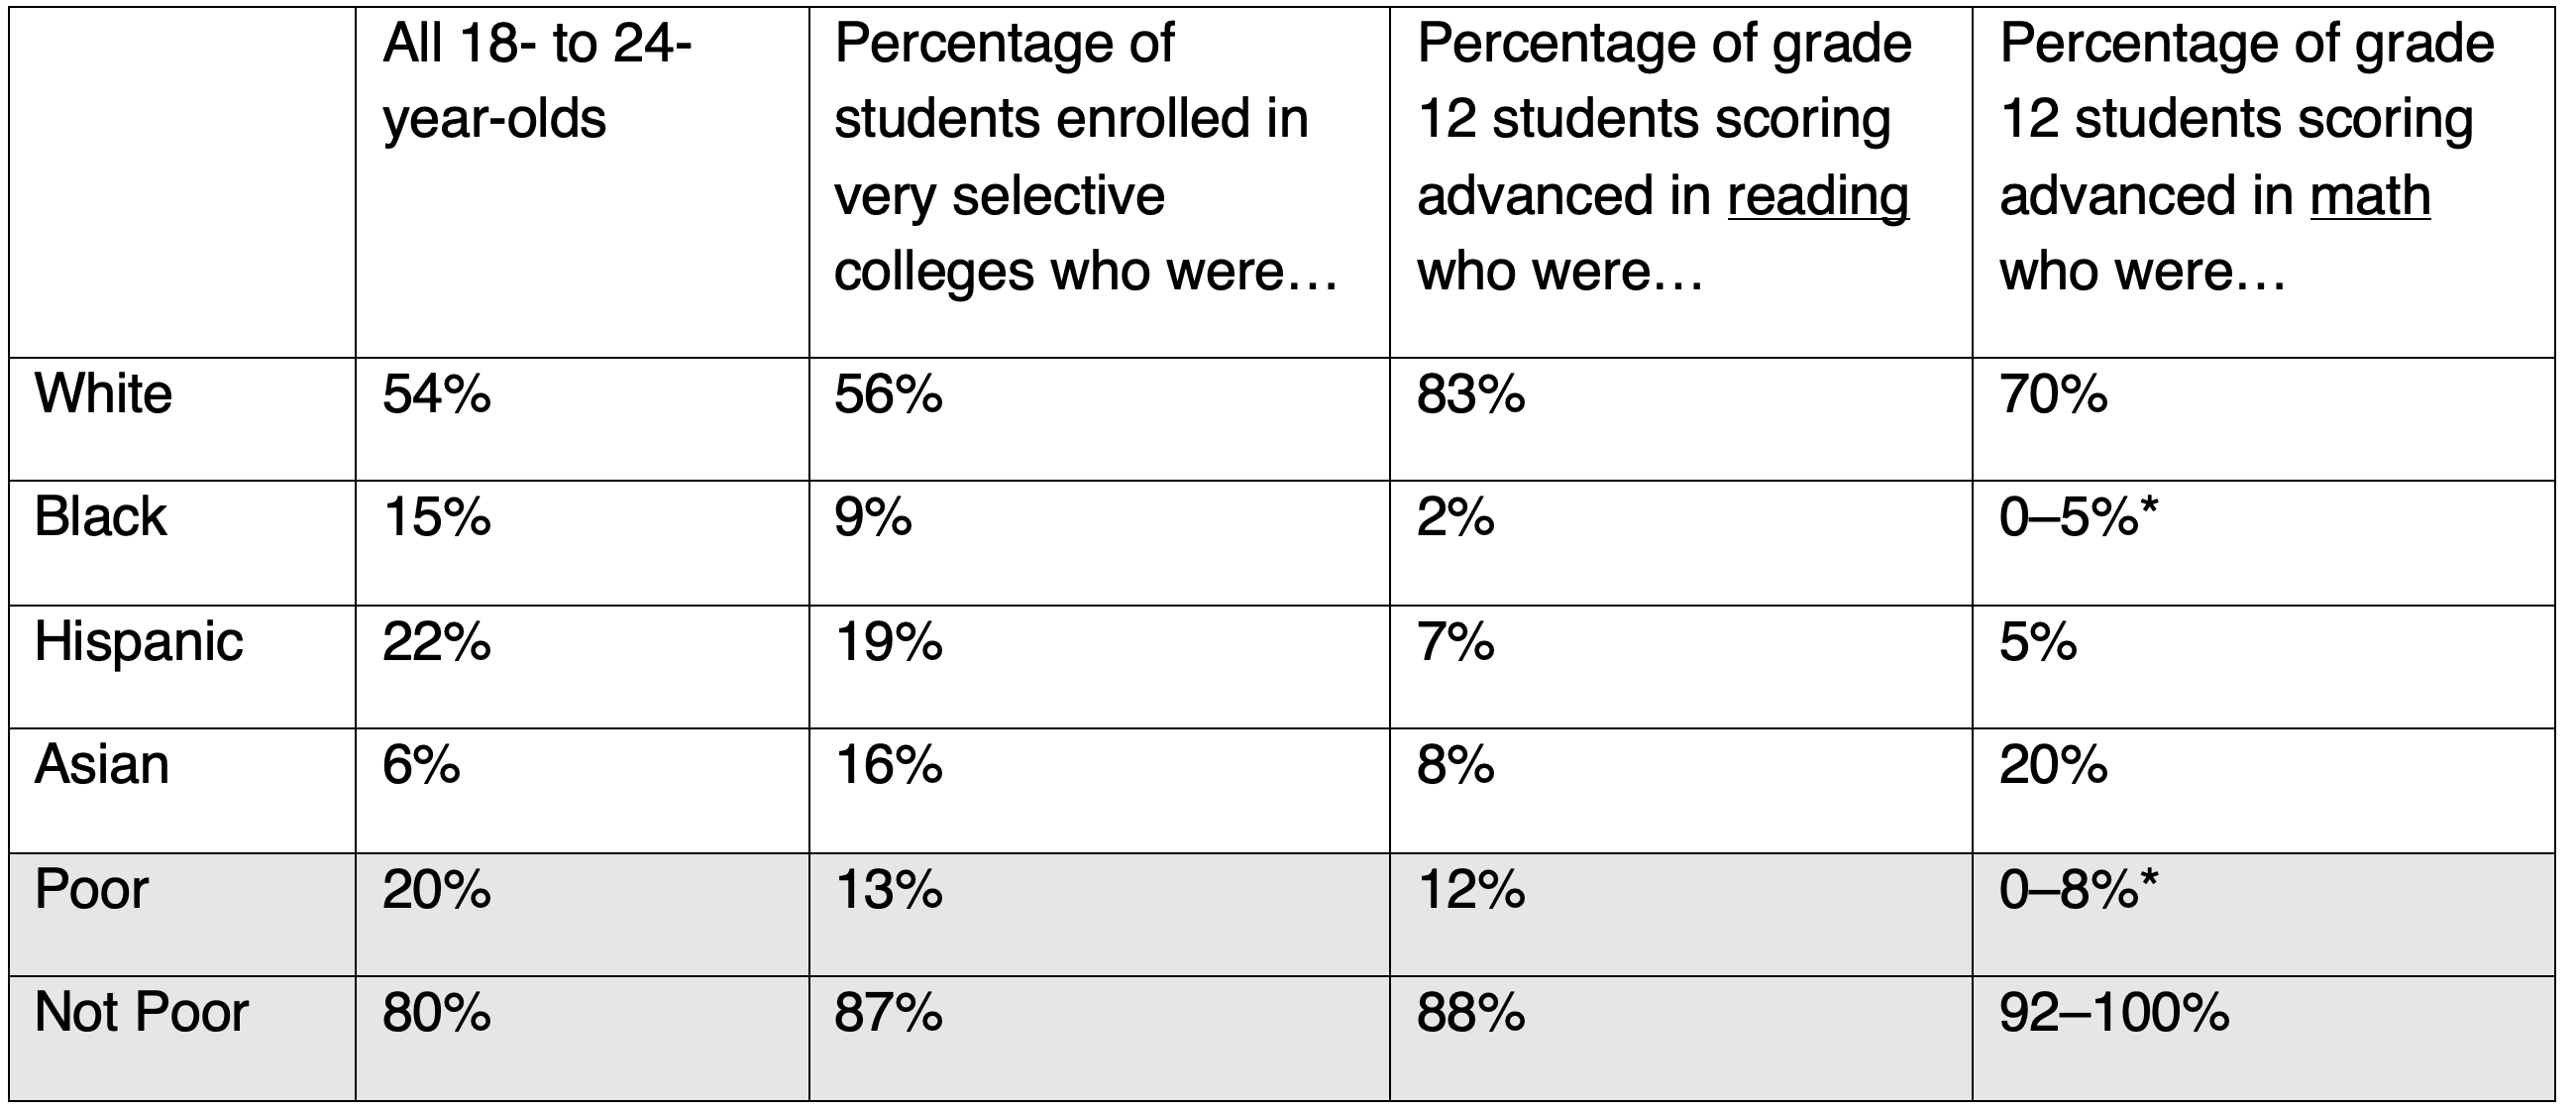
To illustrate this, let’s add to the picture the composition of students scoring at the “advanced” level of the National Assessment of Educational Progress in reading and math when this cohort of students was in the twelfth grade.
Table 2: Student composition of America’s “very selective” colleges, 2015–16, versus student composition of twelfth graders who scored “advanced,” 2013

Source: National Assessment of Educational Progress, twelfth Grade Reading and Math, 2013 (when this cohort of students was in high school). Note: Poor is defined as eligible for free or reduced-price lunch; that includes students whose families earn up to 185 percent of the federal poverty line. * Fewer than one percent of Black students and poor students scored at Advanced.
This is a devastating picture of the lack of diversity among America’s academic high achievers at the end of high school. Just 2 percent of high-achieving twelfth graders in reading are Black; the number is likely even lower when it comes to math. Hispanic students only fare better in comparison, comprising 7 and 5 percent, respectively, of the highest achievers in reading and math, despite making up 20 percent of the overall student population. Meanwhile, the number of poor students achieving at the highest level in reading is a third of the size it would be if income levels didn’t matter, comprising just 12 percent of the high-achieving group versus 36 percent overall. And as with Black students, the results are even worse for math.
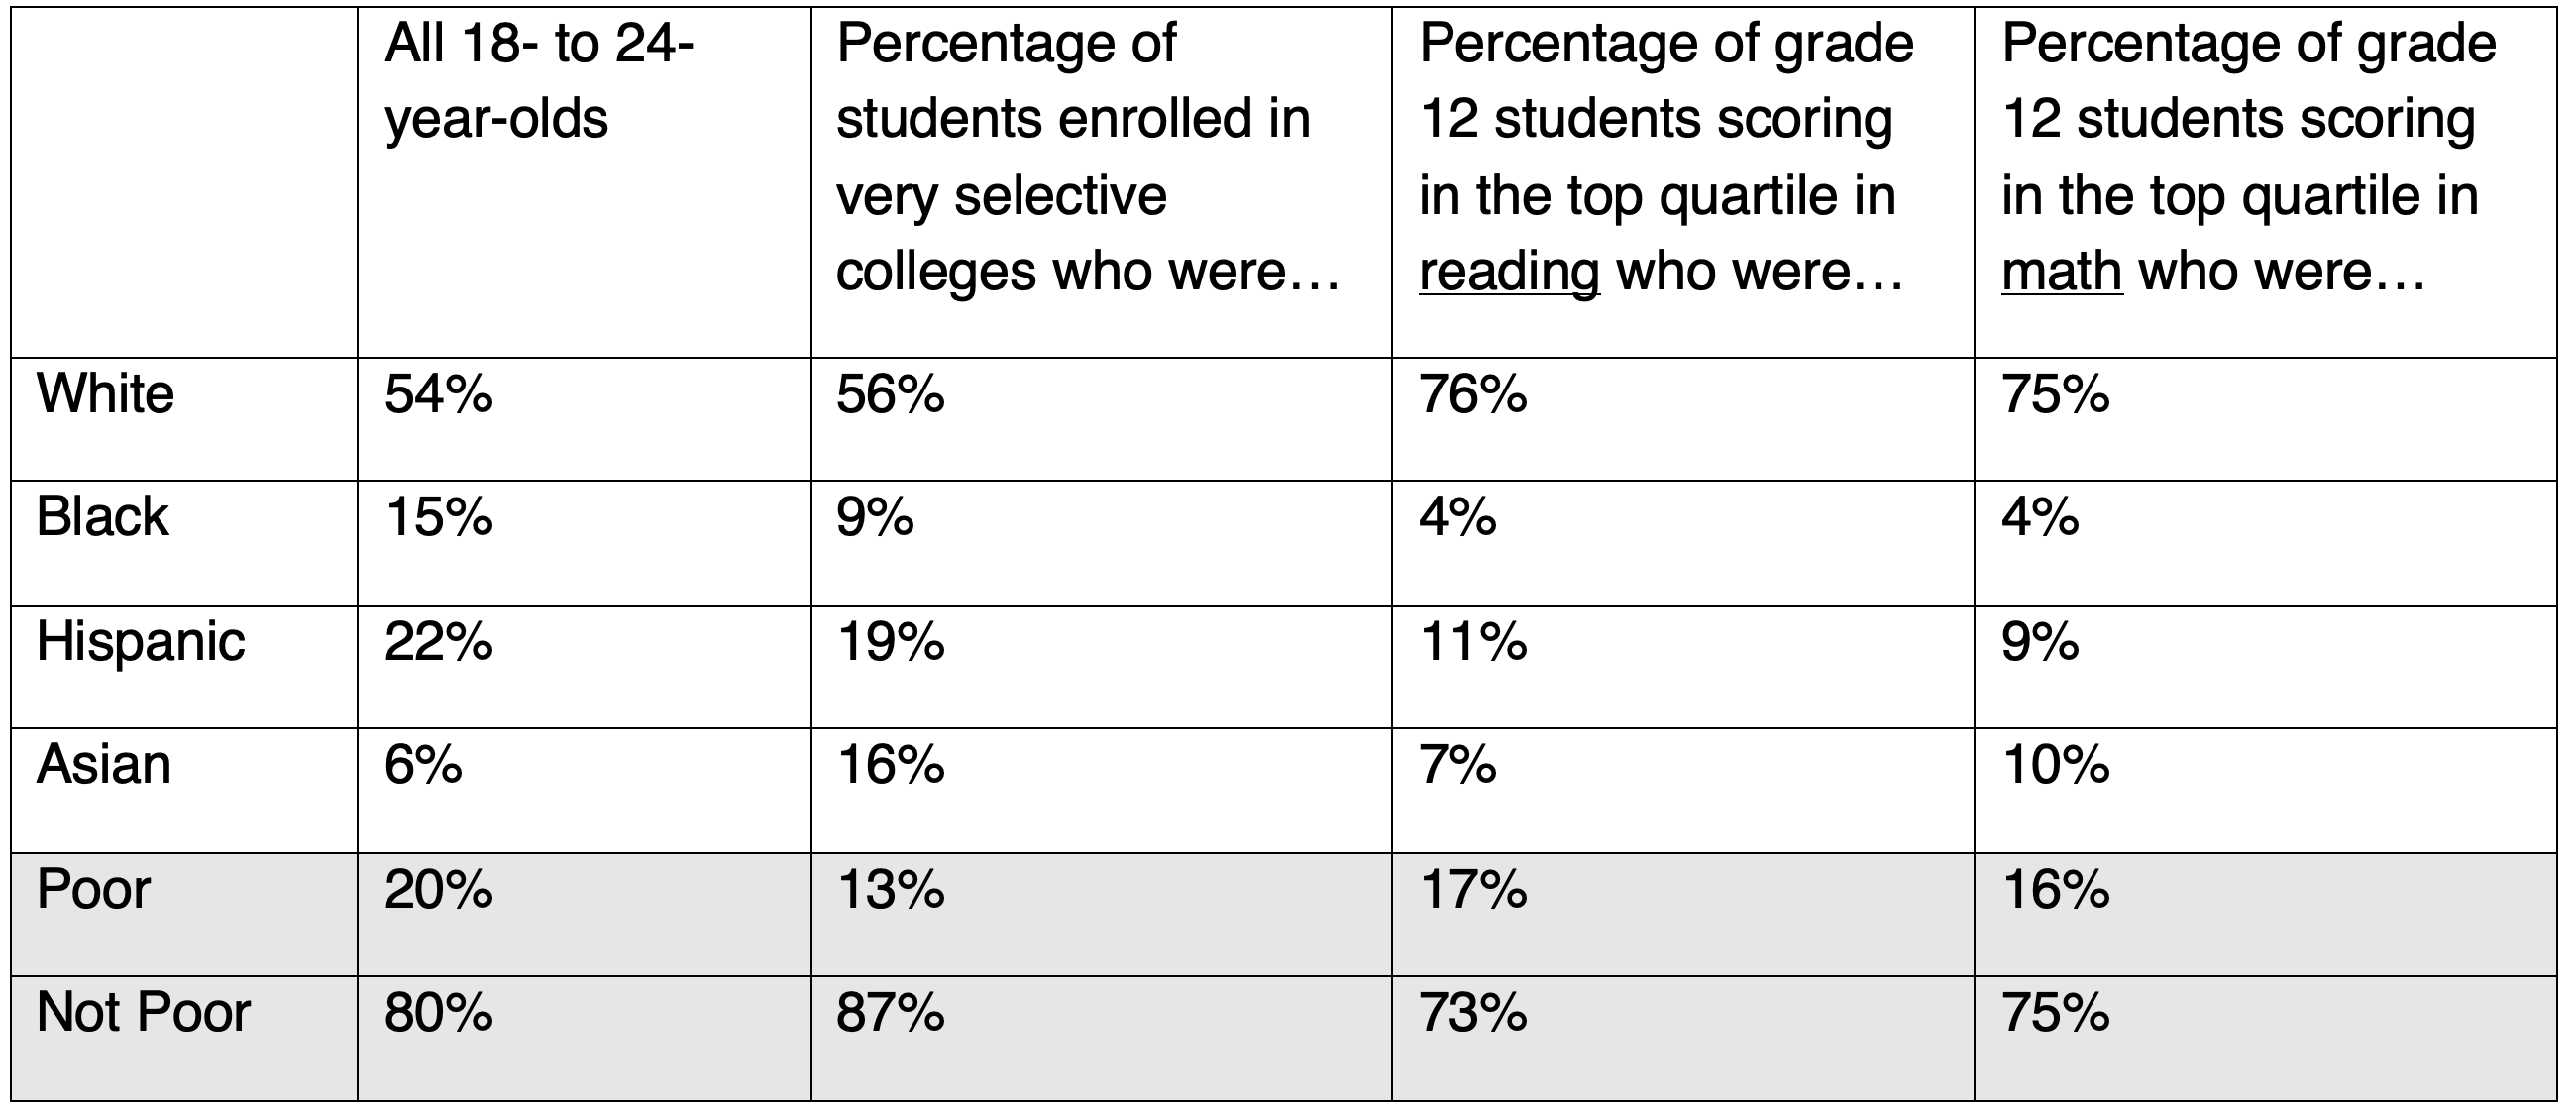
This is how it looks if we examine a somewhat broader group of students—those scoring in the top quartile of NAEP in the twelfth grade.
Table 3: Student composition of America’s “very selective” colleges, 2015–16, versus student composition of twelfth graders who scored in the top quartile, 2013

Source: National Assessment of Educational Progress, twelfth Grade Reading and Math, 2013 (when this cohort of students was in high school).
This picture is not much prettier, particularly for Black students, who made up just 4 percent of top-quartile achievers in reading and math in the twelfth grade.
Now, to be clear, tests aren’t the only way to measure college readiness, and they certainly are no measure of someone’s character or human worth. But there’s little doubt that they are related to the skills needed to excel in college—which, after all, is fundamentally an academic pursuit, especially at our most selective universities.
In coming weeks, in a series of posts, I’m going to try to make sense of these data and understand what might be done to change these outcomes. At the risk of giving away the ending, let me foreshadow my basic findings:
1. To a very large degree, these disparities are explained by socioeconomic differences. That lines up with previous research, and also fits with common sense. The students who perform well academically, especially at the tippy-top of the distribution, are much more likely to come from the upper middle class and above; to live in safe and affluent neighborhoods, full of two-parent families; and to have two college-educated parents themselves. Students who struggle, on the other hand, are much more likely to live in poverty and amid all of the scourges it presents, from “adverse childhood experiences” to lead poisoning to unaffordable child care and on and on.
And it is a simple but tragic fact that, in America today, White students are much more likely to grow up in middle and upper middle class families than Hispanic and, especially, Black students. The socioeconomic excellence gap explains much of the racial excellence gap, and is in turn explained mostly by socioeconomic inequality itself. As we will see, these patterns are in place, more or less, as early as the start of elementary school. That indicates that socioeconomic inequality, especially between conception and kindergarten, explains much of what we’re seeing.
2. However, there’s evidence that the excellence gap widens somewhat while students are in the K–12 system, especially in the earliest years. Using NAEP exams and the Early Childhood Longitudinal Study, we can travel in our Wayback Machine to look at the patterns at high levels of achievement when this cohort of students was in the eighth grade, fourth grade, and even kindergarten. And we will see that the excellence gap is not quite as large in early grades, especially in kindergarten. There’s something of a silver lining in that finding because it indicates that something is happening in our schools that is causing the gap to widen—meaning that there’s something our schools can do to address it.
If we could imagine a world in which excellence gaps did not exist, we could picture a world in which college admissions processes could be much more straightforward. They could ditch affirmative action and be neutral when it comes to race, class, and yes, gender and still yield freshman classes that represent the nation’s diversity.
Alas, we don’t live in that world, at least not yet. But there are clues that making changes in the earliest years of elementary school could indeed make a big difference—and a big dent in the excellence gap. We’ll explore those clues next time.
[1] According to the REHE report, “The measure of institutional selectivity used in this chapter was created by NCES to classify public and private nonprofit four-year institutions only. The measure uses three criteria derived from the Integrated Postsecondary Education Data System (IPEDS): (1) whether an institution was open admission, (2) the undergraduate admission rate, and (3) the 25th and 75th percentiles of ACT and/or SAT scores. For non-open admission institutions, an index was created from the admission rate and ACT/SAT data (weighted equally). Institutions were classified as very selective if they were among the top quartile of the index.” “Very selective universities” serve about 19 percent of all college students, or 8 percent of all 18- to 24-year-olds.


