Mobile Navigation

  • National
    • Policy
      • High Expectations
      • Quality Choices
      • Personalized Pathways
    • Research
    • Commentary
      • Gadfly Newsletter
      • Flypaper Blog
    • Events
    • Scholars Program
  • Ohio
    • Policy
      • Priorities
      • Media & Testimony
    • Research
    • Commentary
      • Ohio Education Gadfly Biweekly
      • Ohio Gadfly Daily
  • Charter Authorizing
    • Application
    • Sponsored Schools
    • Resources
  • About
    • Mission
    • Board
    • Staff
    • Career
Home
Home
Advancing Educational Excellence

Main Navigation

  • National
  • Ohio
  • Charter Authorizing
  • About

National Menu

  • Topics
    • Accountability & Testing
    • Advanced Education
    • Career & Technical Education
    • Charter Schools
    • Curriculum & Instruction
    • ESSA
    • Evidence-Based Learning
    • Facilities
    • Governance
    • Personalized Learning
    • Private School Choice
    • School Finance
    • Standards
    • Teachers & School Leaders
    • Think Again
  • Research
  • Commentary
    • Gadfly Newsletter
    • Flypaper Blog
    • Gadfly Podcast
  • Events
  • Scholars Program

The Education Gadfly Weekly

Sign Up to Receive Fordham Updates

We'll send you quality research, commentary, analysis, and news on the education issues you care about.
Thank you for signing up!
Please check your email to confirm the subscription.

The Education Gadfly Weekly: Education in the age of feeling

Volume 26, Number 8
2.26.2026
2.26.2026

The Education Gadfly Weekly: Education in the age of feeling

Volume 26, Number 8
view
Moving people at a school
High Expectations

Good schools don’t beat staff turnover. They’re built for it.

Education has never lacked miracle schools and stories. The real challenge isn’t identifying successful schools but learning how to recognize whether their success is institutional or temporary. So if we wanted to predict whether a school’s success will last, what should we look for?

Robert Pondiscio 2.26.2026
NationalFlypaper

Good schools don’t beat staff turnover. They’re built for it.

Robert Pondiscio
2.26.2026
Flypaper

Education in the age of feeling

Dale Chu
2.26.2026
Flypaper

Can states do anything about grade inflation?

Michael J. Petrilli
2.26.2026
Flypaper

When state curriculum lists go bad | Episode 1007 of The Education Gadfly Show

2.25.2026
Podcast

Global school choice at a glance

Jeff Murray
2.26.2026
Flypaper

The predictive power of NAEP

Alicia Anderson
2.26.2026
Flypaper
view
Emoji blocks

Education in the age of feeling

Dale Chu 2.26.2026
Flypaper
view
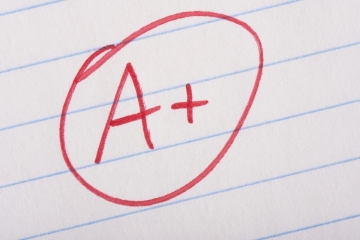
A grade in school

Can states do anything about grade inflation?

Michael J. Petrilli 2.26.2026
Flypaper
view

When state curriculum lists go bad | Episode 1007 of The Education Gadfly Show

Karen Vaites, Michael J. Petrilli, David Griffith, Ph.D., Amber M. Northern, Ph.D. 2.25.2026
Podcast
view
Students looking at a globe

Global school choice at a glance

Jeff Murray 2.26.2026
Flypaper
view
Graduate

The predictive power of NAEP

Alicia Anderson 2.26.2026
Flypaper
view
Moving people at a school

Good schools don’t beat staff turnover. They’re built for it.

Robert Pondiscio
2.26.2026
Flypaper

In my last post, responding to Holly Korbey’s call to study successful schools more closely, I argued that education’s deeper problem isn’t discovering success. It’s sustaining it. Again and again, we celebrate high-performing schools at their peak, only to watch—or more pertinently fail to notice—when they drift, decline, or disappear altogether within a decade. This raises a significant and uncomfortable question: If the high-fliers we celebrate and seek to emulate don’t stay aloft, were they really that good to begin with?

When successful schools lose their momentum, the usual suspects are leadership turnover, staff churn, demographic change, political conflict, or the quiet assumption that the success was fragile all along. But many of these factors, particularly staff and leadership changes, are not flaws in our system, they’re features. The average superintendent typically lasts little more than a single contract cycle. Principals tend to remain only about four years in a given school, with even shorter stints in high-poverty settings. Roughly a third of teachers leave the classroom within five years. Any school improvement model that only works if the adults stay in place isn’t a model—it’s catching lighting in a bottle. What ultimately distinguishes the schools that endure is not whether turnover happens, but whether effective practices have been institutionalized strongly enough to survive it. 

Some analysts have begun to demonstrate this durability problem empirically. Chad Alderman recently asked a deceptively simple question: Do “good” schools stay good over time? He found that in Virginia, only half of the schools that were in the state’s top quartile of schools in 2004 remained there in 2024.

This suggests a thought exercise: If we wanted to predict whether a school’s success will last, what should we look for? Not test scores. Not a charismatic principal. Not a compelling origin story. Those things can tell us a school is working now but clearly don’t predict if it will still be working years from now.

Let’s start by acknowledging that schools are not stable organizations occasionally disrupted by turnover. They are—or ought to be—organizations built to function despite turnover.

Before sketching what such a framework might look like, a note of humility is in order. What follows is best understood as a working hypothesis based on my observations and experience: an attempt to identify the institutional features that seem to appear, again and again, in the schools and systems whose results persist while others fade. If readers disagree, see omissions, or know of schools or districts that deserve closer study, I hope they’ll say so.

Durable schools tend to share a clearly defined instructional core. Not a “philosophy.” Not a mission statement. An operating system. They use common materials, sequence content deliberately, and define effective instruction in observable terms. New teachers are acculturated and trained into an existing model rather than invited to invent their own. Durability begins with instructional clarity.

If instructional clarity is the foundation, consistency is the structure. Schools that sustain results minimize variation in the things that matter most, particularly foundational literacy and numeracy instruction. They monitor whether the curriculum is actually delivered. They coach toward specific practices. When drift appears, they correct it.

Fragile systems rely on great teachers. Durable systems assume ordinary teachers and build routines strong enough to support them. Durable systems assume turnover and design accordingly.

One of the more revealing lessons I took from my reporting on Success Academy is that its results cannot plausibly be explained by stable staffing. Neither are they recruiting from elite colleges and universities. Teacher turnover in the network has long been substantial, in part because the demands placed on staff are unusually intense. Yet the network continued to produce unusually strong academic outcomes, even as it rapidly grew from a single school to more than fifty.

As I wrote in How the Other Half Learns:

The de facto model that has evolved is more like the U.S. Army or the Marines: a small and talented officer corps surrounded by enlisted men and women who do a tour, maybe two, then muster out, with new recruits reporting for duty. Teacher turnover, lack of experience and continuity, is widely assumed to be a problem, particularly in urban schools. But it’s never suggested that our military would be better if only soldiers stayed in uniform longer. So far, the relative inexperience of Success Academy teachers hasn’t seemed to compromise their effectiveness.

The lesson isn’t simply that this model works, but that its effectiveness depends on turning instructional expectations into organizational routines rather than individual discretion. In practice, this meant that first-year teachers were not improvising their own curriculum or instructional routines. Lessons were tightly sequenced, materials were standardized across the network, and instructional leaders conducted frequent classroom walkthroughs to ensure the model was being executed as designed. Consistency was not aspirational. It was operational.

Nearly a decade after my reporting, Success Academy’s academic results remain consistently strong, suggesting the model was not a temporary reform-era peak but an institutional system capable of sustaining performance despite high staff turnover. That said, its founder, architect, and culture-keeper, Eva Moskowitz, is still in place, meaning the ultimate test of its durability is still to come.

Moreover, I don’t think Success Academy’s model is universally portable. New York City is a magnet for ambitious young people willing to endure an intense professional environment for a few years. It’s far from certain that the same dynamic would obtain in smaller or less attractive labor markets—Memphis, Buffalo, or Youngstown, for example. Staff churn would likely be fatal in such places.

Looking back, education reform spent decades searching for the miracle school—the visionary leader, the transformative model, the “It’s Being Done” proof point that dramatic improvement was possible. We found many such schools. What we rarely built were institutions designed to sustain their promising results. Education has never lacked miracle schools and stories. The real challenge isn’t identifying successful schools but learning how to recognize whether their success is institutional or temporary.

If you know of a school or district that has quietly sustained strong results for a decade or more—not just a brief surge, but genuine institutional consistency, particularly school or districts like Steubenville and Success Academy that are succeeding with students who are statistically less likely to be successful—I’d like to hear about them. Durable success, not temporary breakthroughs, is what the field most needs to find, study, and emulate. In her initial Substack piece, my pal Holly Korbey noted that Kobe Bryant studied Michael Jordan to raise his game, so educators should do the same. I agree, but give me John Stockton, Vince Carter, Cal Ripken, or Lou Gehrig as models: guys who were not just good but who managed to stay that way for a long, long time.


view
Emoji blocks

Education in the age of feeling

Dale Chu
2.26.2026
Flypaper

If the medieval period was the age of faith, and the Enlightenment qualifies as the age of reason, what era are we living in now? Princeton’s Robbie George has an answer: the age of feeling. Education is no exception, where instinct, ideology, and emotion increasingly outweigh standards, measurement, and outcomes. It’s an era where, as Seinfeld’s George Costanza once put it, “It’s not a lie if you believe it.” Conviction has become a substitute for truth, creating a permission structure for policy driven more by narrative, followership, and vibe than evidence.

Consider graduation rates. They have climbed steadily in many states, even as national assessments show students struggling with basic reading and math. Rather than treat that divergence as a warning sign, policymakers often redefine success, dilute standards, or shift attention to less exacting measures. The appeal is not to what students demonstrably know, but to measures that support what feels good.

George frames the dilemma this way:

In the age of feeling, people will identify what’s right and therefore to be done or permissible to do with their wants, desires, feelings… So the truth, how conveniently, lines up with what they want. For figures like Plato and Aristotle, you don’t figure out whether something is worth doing or should be done or even may be done by figuring out whether you want to do it… The whole point of inquiry is to subject one’s feelings to rational scrutiny so that you can determine whether an impulse or a feeling or a passion that you have is one that should be acted on because it’s in line with human flourishing, or ultimately out of whack with it.

That distinction—between aligning truth with desire and subjecting desire to scrutiny—exposes a persistent tension in education: What we feel is right can override what we know is effective. The pattern appears again and again—in how we teach children to read, how we interpret test scores, and how we judge school models that generate strong academic outcomes but defy our assumptions and ideological preferences.

A few years ago, the New Yorker chronicled the rise of “vibes-based literacy,” an approach that emphasizes student interest and guessing at unfamiliar words over systematic phonics instruction:

It’s startling to realize that panels of experts had to argue the case that teaching children to read involves careful attention to the relationships between sounds and letters, or enhancing their vocabulary and knowledge of various subjects. It’s stranger still that, in many school systems and for many years, this was the losing argument.

Decades of research have identified reading models that consistently raise student achievement. Programs such as Direct Instruction and Success for All have produced strong results in rigorous studies, particularly for disadvantaged students. Yet scripted curricula frequently meet resistance because they constrain adult discretion and challenge long-held assumptions about how classrooms should feel. In an age that prizes autonomy and intuition, even a strong record of success can be discounted if it conflicts with what feels right.

If something as foundational as how children learn to read can be guided more by philosophical convictions about “natural” learning and professional orthodoxies than by evidence, it should prompt deeper reflection about the teaching profession itself. Carl Hendrick, a veteran educator and researcher, describes how he spent five years teaching without understanding how learning actually happens—a gap shared by many educators. And yet, as the adage goes, many refuse to let the facts get in the way of their opinions, no matter how wrong those opinions might be.

That same dynamic pollutes the debate around standardized testing. When results disappoint, they are often softened, reframed, or dismissed rather than confronted. Diane Ravitch once remarked, “The most brilliant and intelligent minds do not shine in standardized tests because they do not have standardized minds.” It’s a specious sentiment—superficially appealing but substantively meaningless, offering no data and no insight. To be sure, no exam is perfect, and there are many ways to gauge student learning, but in the age of feeling, the mere belief that a test is unfair or flawed becomes sufficient justification to turn a blind eye to measurable outcomes.

Even when a school model consistently delivers demonstrable results, “feelings”—broadly understood—can still override objectivity. Take Success Academy. In the latest round of state exams, students had pass rates of 92.5 percent in English language arts and 96.2 percent in math—nearly double the proficiency rates of their public school peers. Black and Hispanic students at Success outpaced their city counterparts by similarly wide margins, with proficiency rates exceeding 90 percent, while citywide rates hovered near the mid‑50s. Their students also excel on AP exams and the SAT. Yet the network’s success has not quelled its naysayers, whose objections are often rooted in perception or ideological unease—even when the most cited concern, student selection and attrition, does little to diminish academic outcomes. Success Academy’s planned expansion to Florida has raised these critics’ hackles, underscoring how strongly feeling can override everything else.

There is something seductive about equating what we feel with what is right. But it undermines the pursuit of truth, which, as Robbie George says, must be achieved through scrutiny and inquiry. When a culture normalizes the idea that conviction equals truth, schooling becomes uniquely vulnerable. If education is to serve its purpose, we must recover that commitment to truth because reality, however inconvenient, eventually asserts itself in what students know, what they can do, and the world they must face.

view
A grade in school

Can states do anything about grade inflation?

Michael J. Petrilli
2.26.2026
Flypaper

Grade inflation is having a bit of a moment. The most recent round of recriminations came via the scandal at the University of California-San Diego, when the math department reported that one in eight incoming students needed remediation—sometimes at the grade school level—even though those students got A’s in their high school math classes.

Then, a few weeks ago, Jeff Denning published a new study, featured in the Hechinger Report, showing the negative long-term consequences of low grading standards. As grading got easier, students learned less, they graduated at lower rates, and even earned less as adults.

None of this is news to those of us at the Thomas B. Fordham Institute, as grade inflation is a topic with which we’ve been obsessed for many years. Way back in the pre-Covid days, we commissioned a couple of great studies from academic superstar Seth Gershenson. One looked at high school grade inflation trends over a ten-year period, and another looked at the relationship between teachers’ grading standards and student achievement.

What Seth found, in line with other studies, is that grading is indeed getting easier over time, and that teachers who are tougher graders help their students learn more—not just in their own classes, but even when those students move on to the next grade level.

(This, by the way, points to two different definitions of grade inflation. Once is about changes over time—how it’s gotten easier to get, say, an A than before. The other is about low grading standards in general—that it’s simply too easy to get an A.)

And Seth’s studies were before the Covid-era craze around “grading reform,” a.k.a. “grading for equity,” which brought some bonkers practices to thousands of American schools, like the “no zeros” policy (giving students 50 out of 100 even if they didn’t turn in an assignment or show up for a test), or eliminating points for homework or class discussion, or giving kids unlimited exam retakes. All of which can easily lead to inflated grades unless implemented with (rare) countervailing reforms to keep grading standards high.

None of this is good for kids. If it’s super easy to get an A, most students won’t put in much effort (despite what the ridiculously naïve “intrinsic motivation” people might tell you). And if it’s too easy to get at least a D, some students won’t put in any effort at all. And effort is most of the ball game when it comes to student learning. During class, when doing homework, and when studying for tests, kids have to actually try and exert intellectual muscle. It’s a cliché to say that learning doesn’t happen by osmosis, but it happens to be true.

Nor is this a happy situation for teachers. Those who become known as tough graders are rarely rewarded for it. If anything, they will hear complaints from students and parents, which might lead to complaints from administrators. We don’t want to hurt our snowflakes’ chances at getting into top colleges! Or, at the other end of the academic spectrum, we don’t want to keep marginal students from graduating from high school at all. “Just go ahead and give the kid an A, just go ahead and pass the kid”—so teachers say they hear too often from their principals.

Is this a solvable problem?

We know from Seth’s analyses that the big variation in grading standards is not school to school, but teacher to teacher. It’s akin to variations in teacher effectiveness writ large, with the greatest disparities happening in classrooms right next to each other, rather than across schools or across the state.

What that means, then, is that school and district leaders are well positioned to do something about this issue. They can set very clear standards for how grading should work schoolwide and districtwide. They can have teachers grade papers and tests and assignments of their peers’ students, and vice versa, to encourage more honest, accurate, and tougher grading. They could look at data from teacher to teacher and school to school to see if grading standards are being applied evenly and consistently (by comparing student scores on external test with student grades).

But if you are a governor, a state superintendent, or a legislator and you want to do something about this problem, what levers do YOU tug?

This gets harder.

Of course, there’s testing. Many of us reformers believe that test scores are the antidote to grade inflation because at least those scores can be trusted and are less susceptible to inflation. (Unless states decide to make their own tests easier or give most schools an A or B in their accountability system, which, unfortunately, is also becoming common. So states should start by not doing that!)

But test scores are not as effective as we’d like to believe when it comes to communicating to parents how well their children are learning. Years of research by Learning Heroes demonstrates that parents simply trust grades more than test scores. So even if the state reports that their child is not proficient, parents tend to think their son or daughter is doing fine as long as they are getting good grades from teachers. And most parents don’t know that, because of grade inflation, a B is no longer all that high a grade—or a sign that their kid is on grade level or on track.

So what else might states do about grade inflation?

  • One idea is to get rid of any incentives in state policy that might encourage inflated grades. I’m thinking about college scholarships that are based primarily on student GPAs, as happens in Florida and Georgia. Or direct admission policies that admit students directly into state universities based only on their high school GPAs. These are undoubtedly well intended, but they create clear disincentives for schools and teachers to be tough graders.

  • Another idea would be to ensure that teacher evaluation systems, where they still exist, credit teachers for being tough graders.

  • There’s also transparency. Cincinnati Public Schools recently adopted a policy, for example, that will show students’ test scores next to their grades on their report cards. Maybe this will at least help parents know about and notice discrepancies. Perhaps states could mandate that all districts do this or offer incentives to systems to try it.

  • States might do the same thing for teachers, sending them data showing how tough a grader they are compared to other teachers teaching at the same level or teaching the same courses at the school, district, and state level. I bet a lot of teachers aren’t even aware that they are easy graders.

  • And states could try to ban “no zeros” policies and the like, though I’m not really sure how that would work. But at minimum, they could put out guidance to schools districts about the importance of high grading standards. And when intervening in chronically-low-performing schools, such as the bottom 5 percent of schools identified under ESSA, they could make sure that the school’s grading standards are something their teams look at.

Grade inflation is a large and growing problem, one that’s readily understandable by parents and the public but needs attention and effort if we’re going to turn it around. 

Editor’s note: This was first published on Mike's Substack, SCHOOLED.

view

When state curriculum lists go bad | Episode 1007 of The Education Gadfly Show

2.25.2026
Podcast
 

Karen Vaites, founder of The Curriculum Insight Project, joins us to discuss the evolving debate over curriculum reviews and state adoption policies. As more states look to third-party evaluations to guide decisions—and some consider mandating state-approved lists—how can policymakers avoid making costly mistakes?

Then on the Research Minute, Amber Northern examines new evidence on whether teacher effectiveness truly transfers when high-performing educators move into lower-achieving schools.

Recommended content:

  • Educators Were Sold a Story About Phonemic Awareness —Karen Vaites, The Curriculum Insight Project
  • What American Education Reformers Can Learn from England — Helen Baxendale, Education Next
  • Is Teacher Effectiveness Fully Portable? Evidence from the Random Assignment of Transfer Incentives —Matthew A. Kraft, John P. Papay, Jessalynn James and Manuel Monti-Nussbaum, EdWorkingPapers (2026)

Feedback Welcome: Have ideas for improving our show in 2026? We would love to hear them. Send them to [email protected]

view
Students looking at a globe

Global school choice at a glance

Jeff Murray
2.26.2026
Flypaper

School choice has expanded and diversified over the last 30 years. No longer is it just “public vs. private” or even “district vs. charter vs. private.” Today, it increasingly includes options like education savings accounts (ESAs), microschooling, tax-credit programs, a newly-resurgent homeschooling sector, and more. It is also a movement with international variations throughout the countries of the Organization for Economic Co-operation and Development (OECD), as a new report from The National Center on Education and the Economy (NCEE) makes clear.

The report starts with a definition of school choice that’s basic and familiar: Can primary or secondary level students enroll in a school—public or private—outside the school assigned to them based on their residential address? Thirty-seven of the 38 OECD member countries answer yes to this definition in some form, and the one outlier, Greece, seems to have lots of local variety built in to its government-run education system. Not all countries allow choices in every city, province, region, or state—or at every grade level—but the report’s authors consider any choice anywhere in the country as a binary example of “allowing school choice.”

School choice as a general concept is almost universal in the developed world, although the breadth of options varies greatly. Mexico, for example, allows limited public options in certain regions only. The Netherlands, by contrast, has a robust choice infrastructure nationwide, and more than 70 percent of students enroll in private or public schools outside the school assigned to them based on their residential address. Families across Finland have similar options, but only 2 percent of students take advantage of them. The report does not dwell on comparisons of uptake among the various countries, but does note that both supply and demand have been static in most countries over the last decade, with only Australia and the United States seeing an appreciable increase in the share of students utilizing an option not based on residential address, largely due to increases in the supply of options.

Open enrollment in another public school is the most common form of school choice in the OECD, with 36 countries allowing it at some level. This category includes charter schools—defined as “independent public schools that operate under a contract (charter) with an authorizing entity”—if such an option exists in a given country. (Sadly, there are no data provided on which countries allow for such schools.) Thirty-five of those 36 open-enrollment countries also provide government funding to support parents choosing tuition-charging private schools via vouchers or education savings accounts, although three restrict support to non-religious schools only.

The report then goes into a deep dive on four countries—Australia, Chile, The Netherlands, and Sweden—as well as highlighting a number of important facets of education, like curriculum, assessments, and staffing. Among the interesting details: Even in OECD countries that have national curricula, choice schools are often allowed to deviate from the prescribed topics and sequences, though a few require administrative approval for alterations. However, more than half of the OECD members that have national or regional assessments still require all private schools to administer the same exams required of traditional public schools even if their curricula are not the same—a topic still up for debate here in the United States.

The NCEE authors are appreciative of international efforts to deliver educational benefits to students through autonomy, innovation, and competition, even as they express concerns. Among these are making clear and reliable information available to parents on the number, quality, and accessibility of their choices (highlighting Australia’s My School platform as an exemplar) and the potential for school choice to increase racial, ethnic, and socioeconomic segregation. Here, Chile is cited as both troubling case study of a country where such segregation has occurred and as an example of a constructive response to the problem.

The report asserts that NCEE is neither for nor against any aspects of school choice—thus it does not make conclusions or recommendations based on this data snapshot—but that the organization wishes to “inform U.S. leaders, educators, and communities” about the “opportunities and tradeoffs” associated with what are clearly widespread and long-established school choice frameworks in countries around the world, likely because the United States is in a strong growth mode in terms of school choice. In the end, the authors’ attempt to visualize global school choice of the future—such as burgeoning microschools and a new picture of who is homeschooling and why—paints a picture driven most strongly by developments here in the U.S.

SOURCE: “School Choice: A Global Snapshot,” The National Center on Education and the Economy/NCEE (January 2026).

view
Graduate

The predictive power of NAEP

Alicia Anderson
2.26.2026
Flypaper

Across the United States, a representative sample of thousands of fourth, eighth, and twelfth grade students has begun sitting for the National Assessment of Educational Progress. NAEP is administered independently of state-level standards but presents state- and national-level results. As such, it is one of the only sources to compare academic achievement across states with varied approaches to schooling, particularly for younger students who aren’t yet participating in college entrance exams like the SAT or ACT. If the federal government is serious about “returning education to the states,” then it’s critical to have a tool to see which state approaches work.

Elena Doty, Thomas Kane, Tyler Patterson, and Douglas Staiger set out to determine how changes in NAEP scores at the state level relate to future life outcomes for various cohorts. They explore NAEP data from long before the pandemic, looking primarily at state-level eighth-grade math scores from 1990 to 2019 and later adult outcomes from the Census Bureau’s American Community Survey. Students in these cohorts were born between 1977 and the early 2000s, with observations in adulthood through 2019. The researchers link individual adult outcomes to the birth state as a proxy to determine where they went to school. They control separately for adult location to prevent labor market differences between states from impacting their results, helping ensure that the results reflect educational differences rather than broader economic conditions. By pairing cohort-level academic data with individual adult outcomes, the research team can estimate how much NAEP improvements predict long-term outcomes.

According to their analysis, states with the largest gains in eighth-grade math scores also showed the strongest improvements in adult outcomes, particularly economic indicators. A 1 standard deviation rise in scores is associated with a 6–8 percent increase in future adult earnings. State-level cohorts with higher scores were also more likely to graduate from high school and enroll in college. As adults, they were more likely to be employed and work longer hours than their lower-scoring peers.

The positive results extended beyond employment and income. Higher-scoring cohorts had lower rates of teen motherhood, lower incarceration rates for young men, and lower violent crime arrests (a decline of 30 percent per standard deviation increase in eighth-grade math score).

Interestingly, the research team found no clear connection between test score gains and bachelor’s degree completion, home ownership, or marital status—markers often assumed to predict better adult circumstances like higher salaries and lower incarceration rates.

The economic and social improvements held even after controlling for demographics, parent education, health, labor market conditions, and regional economic trends. The relationship between eighth-grade math scores and adult outcomes isn’t simply a reflection of family background and does not appear to depend on traditional credentials often associated with economic mobility. The results indicate a relationship specific to academic achievement and adult outcomes that is independent of the general economic landscape within each state—in fact, the correlation between state test score gains and changes in median household income was slightly negative over the study’s time period (-0.25).  

Nationally, NAEP gains in fourth and eighth grade often fade out in twelfth-grade NAEP scores. Twelfth-grade scores are not available at the state level, but eighth-grade gains appear to lead to better adult outcomes regardless of what happens to national scores later on. The findings align with other researchers’ theories that test score gains sometimes transfer to real-world benefits that are more durable than the scores suggest.

NAEP is unmatched in providing comparisons between states and in this analysis the differences among states are significant. North Carolina’s students improved nearly a full standard deviation from 1990 to 2019—gains associated with over 7 percent greater earnings. In contrast, Iowa’s student scores were essentially flat over three decades, with correspondingly smaller changes in adult outcomes.

If eighth-grade math gains predict better adult outcomes, post-pandemic NAEP declines are cause for serious concern. The national average decline in eighth-grade math scores from 2019 to 2022 (down 0.2 standard deviations) may lead to a 1.6 percent decrease in future income for those students. In Iowa, Maine, Montana, North Dakota, and Oregon, 2022 scores fell below 1990’s level. Learning recovery is happening at different rates in different states, and the national average continued to fall on the 2024 NAEP. It will be a few more years before post-pandemic NAEP data can be viewed against adult outcomes, but Doty et al.’s findings are some of the clearest evidence yet that learning loss has lasting consequences. 

For decades, NAEP has been the standard for measuring where state efforts are working and where they fall short. This study’s authors did not set out to illustrate NAEP’s value—the study was underway before the current administration pushed for major changes at the Department of Education. Still, the results show that, as states take the lead on education, NAEP remains a powerful tool for understanding how education policy choices shape long-term outcomes for students.

SOURCE: Elena Doty, Thomas J. Kane, Tyler Patterson, and Douglas O. Staiger. “What do changes in state NAEP scores imply for birth cohorts’ later life outcomes?” Journal of Policy Analysis and Management, Volume 45, June 2025.

Fordham Logo

© 2026 The Thomas B. Fordham Institute
Privacy Policy
Usage Agreement

National

P.O. Box 110
Burke, VA 22009

202.223.5452

[email protected]

Ohio

P.O. Box 82291
Columbus, OH 43202

614.223.1580

[email protected]

Sponsorship

130 West Second Street, Suite 410
Dayton, Ohio 45402

937.227.3368

[email protected]