A new white paper from NWEA, and its accompanying op-ed in The Hill, claim that districts are more likely to permanently shutter schools with a high proportion of poor and/or Black students, even after controlling for enrollment patterns. Which made me think: Here we go again. As with previous analyses from other scholars, it plays the greatest hits: document that Black and poor students are overrepresented in some unfortunate circumstance (in this case, school closures), control for one or two non-discrimination explanations, watch the Black/poor coefficient not quite go to zero, and conclude that bias is the culprit. In 2024, Vladimir Kogan published a tour de force explaining why that interpretive move fails, along with a phenomenal review of research on school closure. I won’t retread where he walked, but it’s well worth a read.
The new paper asks four questions. The first two—Did closure rates change post-Covid? And are Black and poor schools overrepresented among closures?—are answered with clean, descriptive statistics. Unsurprisingly, disadvantaged students disproportionately attend schools at risk of closure: School closure stems from declining enrollment, and disadvantaged students are more likely to attend schools that parents of all backgrounds would rather their students not attend. Also, closure rates dipped right after Covid, likely due to the infusion of federal funds, but are trending back towards pre-Covid rates. The interesting questions are the last two: Do those racial disparities in exposure to school closure hold after accounting for enrollment declines? And what about poverty discrepancies?
On the racial disparity question, the authors argue that schools serving larger shares of Black students are more likely to close even after differences in enrollment decline are taken into account. They offer Figure 3, below, as evidence for that claim. What it actually shows is that the predicted closure rate rises as the share of Black students increases. Moreover, three of the four lines are nearly flat, while the one that rises sharply likely represents a very small and unusual group of schools. How small? The authors do not say. The figure includes no ranges showing how uncertain these estimates are, and the authors do not provide the underlying statistical results (no coefficients, no standard errors, no p-values). Readers therefore cannot tell whether the differences are statistically significant or could simply be due to chance. Nor do the authors explain how they measured enrollment decline. Did they divide schools into groups based on the size of their decline, or did they treat enrollment decline as a continuous measure and simply choose 50 percent as an extreme example for the graph? Each approach would raise their own questions, but the reader is left guessing. Showing a figure with rising lines and calling it evidence of a disparity, while hiding the model behind it, is insufficient. The racial disparity question is not answered. It is gestured at.
Figure 3: Predicted likelihood of a school closure in 2024–25 by the percentage of Black students under various scenarios
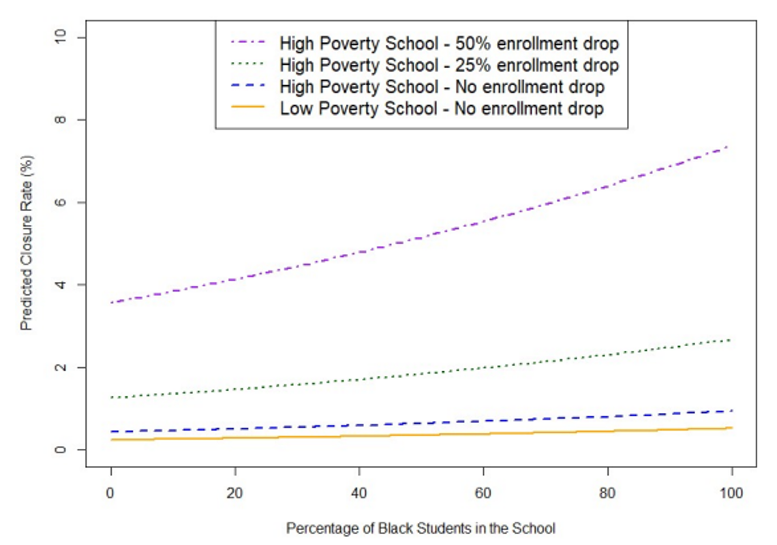
Note: The presented results are the predicted probability of a school closing in 2024–25 conditional on (a) percent of Black students in the school, (b) school-poverty level, and (c) degree of enrollment drop between 2020 and 2024.
The poverty question is worse. The abstract and conclusion both state that poverty disparities “hold after accounting for enrollment declines.” This claim does not appear in the methods section, is not tested in any model presented in the paper, and has no corresponding figure. Figure 3 holds school poverty level constant and looks at how closure risk changes with the share of Black students. It therefore cannot tell us whether high-poverty schools remain more likely to close after enrollment decline is taken into account. The finding simply does not exist in the paper that supposedly produced it.
It is difficult to avoid the conclusion that the authors are driven by an aversion to school closure, especially since they show their hand in their op-ed summarizing the paper. Here, their only reference to school closure as necessary part of fiscal responsibility is to wave this concern away: “What’s more, school closures do not always achieve their end goal of cost savings. A growing body of national evidence shows that the fiscal benefits of school closures can vary.” The results of daily exercise can “vary”; there is a chance, for example, you will get hit by a bus while out on a run. This is a textbook case of focusing on the downside risk of the policy one dislikes while ignoring the downside risk of one’s preferred policy. On that note: When school districts overspend on under-capacity schools, it costs disadvantaged families money. Everyone pays sales and property taxes!
They conclude by saying, “Finally, policymakers must address the root causes that make closures appear inevitable in the first place. These include gentrification that displaces families, declines in state public education funding and broader housing and economic patterns that reduce school enrollment.” This is a pretty transparent indication that the authors assume that schools only lose enrollment due to structural forces rather than the fact that a small subset of U.S. schools are miserable places where most parents of attending students are constantly looking for an alternative—hence the declining enrollment. These are often schools with daily fights, chaotic classrooms, despondent teachers, and scared students. When families avoid a school, they are telling us something, and we should listen.
When a district is operating below capacity to the detriment of its finances, it should prioritize closing schools that have experienced the largest and most sustained enrollment declines—something data can show directly. That may mean closures fall disproportionately on schools serving Black and poor students, but the disparity alone does not establish that those students were treated unfairly. Closing them is not a symptom of bias against those students, but a sign that the district has finally come around to caring about them. The politicians and district leaders willing to act on this and preserve the financial integrity of struggling districts are few and far between. Studies like this one make that case harder to win. And given the weakness of the evidence marshaled here, that is unfortunate.
SOURCE: Jazmin Isaacs, Megan Kuhfeld, Sofia Postell, and Ayesha K. Hashim, Post-Pandemic School Closure Trends: Schools Serving Black Students Disproportionately Closed (NWEA, 2025).