
Part I discussed Robert Pondiscio’s “Tiffany Test”: How do high-achieving students fare as they move through a high-poverty elementary school? Among the eleven states in the Smarter Balanced consortium, 120,000 fewer elementary students—48,000 of them economically disadvantaged students in California alone—were achieving at or above math proficiency by the end of fifth grade, compared to where they were in third grade. The news in reading is considerably better and potentially earth-shaking.
Across the classes of 2024, 2025, and 2026—in the Smarter Balanced states, the average increase in English language arts (ELA) is “just” 6 percentage points. This turns out to be a substantial number: 160,000 more students in fifth grade are meeting and exceeding ELA standards than they were as third graders. See figure 1.
Figure 1. Rise in elementary English language arts achievement
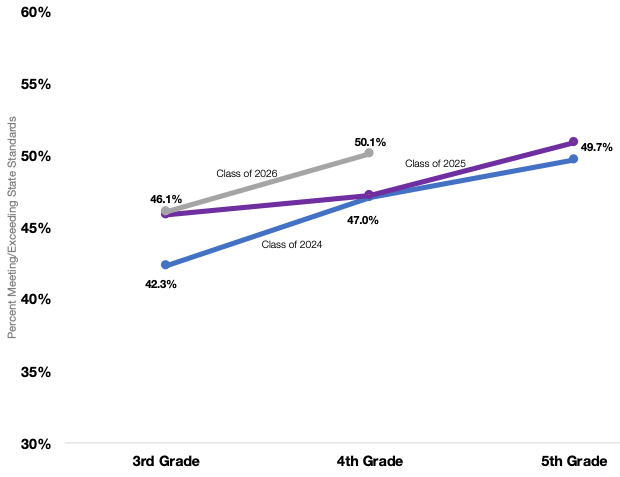
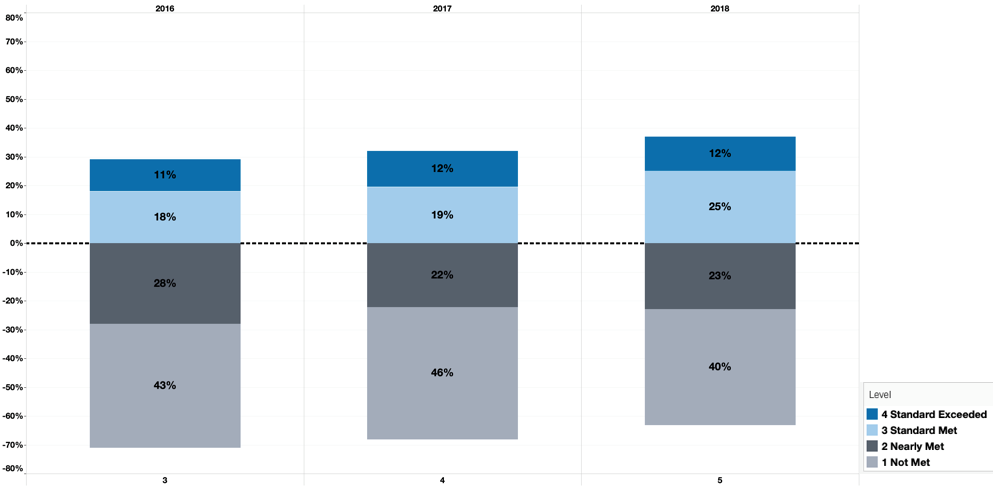
In California alone, 71,000 of these students are from economically disadvantaged families. In every cohort, more elementary students are scoring at progressively higher levels in ELA as they move through school. For example, figure 2 below shows the ELA achievement of low-income students in the class of 2025 as they go from third to fourth and then to fifth grade. The gray bars (Levels 1 and 2) are shrinking and the blue bars (Levels 3 and 4) are rising upward. If you’re a teacher or a system leader, this is precisely what you hope to see.
Figure 2. Rise in reading achievement for California’s economically disadvantaged students, class of 2025
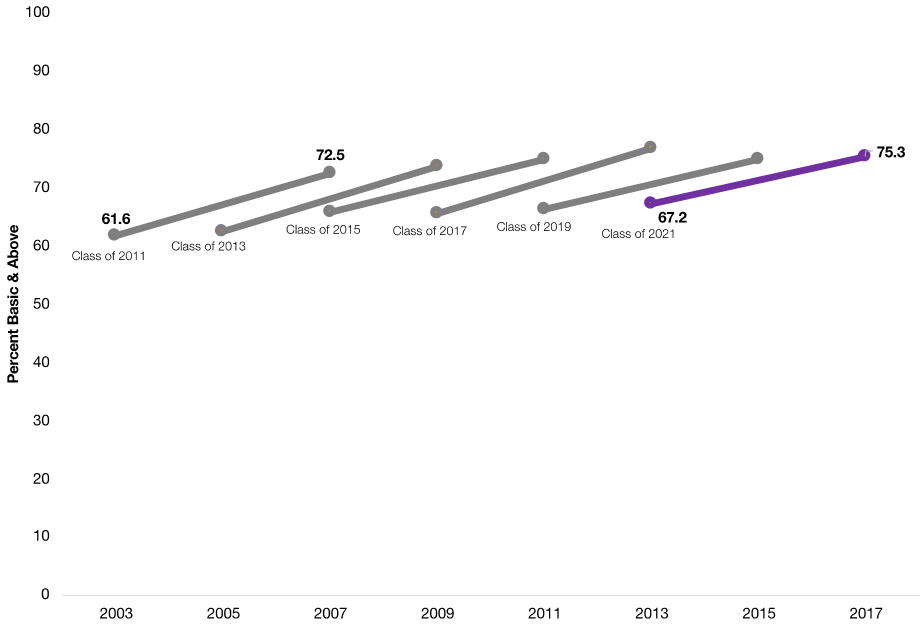
There are two reasons to suggest this trend over time is not a peculiar feature of the Smarter Balanced tests. First, this same pattern is evident in NAEP reading scores. NAEP tests a nationally representative sample of students each year, and we can compare how each cohort of eighth graders performed four years earlier. When we look at the percentage of students reading at NAEP’s “basic” level and above, we find a similar trend to the one we see in the Smarter Balanced states. Each new class has a slightly higher starting point in fourth grade and finishing point in eighth grade. See figure 3.
Figure 3. Rise in NAEP reading scores, fourth to eighth grade
Second, a recent equating study published by the Institute for Education Sciences shows that most states have considerably raised the rigor of their assessments in the last decade. The cut scores for most state standards and tests, for both grades and both subjects, including the Smarter Balanced states, were mapped at the mid-range of the NAEP Basic achievement level.
What then might explain the rise in reading and writing achievement? Here are some conjectures: Maybe schools are spending more time on reading. Maybe, for all the philosophical hand-wringing, teachers are emphasizing decoding, along with all the recommendations of the National Reading Panel. Maybe students are reading more grade-level texts. Maybe students’ background knowledge is improving. Maybe the preparation and support of teachers has gotten better.
The success described here isn’t sufficient for where all students need to be as readers and writers, but it is substantial. If the math story showed schools and districts aren’t learning from their failures, they don’t appear to be studying the sources of their successes either.
In her book Thinking in Bets, Annie Duke describes how this is what expert poker and chess players do after they win a big match. They replay each move, needing to separate their skill from luck, and to carefully understand what moves might work well again.
Districts and state departments of education need to do the same with their early literacy teachers. While half of fifth graders in Smarter Balanced states are reading proficiently, economic projections from Georgetown University and Mark Zandi at Moody’s show that we need at least 65 percent of our students by 2030 to be on track to college readiness. All of the students in our classrooms—the Tiffanys, the Trevors, the Eduardos, and Zoes—deserve nothing less.