On Wednesday, the government will release the 2019 National Assessment of Educational Progress scores for twelfth grade students. The results shouldn’t be a big surprise because they will reflect everything that the (pre-pandemic) cohort of students learned since birth—not just what they learned since the last time they were assessed, as eighth graders in 2015. And we already know how they fared earlier.
This was the last cohort born into the Clinton-era boom, arriving in the world in the fall of 2000 through the summer of 2001, a time when child poverty rates declined sharply. These children were babies and toddlers during the mild post-9/11 recession, first-graders when the Great Recession hit, and in grades three through seven when education spending declined in real dollars for probably the first time in American history (2010–13).
Figure 1. Child poverty rates according to the supplemental poverty measure, by race and year
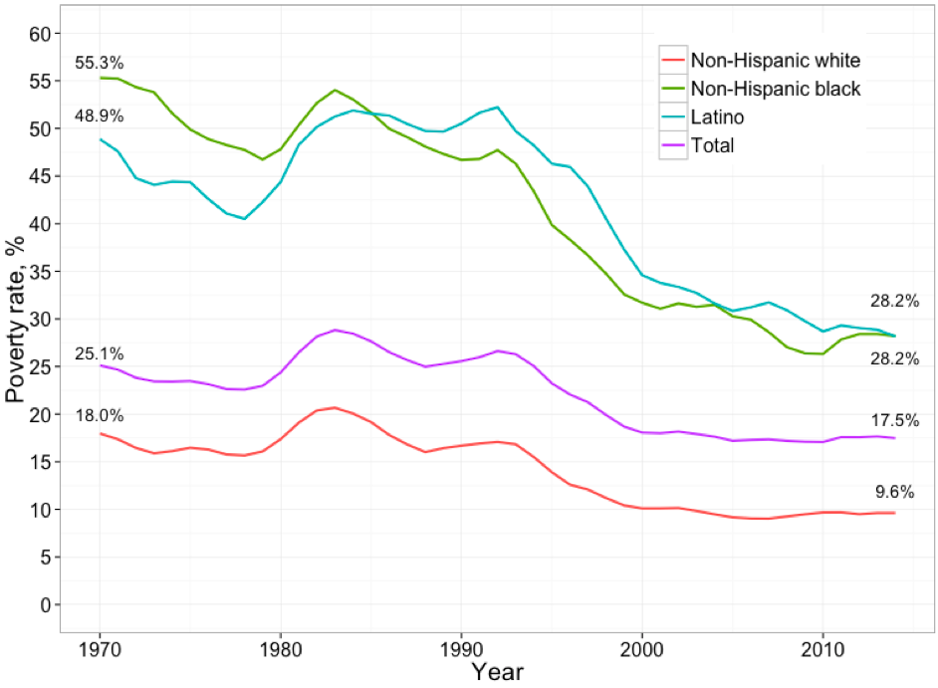
Source: Nolan, Laura; Garfinkel, Irwin; Kaushal, Neeraj; Nam, JaeHyun; Waldfogel, Jane; and Wimer, Christopher, “Trends in Child Poverty by Race/Ethnicity: New Evidence Using an Anchored Historical Supplemental Poverty Measure," Journal of Applied Research on Children: Informing Policy for Children at Risk: Vol. 7: Iss. 1, Article 3. Available at: http://digitalcommons.library.tmc.edu/childrenatrisk/vol7/iss1/3.
This context is important because, as I’ve argued before, socioeconomic conditions and school spending are almost surely related to student achievement outcomes, especially if those variables shift dramatically enough, and especially for the poorest, lowest-performing students. In the late 1990s, these factors were heading in a positive direction, with sharply declining child-poverty rates and significant increases in school spending. Combined with early accountability reforms, these trends helped to boost achievement dramatically higher, especially for poor students and students of color. But in the early 2010s, these trends were most definitely headed into negative territory.
Figure 2. National current expenditures per student, fiscal years 2007–16
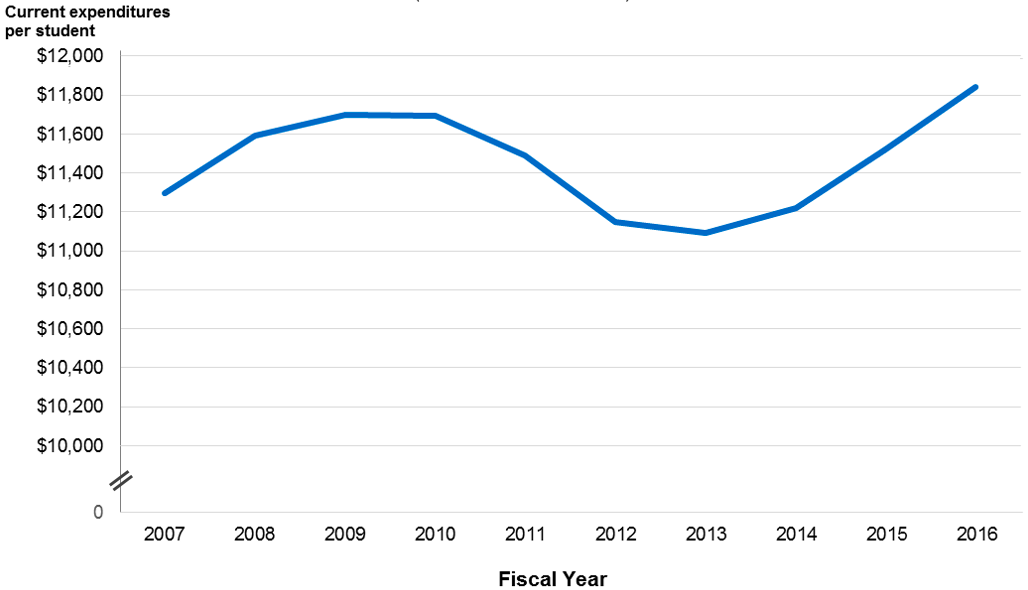
NOTE: Spending is reported in constant FY 16 dollars, based on the Consumer Price Index (CPI). SOURCE: U.S. Department of Education, National Center for Education Statistics, Common Core of Data (CCD), "National Public Education Financial Survey," fiscal years 2007 through 2016. Downloaded from: https://ies.ed.gov/blogs/nces/post/national-spending-for-public-schools-increases-for-third-consecutive-year-in-school-year-2015-16.
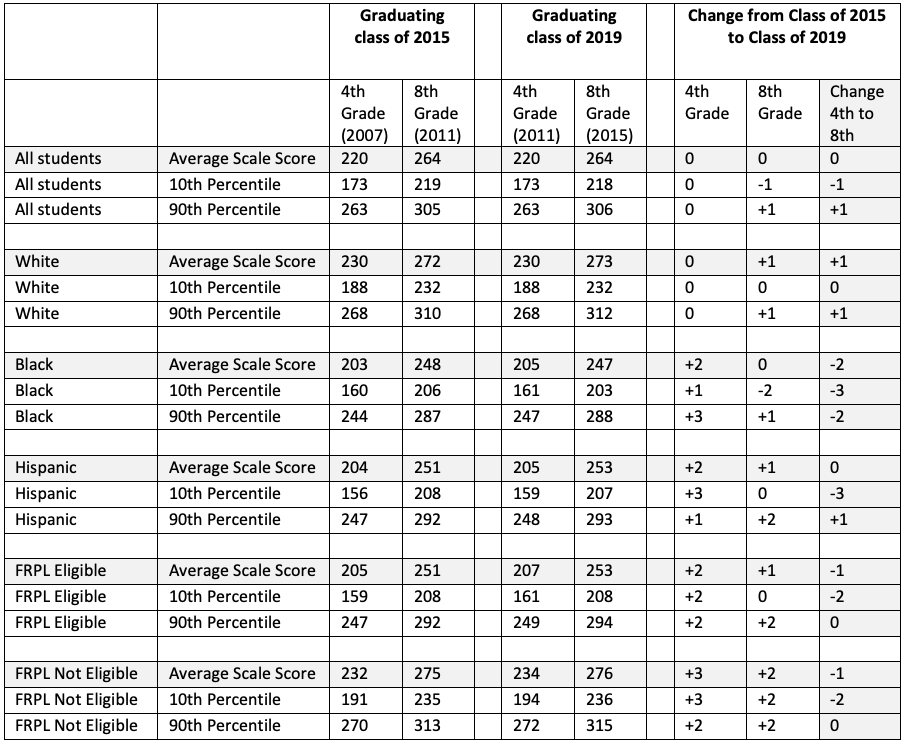
Sure enough, if we compare trends for the high school graduating class of 2019 with those for the class of 2015, we see a big slow-down between the fourth and eighth grades, especially for poor kids, kids of color, and our lowest-performing students. Indeed, the 2019 cohort made gains at the fourth-grade level versus their older peers—especially poor students and students of color. But they gave up almost all of these gains and then some by eighth grade, probably because of the tough post–Great Recession years and the big declines in school spending.
Take a look for yourself, and note in particular the trends for Black and Hispanic students, those at the 10th percentile of achievement, and those eligible for free or reduced-price lunch.
Table 1. NAEP math results for classes of 2015 and 2019, by race/ethnicity, grade, and FRPL eligibility
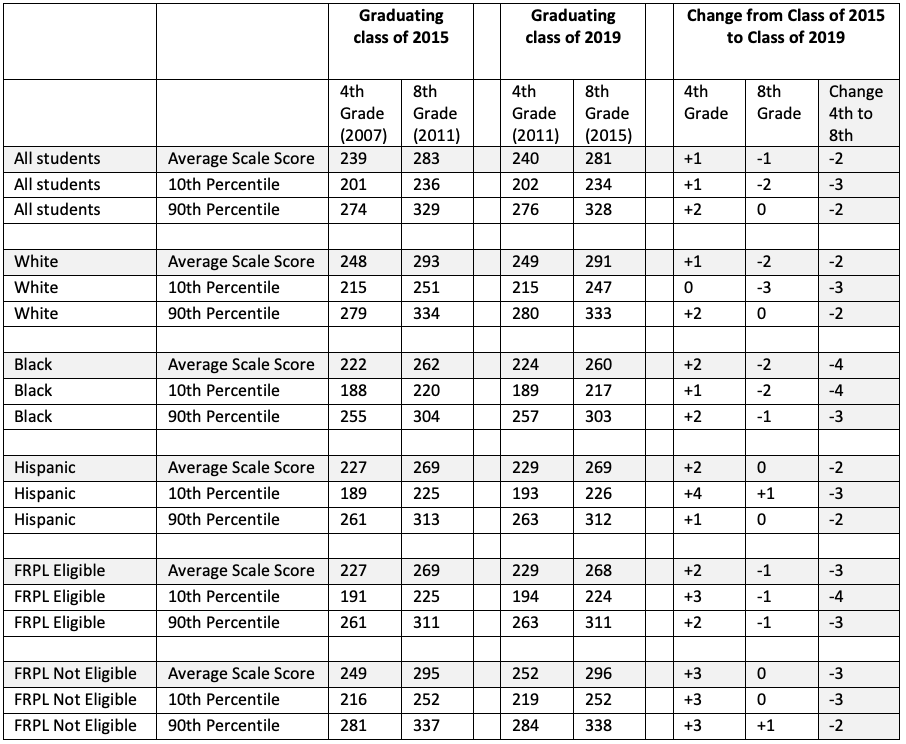
Table 2. NAEP reading results for classes of 2015 and 2019, by race/ethnicity, grade, and FRPL eligibility
So what should we expect when we see the new twelfth-grade results from 2019 this week? On the one hand, both socioeconomic conditions and school spending improved significantly during these kids’ time in high school, which might have helped to reverse the trends we see above. But it might also have been too little too late, given that students tend to make their greatest learning gains in their younger years. And if the results do disappoint, we should be careful not to assume that it’s entirely the fault of our high schools. This group of students came into ninth grade generally performing worse than their older peers, especially in math. The question is whether our high schools did anything to turn that around. And, of course, what they’re doing now for the graduating classes that follow.