The latest PISA results were mostly grim. The Program for International Student Assessment—the leading international test of fifteen-year-olds’ academic performance, given in dozens of countries around the world—showed average scores falling to their lowest levels ever in reading, math, and science. The U.S. results were better, but not by much: Reading fell again and math and science were basically flat.
But one of our focuses here at Fordham is advanced education, so what about results at the high end of the achievement spectrum? The best way to determine this on PISA is to look at students scoring at Levels 5 and 6. The Organization for Economic Cooperation and Development (OECD)—a group of 38 mostly-affluent countries that designs and administers PISA—views such test-takers as advanced performers able to go beyond routine, age-level tasks and apply what they know to complex and unfamiliar problems. It’s somewhat analogous to NAEP’s Advanced level.
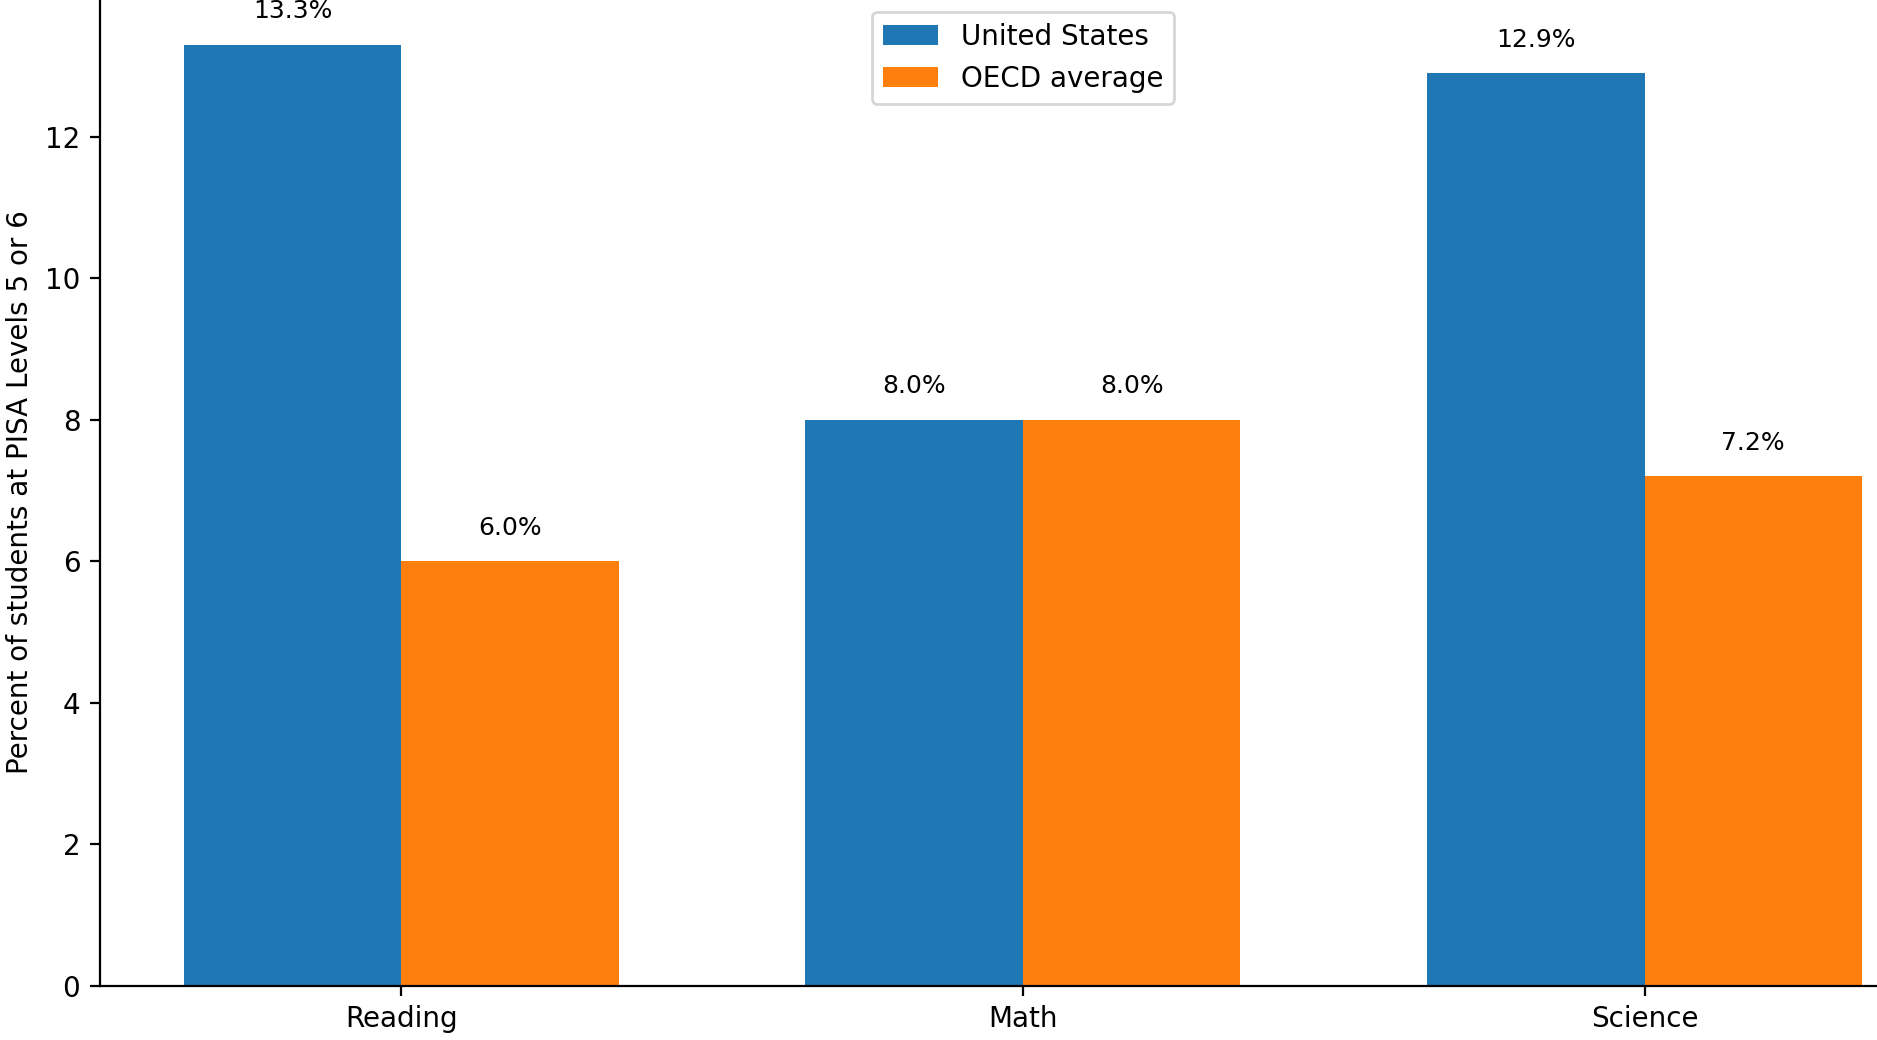
Viewed through that lens, the current American picture is brighter than most.[1] About 13 percent of U.S. students reach those levels in reading and science, compared with roughly 6 and 7 percent across the OECD, respectively. In math, the U.S. is right around the OECD average at 8 percent. See Figure 1.
Figure 1. Percent of students at PISA Levels 5 or 6 in reading, math, and science, U.S. and OECD average, 2025
Source: OECD, PISA 2025 U.S. country note.
If that snapshot is encouraging, the trends are even better, as shown in Figure 2 below. Recent NAEP results have given us some hints of this pattern. Start with reading. A decade ago, the U.S. advantage over the OECD average at the high end was just 2 percentage points. Since then, the American share of top performers has risen by more than 3 percentage points, while the OECD average has fallen by about 2. There was a small U.S. decline from 2022 to 2025, but it wasn’t statistically significant. In fact, among 89 participating countries and jurisdictions, the United States ranked 4th in students reaching those levels in the subject.
Science is relatively bright, too. In 2015, 9 percent of American test-takers reached Levels 5 or 6, statistically indistinguishable from the OECD average of 8 percent. Today, the U.S. is at 12.9 percent, compared with roughly 7 percent—and ranks 8th out of the 90 countries that took the assessment.
Then there’s math, which has long been America’s biggest weakness compared with other countries. Yet the trend here is also encouraging. In 2015, just 6 percent of U.S. students were top performers in math, versus about 10 percent across the OECD. In 2025, America’s share was 2 percentage points higher (even if, surprisingly, this jump isn’t statistically significant), while the OECD average was 2 points lower (which, conversely, is significant).
Figure 2. Percent of students at Pisa Levels 5 or 6 in reading, math, and science, U.S. and OECD average, 2015 and 2025
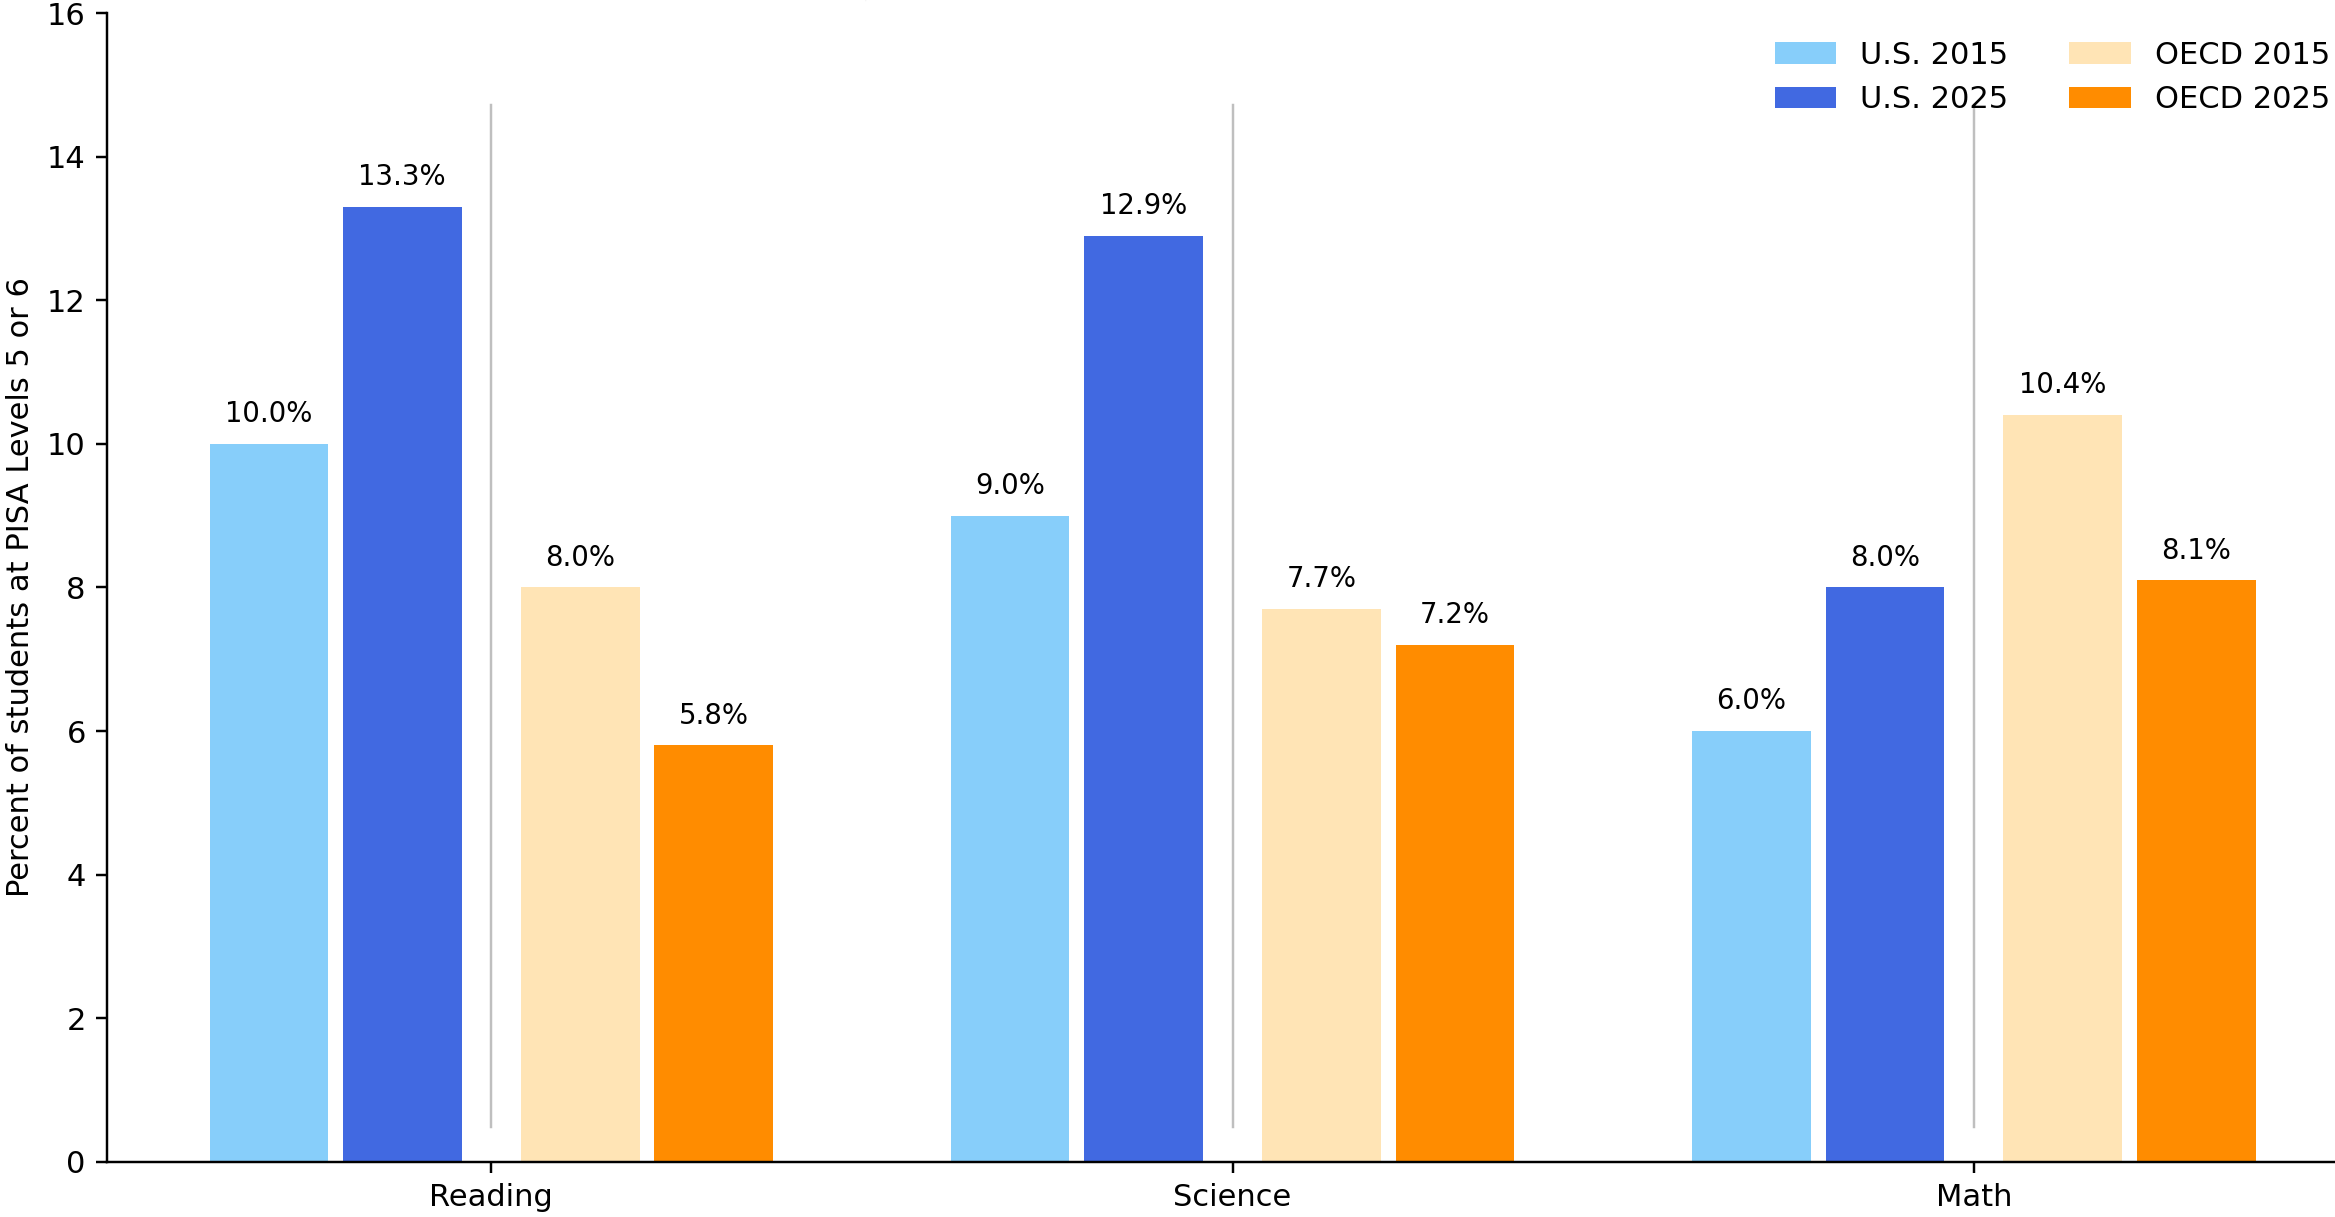
Note: The OECD data in this figure are based on 35 OECD countries with comparable data in both 2015 and 2025. Source: OECD, PISA 2015 and 2025 results.
This is all good news, full stop. But it shouldn’t be oversold, and nobody should over-indulge in champagne. In each of the three subjects, countries perform better than the United States, especially in math. In 2025, for example, 37 percent of students in Singapore reached Levels 5 or 6 in math, compared to America’s 8 percent; in Korea, it was 23 percent; and in Japan, 22 percent. In other words, the U.S. still produces advanced math students at nowhere near the rate of the world leaders, even if our comparatively large population still produces a substantial absolute number of top performers.
Nor should any of this distract from the country’s shortcomings at other achievement levels. In 2025, more than one in three American test takers scored below PISA’s Level 2, its baseline proficiency bar, in math, as did about one in four in reading and more than one in five in science. Those numbers are especially sobering considering the strong U.S. performance at the high end. In fact, the United States has the largest gap between its 90th- and 10th-percentile students in reading and the second largest in science.
Still, the good news at the top suggests that the country is capable of producing a lot of very advanced students. It also suggests that America, again with its large population, has a substantial reservoir of academic talent, periodic cries of disastrous brain drain notwithstanding. In reading and science, the shares of top performers have risen and are now among the highest in the world. And although the U.S. still lags far behind the strongest nations in our rate of advanced math achievement, we did improve over the last decade while the OECD average dropped.
That leaves us with a more complicated—and more positive—picture than many PISA headlines painted. Yes, America has serious achievement problems. But there’s also a lot of good news at the high end. That surprised me, and I’m guessing it will surprise readers, too.
[1] Readers should note an important caveat about U.S. results: The United States fell short of several PISA sampling standards for school and student participation. As a result, the OECD can’t rule out bias due to nonresponses or determine whether such a bias raised or lowered results and, therefore, rankings. To compensate for this, the OECD used preselected replacement schools and reweighted the sample. After doing this, the participating and nonparticipating groups looked demographically similar. Still, readers should interpret U.S. results and rankings with some caution.