

School Funding
Ohio still hasn’t solved its chronic absenteeism problem
Last week, the Ohio Department of Education and Workforce (DEW) released updated report cards for the 2024–25 school year. Overall, the results are troubling.
Last week, the Ohio Department of Education and Workforce (DEW) released updated report cards for the 2024–25 school year. Overall, the results are troubling.

Last week, the Ohio Department of Education and Workforce (DEW) released updated report cards for the 2024–25 school year. Overall, the results are troubling. Early literacy numbers are disappointing. Reading proficiency rates dipped down. Statewide math proficiency crept up but still sits at just 55 percent. And in the majority of urban districts, overall proficiency rates are alarmingly low.
Clearly, there’s work to be done. But Ohio’s issues extend beyond academics. Chronic absenteeism, which is defined as missing at least 10 percent of instructional time for any reason, can negatively impact both academic and social-emotional development. And according to state report cards, a fourth of Ohio students—roughly 400,000 kids—were chronically absent last year.
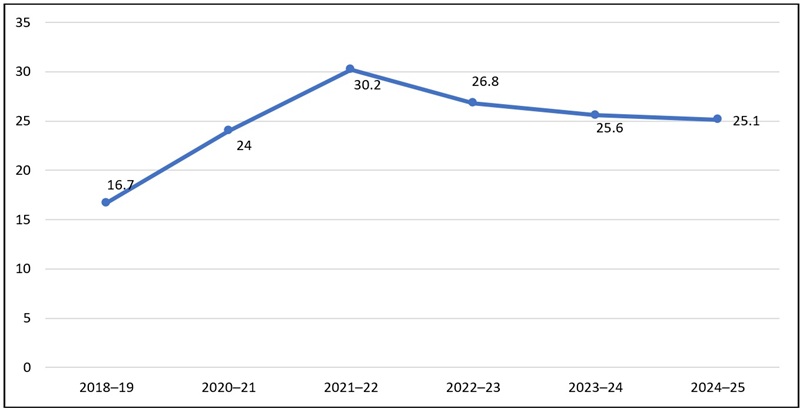
Figure 1 displays Ohio’s statewide chronic absenteeism rate over time. In 2018–19, it was just shy of 17 percent. But by 2021–22 it had jumped to 30 percent, as the number of students who were chronically absent skyrocketed during pandemic-era disruptions. Ohio’s rate ticked down to 27 percent the following year, which many hoped would be the start of a significant downward trend. But the last two years have dashed those hopes. The statewide rate was 25.6 percent in 2023–24 and 25.1 percent in 2024–25. That’s an improvement of fewer than 2 percentage points over the course of two years.
Figure 1. Statewide chronic absenteeism rate, 2018–2025
The statewide rate obscures even worse numbers at the local level. Table 1 identifies nine districts that registered chronic absenteeism rates above 50 percent during the 2024–25 school year. The highest rate was in Lorain (which also happened to post the state’s lowest performance index score), followed by Youngstown and North College Hill near Cincinnati. More than half of students in Cleveland and Columbus were also chronically absent last year. Rates from the 2023–24 school year have been included for comparison. The final column shows the year-to-year difference, with green shading indicating a decline in the district’s chronic absenteeism rate and red shading indicating a rise.
Table 1. Districts with chronic absenteeism rates above 50 percent in 2024–25

From a year-to-year perspective, it’s not all bad news. East Cleveland, which dropped its chronic absenteeism rate from an eye-popping 63.5 down to 53.2, is a welcome bright spot. That’s a decline of more than 10 percentage points and, along with some impressive academic improvements, signals that things are looking up in East Cleveland. Lockland Local also registered a sizable decline of 5.3 percentage points. But four other districts saw their rates jump. North College Hill had an increase of 5.1 percentage points and Cleveland went up by 4.2 percentage points.
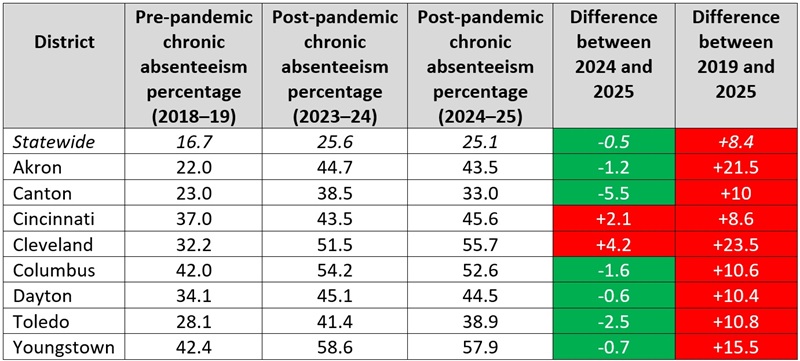
Chronic absenteeism is a problem for all schools. But it’s especially troublesome in districts where large numbers of students are academically behind. Table 2 identifies the pre- and post-pandemic chronic absenteeism rates in the Ohio Eight, a group of eight urban districts with a long history of academic struggles, as well as the statewide average. The final column identifies the difference between pre-pandemic rates in 2019 and the most recent post-pandemic percentage in 2025.
Table 2. Pre- and post-pandemic chronic absenteeism rates in the Ohio Eight districts
These data answer several important questions about progress (or lack thereof) in the Ohio Eight.
First, how are districts faring overall? Not well. At least a third of students are chronically absent in each one. Three of them—Cleveland, Columbus, and Youngstown—have rates above 50 percent. And they’re all well above the statewide average, with the gap ranging from 7.9 percentage points in Canton to a whopping 32.8 in Youngstown. Youngstown’s sky-high numbers are particularly noteworthy because, although the district technically improved between 2024 and 2025, it was by less than 1 percentage point. Not only is Youngstown’s 2025 rate the worst among the Ohio Eight, it’s the second worst in the entire state.
Second, did chronic absenteeism rates decline during the most recent school year? In six of the eight districts, the answer is yes. Only Cincinnati and Cleveland registered higher percentages in 2025 than 2024. Canton saw the biggest improvement, with a decline of 5.5 percentage points, followed by Toledo with a drop of 2.5. The four remaining districts clocked in with improvements below 2 percentage points.
Third, after several years of fully in-person classes, have districts bounced back to pre-pandemic levels? No. Not even close. Five of them have a gap of roughly 10 percentage points between their 2019 and 2025 rates. Another two—Akron and Cleveland—have appallingly large discrepancies of more than 20 percentage points. And while Cincinnati was one of two districts to see an increase in its 2025 rate, it’s also the district with the smallest gap—8.6 percentage points—between current and pre-pandemic numbers.
Overall, these data paint a depressing picture. The needle has barely moved at the state level. And in some districts, chronic absenteeism has actually gotten worse. State leaders have tried to address the issue with pledges and taskforce recommendations and toolkits. But if those efforts are having an impact, it’s still not visible on state report cards.
Part of the problem is that state report cards only come out once a year, which means Ohio publicly updates absenteeism rates just once a year. Now that last year’s numbers have been published, we’re all pretty much in the dark until next September. Given the sizable impact chronic absenteeism can have on short- and long-term student outcomes—and Ohio’s troubling academic results on this year’s report cards—annual data dumps aren’t going to cut it.
For a better alternative, Ohio could look to Rhode Island, where leaders have created several publicly available, interactive tools. For example, the state’s real-time attendance dashboards update daily to show attendance trends in individual schools, along with data on early dismissals and tardies (both of which can have a sneakily big impact on chronic absenteeism). Ohio could create its own version of these dashboards to give local officials, district and school leaders, and families consistent access to detailed data that they can act on immediately instead of waiting and hoping that next year’s numbers are better.
State-level policy alone won’t solve Ohio’s chronic absenteeism problem. In fact, boosting attendance is largely in the hands of local leaders, schools, and community members, as they’re the ones who are trusted by parents and regularly interact with kids. But state leaders can support local efforts with real-time data. Here’s hoping they choose to do so quickly.

Charter schools are independently-run, public, open-to-all, tuition-free schools that serve thousands of students across Ohio. Their ranks include a variety of educational models such as no-excuses, classical education, and arts-themed schools, as well as schools that serve students with special needs. Most are located in urban communities and serve predominately low-income and minority students. Research studies show that Ohio’s brick-and-mortar charters outperformed nearby districts just prior to the pandemic and immediately after.
This post examines the most recent round of school report card data to gauge Ohio charter performance in 2024–25. Spoiler alert: Urban charters once again outperformed their local districts. The question ahead may no longer be whether charters can beat district schools down the street—they’ve proven as much—but whether they can narrow the achievement gap and dramatically increase the number of students achieving proficiency. It’s a tall task, no doubt. But as discussed in the conclusion, there are ways that state and local leaders could propel Ohio charters to the next level.
Charter school performance in 2024–25
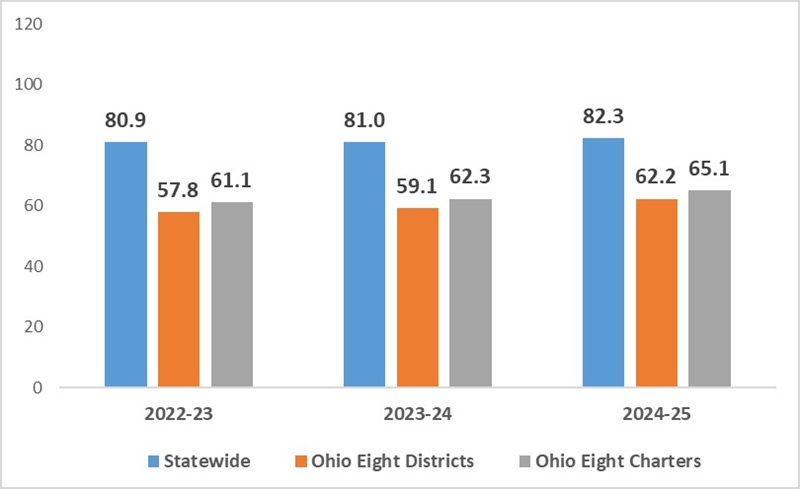
Let us first begin with a look at student achievement numbers, as measured by the state’s performance index. This is a weighted measure of proficiency on state exams, which awards schools more credit when students score at higher performance levels. Figure 1 reveals that, as a whole, urban charter schools located in the Ohio Eight[1] outperformed their district counterparts on the performance index: In 2024–25, the charter school average score was 65.1 versus 62.2 for districts. This is the third straight year urban charters outperformed districts on this measure. Compared to the statewide average, however, charter and district performance fell substantially behind, reflecting chronic achievement gaps between urban students typically from disadvantaged backgrounds and their more affluent peers.
Figure 1: Urban charter versus district school performance index scores, 2022–23 to 2024–25
Following a similar pattern as last year, student achievement among charters in Cleveland, Columbus, Dayton, Toledo, and Youngstown outpaced district results while charter achievement in Akron, Canton, and Cincinnati lagged behind.
Table 1. Ohio Eight district-charter comparisons, performance index scores, 2024–25

The performance index provides an important point-in-time snapshot of where students stand academically. But it’s also influenced heavily by demographics, which may obscure the true educational impacts of districts and schools. Here, the state’s value-added growth measure (a.k.a. Progress) helps us understand whether schools are improving achievement over time regardless of where students begin the year. In turn, these ratings provide a clearer picture of schools’ effectiveness without being unduly influenced by demographics.
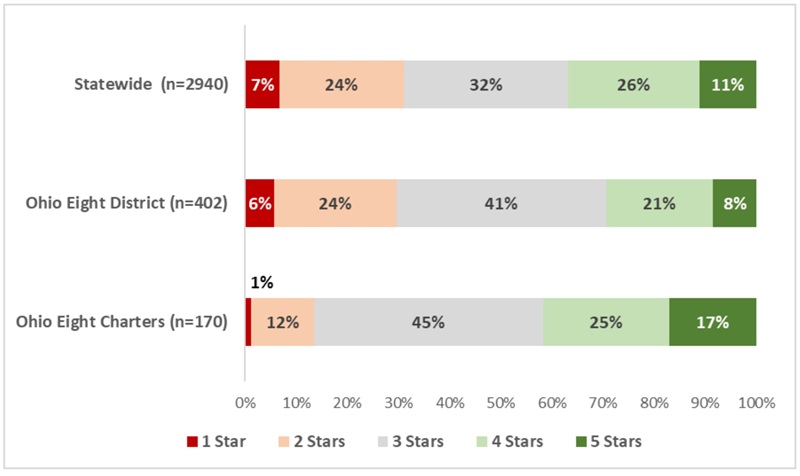
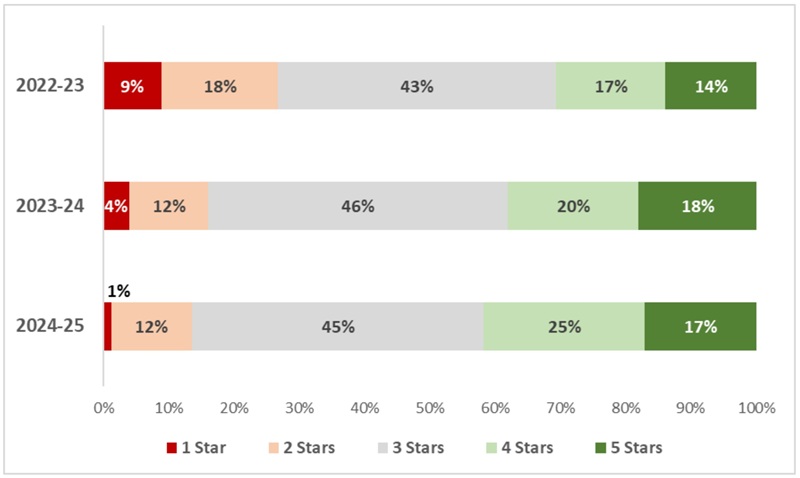
On this measure, Ohio’s urban charters also demonstrate superior performance. Of the state’s 170 urban charters, 17 percent earned five-star Progress ratings and another 25 percent received four-stars. These percentages outpaced urban district schools and statewide performance on this measure. At the other end of the spectrum, we see fewer urban charters receiving one- and two-star ratings than their district counterparts.
Figure 2: Urban charter versus district school Progress ratings, 2024–25
When comparing urban charters’ recent performance on value-added, we find signs of improvement there as well. In the 2022–23 school year, 31 percent of Ohio’s urban charters received four- or five-star Progress ratings. By 2024–25, 42 percent of urban charters did so.
Figure 3: Ohio Eight urban charter school Progress ratings, 2022-23 to 2024-25
Can Ohio’s urban charters take it to another level?
Charter school advocates should be heartened by these results. They show that urban charters continue to provide families with higher-quality options than big-city districts do. They also reveal signs of sector improvement on both achievement and growth measures. But with proficiency still falling well below the statewide average, Ohio charters still have plenty of work to do. Can they take it to another level, one in which the average charter student achieves on par with students statewide? It’ll be a big lift, but the work can be lightened with many hands. Let us consider a few ways that local and state leaders could give urban charters another boost.
How local leaders can support charters: Despite their well-documented success, charters often receive little to no support from local policymakers, who tend to favor district-run schools instead. While changing the minds (or composition) of elected school boards is likely a pipe dream, mayors, city council members, county commissioners, and philanthropy and business leaders, could more easily advocate for charters. These local leaders are supposed to represent all citizens in their communities, including the sizeable share of parents and students who choose charter schools.
How to advocate on behalf of charters? Here are six ways:
How state leaders can support charters: State policymakers on both sides of the aisle have strong reasons to support public charter schools. Conservative policymakers see charters as a way to empower Ohio families with more educational choice, and as a market-oriented solution that enhances competition in an otherwise district-monopolized system. Progressives, too, can get on board, given the preponderance of evidence that charter schools effectively educate Ohio’s most disadvantaged students, whom they have historically stood up for and often represent. And no matter the partisan allegiances, all lawmakers can agree that every Ohio student deserves a good education, something that charter schools have proven they can provide.
What might a bipartisan effort to boost charters look like? For starters, state leaders should fully bridge the persistent funding gaps that have held back charters’ ability to serve more students. Additional state aid (or alternatively, requiring local dollars to follow children) could push high-performing charters further up the ranks while also helping other charters move from good to great. Alongside equitable funding, state leaders should also maintain the strict accountability measures that helped turnaround Ohio’s charter sector. This means maintaining the pressure on charter sponsors to authorize effective charter schools, continuing to close chronically poor performers, and implementing state interventions in charter (and district) schools that are underperforming. Overall, equitable funding paired with forceful accountability from the state is a winning formula that can keep charters moving in the right direction.
This year’s report card shows again that Ohio’s urban charter schools are providing families with quality options. With ramped up support from local and state leadership, charters will be poised to compete not only with their local districts, but also with the finest schools in Ohio.
[1] The Ohio Eight refers to Akron, Canton, Cincinnati, Cleveland, Columbus, Dayton, Toledo, and Youngstown. A large majority of Ohio charters operate in these cities.

It’s been a little over two years since Ohio policymakers established a statewide initiative championing the science of reading, an evidence-based instructional approach that focuses on phonics and knowledge-building. Under this policy, public schools are required to use state-approved high-quality instructional materials (HQIM) and teachers and administrators must complete professional development. The state budget passed just a few months ago built on these efforts by continuing to fund literacy coaches and requiring the Department of Education and Workforce (DEW) to maintain and expand its professional development offerings.
Here at Fordham, we’ve been keeping a close eye on a variety of success indicators to track the progress of this sweeping effort. Recently released state report cards for the 2024–25 school year offer our first in-depth look at student achievement under these policies. But before we dig into the data, here are some important reminders about why it’s far too early to make any sweeping judgments.
First, this initiative is a huge undertaking. And as the saying goes, Rome wasn’t built in a day. Progress (or lack thereof) during the first official year of implementation shouldn’t be used to judge the success or failure of such a complex policy. The science of reading is a long-term investment in our schools and students’ futures, and patience—combined with a strong sense of urgency—is required. Remember also that a one-year change in proficiency rates doesn’t make for a trend. We won’t be able to understand the true impacts of this effort until we have a few more years of data.
Second, the science of reading largely focuses on Ohio’s youngest learners. The students who will benefit from these changes are currently in preschool, kindergarten, and first grade—but state testing doesn’t begin until third. Ohio’s “improving K–3 literacy” measure sheds some light on growth among early elementary students (more on that below), but for the most part, report card data won’t include impacted students for another few years.
Third, the 2024–25 school year was one of transition, during which plenty of districts were still working out science of reading implementation kinks. For example, according to a report given by DEW officials at a public meeting this summer, 82 percent of districts reported that they were fully aligned to the state’s HQIM expectations by June 15. That means one in every five weren’t fully aligned. (To its credit, DEW plans to audit districts and schools this year to verify their alignment.) Professional development is similar. State lawmakers required all current educators to complete a professional development course in the science of reading, but the deadline wasn’t until June 30, 2025. In other words, although science of reading implementation officially began last year, in reality, it was more of a transition period.
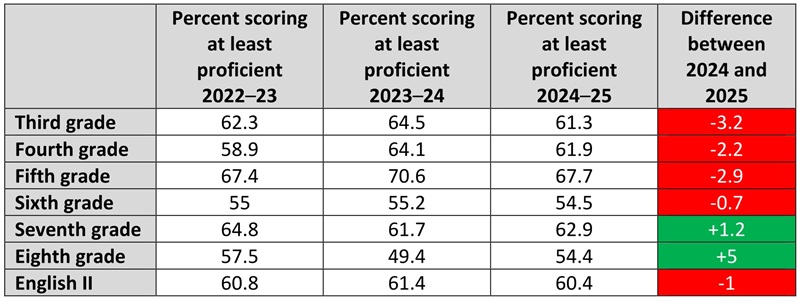
Even with these caveats, it’s crucial to closely examine report card data. To begin, let’s take a look at statewide results. Chart 1 shows the number of students who scored proficient or above on the state’s English language arts exams. In the final column, which identifies the difference between 2024 and 2025 results, green shading indicates improvement and red indicates a decline. Only two grades—seventh and eighth—saw an increase in the percentage of students who scored at least proficient. Every other grade saw a decrease, with the steepest drop coming for third graders.
Chart 1. Percentage of students scoring at least proficient on English language arts state tests
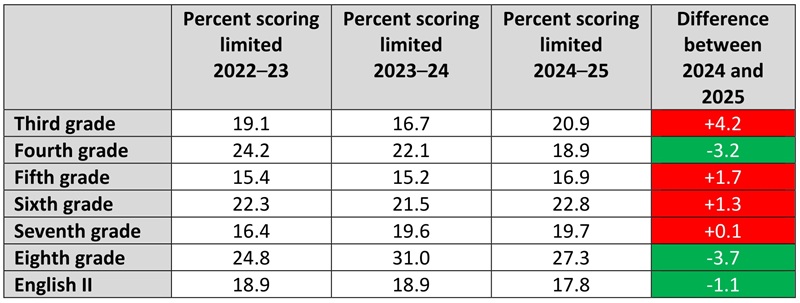
Tracking proficiency numbers will help state leaders measure progress. But identifying how many students score in the lowest achievement level, or “limited,” is also crucial, as declining numbers there would indicate progress as well. Chart 2 identifies the number of students in grades 3–8 and high school who scored limited during the last three school years. The final column identifies the difference between 2024 and 2025 results, with green shading indicating improvement (fewer students scoring limited) and red shading indicating a regression (more students scoring limited). Unfortunately, only three grade levels—fourth, eighth, and the high school English II exam—registered fewer limited scorers than the prior year. Every other grade saw an increase. The highest jump in limited scorers was in third grade, with an increase of more than 4 percentage points. Together, the data in charts 1 and 2 paint a worrisome picture for the make-or-break year of third grade, as fewer students scored proficient and more scored limited.
Chart 2. Percentage of students scoring limited on English language arts state tests
Given that Ohio’s science of reading effort is a statewide initiative, it’s important to track statewide results. But state numbers can mask improvement (or lack thereof) in individual districts. The report card’s early literacy component allows us to dig deeper. For the sake of narrowed focus, let’s consider results from the Ohio Eight, a group of eight urban districts with a long history of poor performance. We’ll also add Lorain and East Cleveland to the mix, since they spent several years under the oversight of now-defanged Academic Distress Commissions. (So did Youngstown, which is one of the Ohio Eight.) Together, these ten districts serve nearly 187,000 students—more than a tenth of the state’s public-school population—and are among those most in need of early literacy improvement.
First, let’s look at how they performed overall on the early literacy component. Chart 3 displays two data points—districts’ star ratings on the component and the weighted percentage that determined those ratings. This percentage is based on three measures: third-grade reading proficiency rates, third-to-fourth grade promotional rates, and the percentage of off-track readers who move to on-track status in the following year. Districts with a weighted component percent of less than 58 earned one out of five stars while those with a weighted component percent from 58 to less than 68 earned two stars. In the columns dedicated to the most recent school year, green shading indicates improvement from the prior year, yellow indicates results that remained flat, and red indicates a decline.
Chart 3. Overall early literacy results on state report cards in selected districts
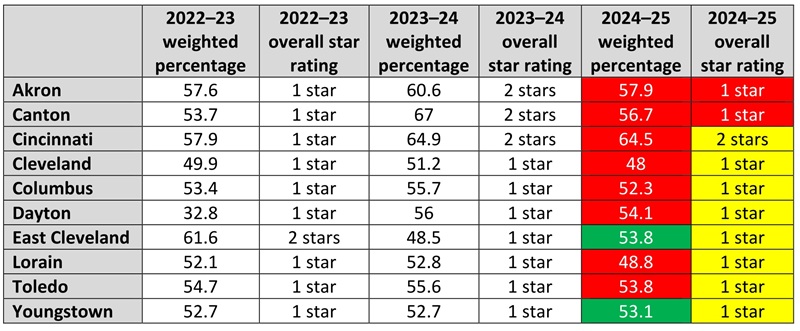
Cincinnati was the highest performer of these districts and the only one to earn two stars. Its weighted percentage did decline between 2024 and 2025, but the drop was small enough that it did not impact its rating. The lowest performers were Cleveland, which earned a weighted percentage of 48, and Lorain, with a 48.8. Just two districts earned a higher weighted percentage than they did the prior year: East Cleveland and Youngstown. East Cleveland improved by 5.3 percentage points, while Youngstown eked out a gain of less than half a percentage point.
Next, let’s take a closer look at one of the early literacy component’s three measures: third grade reading proficiency. Chart 4 displays the percentage of students who scored proficient on the reading segment of the ELA exam, as well as the statewide third grade proficiency average.[1] The final column identifies improvement between 2024 and 2025 with green shading and a decline with red.
Chart 4. Percentage of third graders scoring proficient on the reading segment of state ELA exam in selected districts
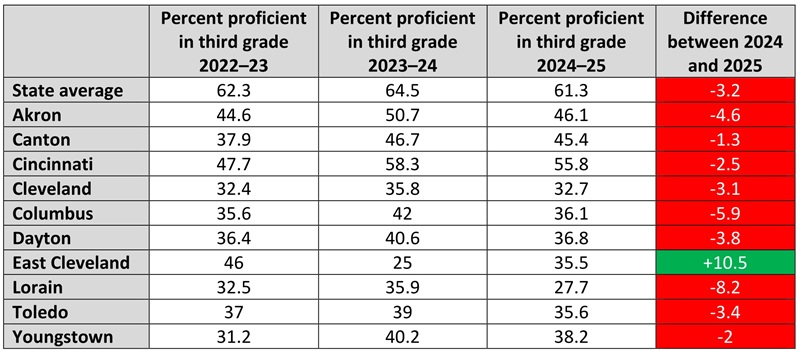
The only district that improved was East Cleveland, with a sizable jump of more than 10 percentage points. Considering East Cleveland had the worst proficiency rate of these districts in 2024—an abysmal 25 percent—that’s good news. Meanwhile, in the nine districts that regressed, the decline ranged from 1.3 percentage points in Canton to a whopping 8.2 percentage points in Lorain. That puts Lorain’s third grade proficiency rate at just under 28 percent, making it the only district in the group where fewer than a third of third graders were proficient (although Cleveland, the next lowest performer, only meets that threshold via rounding). It’s also worth noting that almost all of these districts are considerably behind the state average, with the difference ranging from 15.2 to 33.6 percentage points. Cincinnati had the smallest gap and is just 5.5 percentage points behind the state average.
Lastly, let’s take a look at progress. DEW tracks district progress via the “improving K–3 literacy” measure, which uses the results of fall diagnostic assessments to determine the percentage of students who move from “not on track” to “on track” in reading from one year to the next. These results indicate how well schools are improving K–3 literacy throughout all the early grades, not just third. By doing so, the measure identifies schools and districts that are making critical progress with struggling readers. Chart 5 displays the overall percentage of students that each district moved to on track in reading during the three most recent school years, as well as the difference between 2024 and 2025 results, with green shading indicating improvement and red a decline. Canton, which is shaded in yellow, is a unique case, as its kindergarten data for the 2023–24 school year were misstated on its report card.
Chart 5. Results for the improving K–3 literacy measure on state report cards in selected districts
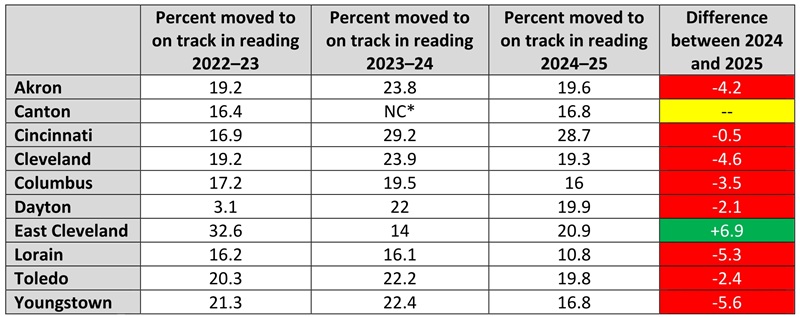
Unfortunately, there’s very little progress to celebrate. Only one district—East Cleveland—showed improvement. But it did so with a sizable jump of nearly 7 percentage points that catapulted it from the worst of these districts in 2024 to second among them in 2025. There’s still a lot of work to be done, but improved results in both progress and proficiency should be welcome news in East Cleveland.
The other nine districts didn’t fare as well. The percentage of students who were moved to on track in reading declined across the board, with drops ranging from half a percentage point in Cincinnati to 5.3 percentage points in Lorain. The decline in Lorain means the district managed to move just 10 percent of its students to on track in reading. That’s not just the lowest percentage among these districts, it’s the lowest in the entire state. Lorain’s third grade proficiency rate, meanwhile, was the second lowest in the state. Such abysmal numbers should prompt some pointed questions for lawmakers, who voted to give the district a free pass by dissolving its Academic Distress Commission and its state-mandated academic improvement plan. Clearly, Lorain hasn’t improved much in terms of early literacy. In fact, the district is moving backwards.
***
This latest round of state report cards clearly demonstrate that Ohio districts and schools have their work cut out for them when it comes to boosting reading outcomes. But with the state’s science of reading initiative, they have evidence-based tools that should help over the long haul. Now that last year’s transition period is in the rearview, it’s time to look ahead—and put the pedal to the metal!
[1] The statewide results are for the entire third grade English language arts exam, which includes writing, and not just the reading segment.
The new school year got underway with some familiar speedbumps for student transportation in a number of cities and suburbs. These kinds of troubles are nothing new, but they seem to be on the rise. That’s a problem because getting eligible students to and from school safely, efficiently, and on time is a basic function of the system. In that spirit, new survey data from the Associated Press-NORC Center for Public Affairs Research are timely and interesting (despite the potential conflict of interest stemming from their partnership in the effort with “supplemental” transportation provider HopSkipDrive.)
Data come from two separate surveys. The first was conducted with a random sample of 838 parents of school-aged children, recruited via AP’s AmeriSpeak platform and designed to be representative of the U.S. household population. It was administered online between June 30 and July 11, 2025, and included demographic information about respondents. The second was a group of 510 school administrators recruited via survey company Dynata. There is no further information available about these administrators—location, school type, school size, longevity, etc.—except their job. Their surveys were conducted between June 30 and July 25, 2025.
The most important thing to note is that a majority of parents report providing their own transportation for some or all of their school-aged children. (The survey allowed for multiple responses to the question, thus percentages that add up to more than 100.) Sixty-three percent report driving a child themselves to and from school on a typical day; 33 percent report another family member or friend driving their child; and 5 percent say they use a multi-family carpool. Walking, biking, older students driving themselves, and rideshare use are also reported. Black parents are more likely to drive their children to school than White parents (71 percent versus 58 percent). For those providing their own transportation typically, 32 percent say they do so because no school-based transportation is available to them, 20 percent because it’s easier than availing themselves of school-based options, and 14 percent because of general safety concerns. For families whose students participate in extracurricular activities or before or after school care, school-provided transportation is even less typical. Only 17 percent report using a school bus or other school-arranged vehicle for those activities.
On the other side of the ledger, 43 percent of parents report using a school bus or other school-arranged vehicle on a typical day for at least one of their children. Three percent report using public transportation, but there are no details provided about whether those trips are paid for by the school/district or are self-funded. The vast majority of parents believe that school bus travel is safe—far safer than walking, taking public transportation, or hiring a rideshare—whether they use buses or not.
Interestingly, parents seem quite happy with the transportation plans they have arranged, regardless of type, reporting minimal stress over daily transportation and only rare conflicts between school transportation issues and their own work and personal schedules. Only a tiny fraction of parents report that their student has ever missed school services, tutoring, or field trips due to transportation issues. Even the school choice question—“How likely would you be to send your child to a different school if easier transportation options were available?”—finds few potential takers, with 72 percent saying they are not too likely or not at all likely to switch schools in that case.
Turning to the other survey, the overwhelming message from school administrators is that their current transportation systems are inadequate to the need. Forty-five percent of administrators report that all students in their districts and schools are eligible for school-provided transportation, with lower percentages reporting specific subgroups of students being eligible, such as students with special needs or those experiencing homelessness. (Again, multiple answers were allowed, rendering the eligibility data unhelpfully murky.) And even though large percentages of parents report not using available school-provided options, as found by the other survey, 44 percent of school administrators in this survey say that the number of students eligible for transportation has increased in the last five years. Bus driver shortages, budget reductions (or simply a lack of budget increases), and traffic congestion around schools are all cited as major or minor problems related to transportation. (One assumes the latter is due to all those family vehicles dropping kids off!) Eighty-three percent of administrators report office staffers have had to take on transportation duties in the last year, with 54 percent saying such gap-filling happens on at least a weekly basis. Administrators express concerns over absenteeism, academic outcomes, and providing services for specific subgroups of students due to sub-optimal transportation.
As to solutions: 55 percent of administrators report raising driver pay or benefits to help boost recruitment, 26 percent report cutting or shortening routes to spread out available drivers, 20 percent report changing school day start or end times so drivers could double up, and 13 percent report canceling transportation services for groups of students (such as high schoolers) if it is not mandated by state or local law. The survey also offers several other potential policy changes related to transportation—including creating centralized drop-off and pick-up points and having schools arrange alternatives like cars or vans when traditional buses are unavailable/not tenable—all of which the majority of administrator respondents expressed favor for.
The report offers neither recommendations nor analysis of the survey results. But if I may be so bold, it seems as though parents and school administrators may be on two different pages when it comes to transportation. While administrators are stressing about what can’t be provided to all eligible students—and what might happen as this increasingly becomes the case—families are far more chill about what they provide for their own kids. If a majority of families are providing their own door-to-door transportation at least twice a day (and experiencing little or no scheduling problems to speak of), nothing less than that level of service would likely change their habit if it were offered by their schools. And since that halcyon scenario is unlikely to return, short of miraculous changes to bring an influx of new drivers, these findings indicate that school leaders are fretting unnecessarily on the topic.
With continued enrollment declines, the ongoing expansion of school choice (a topic not explored enough in either of these surveys), and a majority of parents already moved on from the old yellow bus model (maybe because of the rise of work-from-home arrangements) perhaps policymakers can finally accept reality as reflected in these surveys and give their beleaguered school administrators a break: Scrap the tattered vestiges of traditional, universal, district-centered busing; start building new, community-centric models that focus on the neediest students first; pay families who provide transportation on their own; and only after those steps are accomplished, worry about wooing back the hardcore carpool moms, dads, and grandmas.
SOURCE: AP-NORC Center for Public Affairs Research, “2025 State of School Transportation Report” (September 2025).

The teacher pipeline concerns currently being debated in the media are not new. They’re merely the most recent iteration of a slow-burning problem that has become more acute since Covid school closures upended K–12 education. One suggestion for boosting the number and diversity of new teachers is to relax licensing requirements. It’s no secret that these can be onerous, expensive, and time-consuming enough to deter or derail many potential candidates. Relaxing them has been tried before, but not without concerns of lowered teacher quality. New research shows interesting results for one such effort that could be instructive going forward.
Fearing incipient educator shortages more than 30 years ago, and with the only extant alternative being to fill pressing vacancies with uncertified teachers via emergency permits, Texas passed a law in 1999 designed to promote flexibility in teacher preparation pathways. This was meant to boost the number of certified candidates available for hire and gave the State Board for Educator Certification (SBEC) authority to establish alternative routes to certification beyond typical four-year college degrees, district-run programs, and the like, which had been the longstanding means for training and certifying teachers in the Lone Star State. In carrying out this authority, SBEC in 2001 scrapped the requirement that preparation programs include student teaching. This opened the floodgates for alternative programs (including those run by non-profit and for-profit companies) that certified candidates’ classroom readiness via course grades and test scores only. Traditional programs remained, well, traditional.
Such alternatives are faster and cheaper than completing a traditional four-year degree with additional student teaching requirements. But do they produce more candidates? Do they reduce reliance on wholly uncertified placeholders? And how good are the teachers thus certified?
To dig into those questions, researchers Christa Deneault of the Federal Reserve Bank of Dallas and Evan Riehl from Cornell University examined detailed datasets that include measures of worker supply and quality. Sources include the Texas Education Agency, SBEC, and the Texas Higher Education Coordinating Board. Data include all teacher certifications, all public school employees, and all public school students enrolled in the state from 1996–2019, along with demographics and value-added data for math and English language arts tests in grades 4–8.
They find that the plan achieved its primary goal admirably and quickly. The total number of initial certifications—i.e., individuals receiving their first teaching certificate—rose from roughly 14,000 in 2000 to 28,000 by 2007, driven in large measure by those attaining alternative program certification. Growth flattened after that but alternative pathways continued to produce 50 percent or more of all new teacher certifications through the end of the study period in 2020.
The multiple upsides to this hiring bounty include decreased reliance on uncertified teachers (by a whopping 25 percentage points between 2000 and 2010) and diversification of the teaching corps. To wit: Teachers certified through alternative pathways were more diverse than their traditionally-certified counterparts—16 percentage points more likely to be male and 8 percentage points less likely to be white. Eighty-five percent of teachers from traditional programs majored in just two academic fields in college (interdisciplinary and humanities studies). By comparison, alternatively-trained teachers were more likely to have degrees in business, communications, social sciences, and STEM subjects. In other words, they were more representative of college graduates as a whole and somewhat better aligned with the subjects that K–12 schools teach. Additionally, a majority of traditionally-trained teachers who were hired ended up in elementary schools, while teachers from alternative programs were more likely to teach—and displace uncertified teachers—at harder-to-staff middle and high school grades.
Teacher turnover rates—a proxy for teacher quality, as excessive turnover has been linked to negative impacts on student achievement—are largely similar for both groups of certified teachers, with about 70 percent of new hires still teaching after five years, regardless of how they got certified. Alternatively-certified ELA and math teachers produced modestly lower (but still statistically-significant) value-added scores in both subjects. Teachers certified through for-profit alternative programs scored lower on all measured outcomes compared to their non-profit alt-cert peers, but uncertified teachers were lowest of all on every measure. They were most likely to leave the profession within five years and had the worst value-added scores of any other subgroup.
Deneault and Riehl conclude that allowing alternative-certification programs—for-profit and non-profit alike—achieved Texas policymakers’ goal of filling educator vacancies, even though the new hires were of somewhat lower quality than traditionally-certified teachers. Interestingly, they consider “reducing schools’ reliance on uncertified teachers with even worse outcomes” to be a “net zero” impact on students, when it likely should be seen as a positive result. Without them, the ranks of uncertified—and even-lower-quality—placeholders would surely have grown. And an accurate, documented perspective seems especially important now, since history seems to be repeating in Texas, where a resurgence in the hiring of uncertified teachers, supercharged by post-pandemic hiring incentives, has resulted in a predictable academic downturn. That, in turn, has moved the state legislature to eliminate the use of uncertified educators once and for all by 2029. The next phase is unpredictable, but at least the researchers will be watching.
SOURCE: Christa Deneault and Evan Riehl, “Should States Reduce Teacher Licensing Requirements? Evidence from the Rise of For-Profit Training Programs in Texas,” NBER Working Paper (September 2025).