Mobile Navigation

  • National
    • Policy
      • High Expectations
      • Quality Choices
      • Personalized Pathways
    • Research
    • Commentary
      • Gadfly Newsletter
      • Flypaper Blog
    • Events
    • Scholars Program
  • Ohio
    • Policy
      • Priorities
      • Media & Testimony
    • Research
    • Commentary
      • Ohio Education Gadfly Biweekly
      • Ohio Gadfly Daily
  • Charter Authorizing
    • Application
    • Sponsored Schools
    • Resources
  • About
    • Mission
    • Board
    • Staff
    • Career
Home
Home
Advancing Educational Excellence

Main Navigation

  • National
  • Ohio
  • Charter Authorizing
  • About

Ohio Menu

  • Topics
    • Accountability & Testing
    • Advanced Education
    • Career & Technical Education
    • Charter Schools
    • Curriculum & Instruction
    • ESSA
    • Evidence-Based Learning
    • Governance
    • Personalized Learning
    • Private School Choice
    • School Finance
    • Standards
    • Teachers & School Leaders
  • Research
  • Policy
  • Commentary
    • Ohio Gadfly Newsletter
    • Ohio Gadfly Blog
    • Events

The Education Gadfly Weekly

Sign Up to Receive Fordham Updates

We'll send you quality research, commentary, analysis, and news on the education issues you care about.
Thank you for signing up!
Please check your email to confirm the subscription.

Ohio Gadfly Biweekly—The third grade reading guarantee might be working after all

Volume 15, Number 12
5.21.2021
5.21.2021

Ohio Gadfly Biweekly—The third grade reading guarantee might be working after all

Volume 15, Number 12
view
3rd Grade Reading blog image
Standards & Accountability

The third grade reading guarantee might be working after all

First implemented in the 2013–14 school year, Ohio’s third grade reading guarantee has aimed to ensure that all children have the foundational reading skills needed to navigate more chall

Aaron Churchill 5.21.2021
OhioOhio Gadfly Daily

The third grade reading guarantee might be working after all

Aaron Churchill
5.21.2021
Ohio Gadfly Daily

An overview of what Cleveland schools will offer students this summer

Jessica Poiner
5.18.2021
Ohio Gadfly Daily

Will Ohio hold schools accountable for effectively spending federal relief aid?

Aaron Churchill
5.17.2021
Ohio Gadfly Daily

Dissecting the pandemic pivot to remote teaching and learning at the college level

Jeff Murray
5.24.2021
Ohio Gadfly Daily

The effects of immigrant students on the educational performance of their U.S.-born peers

Jeff Murray
5.20.2021
Flypaper

Testimony presented before the Senate Primary and Secondary Education Committee on HB 110 – 5/10/21

Chad L. Aldis
5.10.2021
Ohio Gadfly Daily

Testimony presented before the Senate Primary and Secondary Education Committee on SB 145—5/11/21

Chad L. Aldis
5.11.2021
Ohio Gadfly Daily

Testimony provided before the Senate Finance Committee on HB 110—5/17/21

Chad L. Aldis
5.17.2021
Ohio Gadfly Daily
view
CMSD summer plans blog image

An overview of what Cleveland schools will offer students this summer

Jessica Poiner 5.18.2021
Ohio Gadfly Daily
view
ESSER II and III funding in Ohio blog image

Will Ohio hold schools accountable for effectively spending federal relief aid?

Aaron Churchill 5.17.2021
Ohio Gadfly Daily
view
Remote science courses SR image

Dissecting the pandemic pivot to remote teaching and learning at the college level

Jeff Murray 5.24.2021
Ohio Gadfly Daily
view

The effects of immigrant students on the educational performance of their U.S.-born peers

Jeff Murray 5.20.2021
Flypaper
view
Chad Aldis HB 110 Testimony for Senate 5-10-21 image

Testimony presented before the Senate Primary and Secondary Education Committee on HB 110 – 5/10/21

Chad L. Aldis 5.10.2021
Ohio Gadfly Daily
view
Chad Aldis SB 145 testimony image

Testimony presented before the Senate Primary and Secondary Education Committee on SB 145—5/11/21

Chad L. Aldis 5.11.2021
Ohio Gadfly Daily
view
Chad Aldis HB 110 Testimony for Senate Finance 5-17-21 image

Testimony provided before the Senate Finance Committee on HB 110—5/17/21

Chad L. Aldis 5.17.2021
Ohio Gadfly Daily
view
3rd Grade Reading blog image

The third grade reading guarantee might be working after all

Aaron Churchill
5.21.2021
Ohio Gadfly Daily

First implemented in the 2013–14 school year, Ohio’s third grade reading guarantee has aimed to ensure that all children have the foundational reading skills needed to navigate more challenging material. The early literacy policy has many facets, including fall reading diagnostic assessment in grades K–3, mandatory parental notification and reading improvement plans if a child is deemed off-track, and retention and intensive interventions if a student doesn’t achieve a benchmark score on a third grade exam.

This early warning and intervention system was created in part as a response to research showing a link between children’s early literacy skills and their academic outcomes later in life. The most influential analysis was a 2011 Annie E. Casey Foundation report that found non-proficient readers in third grade were far more likely to drop out of high school than their peers. Subsequent analyses have uncovered similar results. An analysis of Ohio data discovered that non-proficient readers in third grade were three times more likely to not graduate. A recent study of Massachusetts, North Carolina, and Washington State data found that students who struggle to read in third grade take fewer advanced high school courses and have lower graduation rates.

Despite the well-documented importance of early literacy, the third grade reading guarantee has endured much criticism. The attacks have largely centered on the mandatory retention policy that critics have decried as punitive. Of course, that’s hardly the intention. It’s there to ensure that children struggling to read aren’t being robotically passed to the next grade, but actually receive the extra help they need. The policy is also supported by rigorous studies from Florida and Chicago showing that retention in early grades can give low-achieving students an academic boost.

Despite the criticisms of retention, schools have not been required to hold back many third graders. In the years the guarantee has been in effect, promotional rates have ranged between 93 and 96 percent, even though third grade reading proficiency rates have been much lower (67 percent in 2018–19). These sky-high promotional rates are explained by allowances for alternative assessments, exemptions for certain students, and a low promotional bar. In 2018–19, for example, students had to achieve a score of 677 on the state third grade ELA exam to be promoted—barely above the basic level.[1]

A recent bill introduced by House lawmakers (HB 73) wouldn’t just weaken the retention requirement; it would scrap it altogether. In committee hearings, familiar objections to the policy have been raised. But one witness suggested, in a new twist, that the reading guarantee isn’t working as intended. His claims were based on a 2019 Ohio State University analysis of fourth grade NAEP reading scores, which while informative, offer a limited snapshot of achievement patterns in the years in which the reading guarantee has been in effect (the 2017 and 2019 rounds are arguably the only ones that apply). What wasn’t examined, however, were trends in third grade ELA state test scores. This was likely due to transitions in state exams that left only a year or two of consistent test scores at the time of that study. But we now have four consecutive years of data from the same state exam, so we can get a more complete picture of achievement trends under the reading guarantee law.

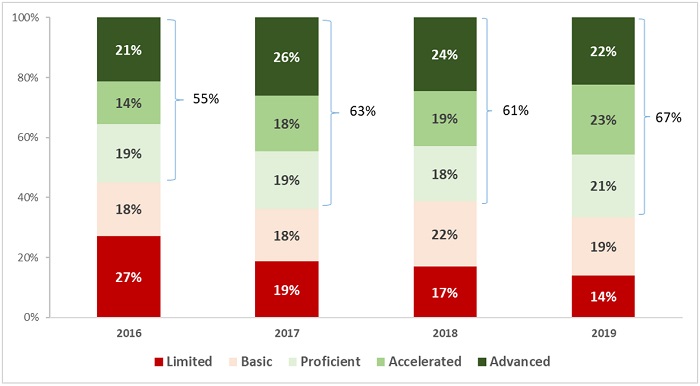
Lo and behold, we do see noticeable improvements in the state assessment data. Figure 1 displays the results for all Ohio third graders. We see an uptick in proficiency rates—from 55 percent in 2015–16 to 67 percent in 2018–19. Also noteworthy, given the guarantee’s focus on struggling readers, is the substantial decline in students scoring at the lowest achievement level. Twenty-seven percent of Ohio third graders performed at the limited level in 2015–16, while roughly half that percentage did so in 2018–19. Given the generally small and constant numbers of retained students over this period, it’s highly unlikely that the increases are due to students retaking third grade exams. The more probable explanation is that Ohio schools are improving their early literacy practices—perhaps even in response to the threat of retention—and children are reaping the benefits. 

Figure 1: Results on Ohio’s third grade ELA exams, all students

3rd Grade Reading blog figure 1

Source (figures 1-3): Ohio Department of Education, Advanced Reports

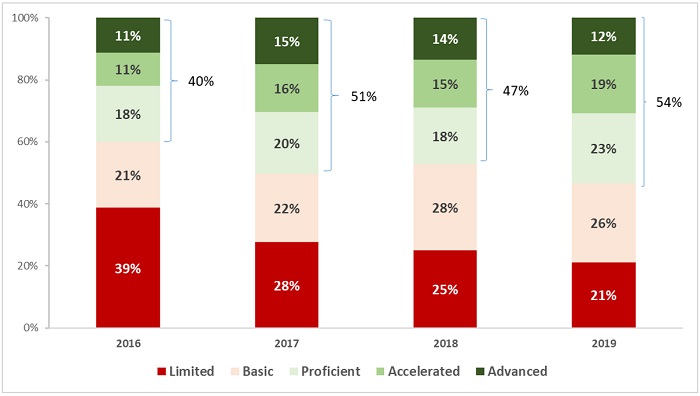
Figure 2 shows data for economically disadvantaged students. Although they generally score at lower levels than the statewide average—reflecting well-documented achievement gaps—we also see promising signs of improvement. In 2015–16, just 40 percent of economically disadvantaged students scored proficient or above on their third grade ELA exams; that number increased to 54 percent by 2018–19. We also see a substantial decrease in the percentage of these students who score at the limited level.

Figure 2: Results on Ohio’s third grade ELA exams, economically disadvantaged students

3rd Grade Reading blog figure 2

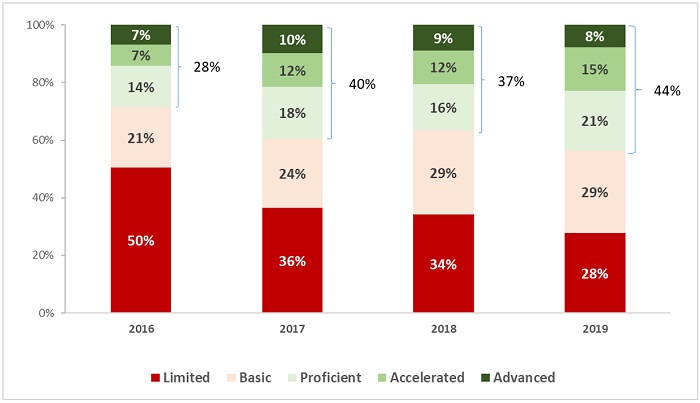
Figure 3 displays third grade ELA test data for Black students. We again observe marked improvements. Proficiency rates rose by 16 percentage points from 2015–16 to 2018–19, along with a large decline in the number of Black students scoring at the lowest level on the state test.  

Figure 3: Results on Ohio’s third grade ELA exams, Black students

3rd Grade Reading blog figure 3

The progress seen in the charts above are not proof positive that the reading guarantee as a whole—or its retention provision specifically—is working. It may be other factors that are driving the improvements. Yet rising pupil achievement on state exams shouldn’t be ignored or brushed aside. Far fewer third grade students read at dangerously low levels, while increasing numbers reach the state’s proficiency bar.

To be sure, these data show that Ohio still has work to do to ensure all children exit third grade with solid literacy skills. Given the pandemic-related learning losses—likely worse in the early elementary grades—this imperative will become even more urgent in the months ahead. Weakening the reading guarantee isn’t the way to drive these much-needed improvements in early literacy. Rather, lawmakers would be smart to stay the course on policy reforms that seem to be working for Ohio students.


[1] Due to Covid, lawmakers put a pause on the retention requirements for the 2019–20 and 2020–21 school years.

view
CMSD summer plans blog image

An overview of what Cleveland schools will offer students this summer

Jessica Poiner
5.18.2021
Ohio Gadfly Daily

Summer school offerings are historically reserved for academically struggling students or those with special needs. This year, though, pandemic-related school closures have increased the number of students who will need extra support during the upcoming summer months.

In February, Governor DeWine recognized this need and called on public schools to create extended learning plans. Such plans are particularly important in places like Cleveland. The city is home to the Cleveland Metropolitan School District (CMSD), the second largest district in the state. The vast majority of CMSD students are economically disadvantaged and students of color. They live in one of the most disconnected cities in the nation, and the lack of wireless internet and internet-enabled devices made the transition to remote learning especially difficult. To make matters worse, pre-pandemic issues like chronic absenteeism were exacerbated by school closures. Almost nine months after schools initially closed their doors, thousands of students in Cleveland were still missing from school.

If there’s one district that needs to take full advantage of the upcoming summer months to get students back on track, it’s Cleveland. Fortunately, CMSD appears to be on the right path. The plan available on the Ohio Department of Education’s website is pretty bare bones, but the district’s website offers far more detail about their extended learning efforts. That includes information on their most important recovery effort—summer school.

Known as the CMSD Summer Learning Experience, the program comprises two four-week sessions with a break in between for the Fourth of July holiday. Registration opened on May 3, and all students who are in grades pre-K through twelfth grade and are enrolled or pre-registered with the district are eligible to attend. Breakfast and lunch will be provided, and students can sign up to attend for either a half or full day.

For students in grades K–8, the district has identified more than a dozen learning sites, or “clusters,” spread throughout the city. Each site contains at least one school building that will house programming. The district website organizes these sites by neighborhood and identifies the specific buildings where students will spend each day. Transportation is free, but will operate like a shuttle service. That means that to catch a bus to their learning site, students will need to travel to a school that’s been identified by the district as a pickup and drop-off location. Meanwhile, at the high school level, students will be given public transit passes to travel to their learning sites. 

The Summer Learning Experience is designed to address three core areas: Finish, Enrich, and Engage. Finish, which occurs every morning from 8:30–10:30 a.m., allows students to recover lost learning and participate in credit recovery or acceleration. The Enrich period—from 10:30 a.m.–12:30 p.m.—consists of project-based programs that allow students to immerse themselves in a particular area of interest. After lunch and until the day ends at 4:00 p.m., students will participate in Engage activities led by a variety of community partners.

Although this basic schedule will be in place for most learning sites and across all grade levels, there are a few key differences between what’s available for students in grades K–8 and what’s available for high schoolers. Here’s a brief overview.

Grades K–8

Finish
The Finish period consists of ninety minutes of math or English language arts. The district has offered vague descriptions about what students will learn during these sessions—fourth and fifth graders, for example, will focus on whole numbers, fractions, and “big ideas in reading and writing”—but there isn’t much detail. It’s unclear who will be teaching students, how they’ll identify the extent and specifics of each student’s unfinished learning, and how they’ll assess whether students have mastered the content and caught up. It’s possible that the district already has these details worked out, but that information isn’t included on their public-facing site. 

Enrich
This will be project-based learning time, and there are a variety of “courses” that students can choose to participate in. Projects are divided into certain areas—the arts, STEM, humanities, Love the Land (projects with a Cleveland focus), and high school transition—and the district has provided a course descriptions flyer listing all the options. It’s important to note, though, that some courses are only available at certain sites. For example, only students in grades 1–3 who attend the Halle learning site can participate in “STEM Fairy Tales,” while students in grades 4–6 at fourteen different sites will be able to participate in “How Journalism Can Shape the World.”

Engage
In the afternoon, students will have the option to participate in camps and activities like sports, band, and creative writing. As is the case with project-based learning during the Enrich period, each school site has its own community partner and thus its own programming (though some partners are working at multiple sites). The list of community partners includes organizations like the Cleveland Playhouse, the Boys and Girls Club, the Greater Cleveland Neighborhood Centers Association, and After School All Stars.

High school 

Finish
Unlike their younger peers, who will spend their Finish period focused solely on ELA or math, high schoolers have more flexibility. Students who failed to earn credit for a course they took during the 2020–21 school year will be able to make up that credit in one of two ways. The first, called the FuelEd program, allows students to work their way through a self-paced, online credit recovery program. The second, referred to as the flexible credit earning option, permits students to recover credit by demonstrating mastery in the specific concepts and skills they failed to master during the year. To participate in this option, students must develop a plan with their current teacher and work closely with their summer experience teacher. This sounds like a promising option because it allows students who only have a few gaps to focus all their energy on their weakest areas. But without clear guardrails and goals—which aren’t outlined on the site if they do exist—such an option is also wide open to gaming. 

Students who don’t need to recover credits can participate in a college readiness course that focuses on ACT/SAT prep. A separate course that focuses on Accuplacer prep will also be offered at the Design Lab site. Finally, in addition to credit recovery and college prep, high schoolers at certain learning sites will have the opportunity to earn credit in courses they haven’t taken before, like Spanish, American history, vehicle maintenance and customization, “coding is life,” and intro to sports medicine. 

Enrich
The Enrich period for high school students consists of project-based programs, with course availability depending on the learning site. As is the case with younger students, projects fall into certain categories—the arts, STEM, humanities, and Cleveland-focused programs known as “I Love the Land.” High school students will also have access to career-tech projects, such as “Culinary Camp: Addressing Food Deserts” and “Be the Boss: The Business Plan from Dream to Reality.”

Engage
Just like their younger peers, high schoolers will have the opportunity to spend the afternoon engaged in clubs, athletic camps, and other activities led by a variety of community partners.

***

As is the case with most extended learning plans, it’s difficult to know whether CMSD’s Summer Learning Experience will get students back on track. There’s certainly plenty of potential. The project-based learning options for both K–8 and high school students look rigorous and engaging, and partnering with community organizations is always a good idea. But there are also some big question marks surrounding the Finish portion of the day. For younger students, it’s unclear whether they’ll receive instruction in math and ELA every day, and if or how that instruction will be tailored to their specific learning needs. The transportation plan is also questionable, as it requires families to get their students to a district building to catch a bus rather than being able to catch one at a neighborhood stop. Meanwhile, at the high school level, offering online credit recovery to students who likely struggled with remote classes doesn’t seem like the best option for catching students up. And overall, there doesn’t appear to be a clear method for measuring whether students made academic progress over the course of the summer.

But implementation is everything, and extended learning at this scale has never been done before. Families and advocates in Cleveland should keep a close eye on how the Summer Learning Experience progresses once it starts. In the meantime, though, at least the district has a plan in place to offer students more opportunities to learn and grow. 

view
ESSER II and III funding in Ohio blog image

Will Ohio hold schools accountable for effectively spending federal relief aid?

Aaron Churchill
5.17.2021
Ohio Gadfly Daily

Just over a year ago, Congress passed the first of three emergency relief packages aimed at supporting the economy during the pandemic. The big-ticket items included massive amounts of funding for K–12 education. Ohio will receive a total of roughly $7 billion for schools, or about $4,000 per student, through the three pieces of legislation. The largest sums will arrive via funding streams known as ESSER II and ESSER III that were included in the two most recent packages. Save for a set-aside for the Ohio Department of Education (ODE), the vast majority of these dollars go directly to school districts and public charter schools. They have through fall 2023 to obligate these funds and may spend them on a wide range of activities.

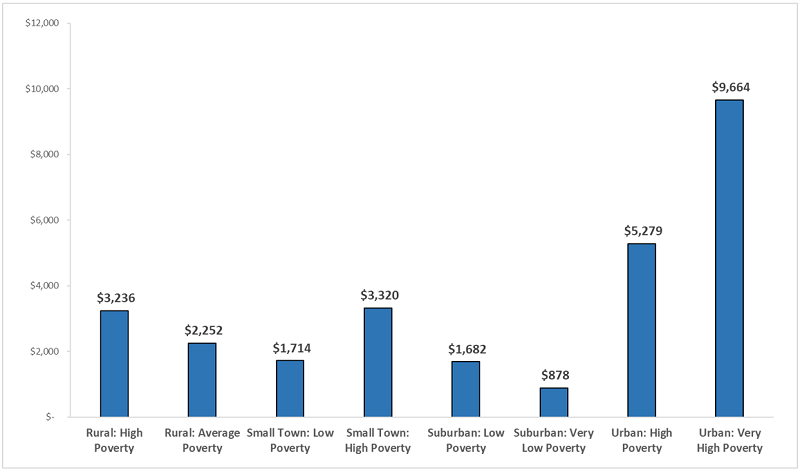
To allocate dollars, federal lawmakers required the use of Title I formulas that generally steer more aid to high-poverty districts. That’s sensible, as low-income students have likely been most impacted by the pandemic. But it is worth noting the significant concentration of funding in high-poverty urban districts. The Ohio Eight districts, which include Cleveland and Columbus, receive amounts that average almost $10,000 per pupil; these are the “urban: very high poverty” districts in Figure 1 below. Meanwhile, other districts receive more modest sums. Lower-wealth rural and small town districts, for instance, receive approximately $3,000 per pupil, while wealthier suburban districts receive around $1,000 per pupil. Interestingly, one of Ohio’s largest suburban districts—Olentangy—gets zero federal relief dollars.

Figure 1: Average per-pupil ESSER II and III funding by district typology

ESSER II and III funding in Ohio blog figure 1​

Source: Ohio Legislative Service Commission. Note: Chart displays an average per-pupil funding (weighted by each district’s enrollment) from the ESSER II and III relief packages by ODE’s district typologies.

While Ohio policymakers don’t have control over how most ESSER dollars are allocated, they can work to ensure that these funds are being used appropriately. That goal is important for two reasons. First and foremost, the aid is supposed to help students recover after much disruption to their education. Given that pre-existing achievement gaps have likely widened due to the pandemic, it’s especially critical that high-poverty schools use these funds wisely (and that ODE target its funds effectively). Second, much like its oversight role in federally funded programs such as unemployment insurance, the state has a responsibility to the taxpayer to be transparent about how schools use this public money, and to help guard against abuse.

To their credit, lawmakers in both the Senate and House are considering ways to create more transparency and accountability for these federal funds. Consider the provisions in two similar pieces of legislation that were introduced earlier this spring—HB 170 and SB 111 (neither have been enacted).

  • Fiscal transparency. The Senate legislation contains an important provision that would create more sunlight and accountability around the use of these dollars. Specifically, it requires ODE to submit reports by December 2022 and 2023 that detail how schools are spending these federal dollars. This is crucial because, right now, all we know is the dollar amounts that schools receive. For example, ODE reports that Columbus City Schools received $31 million in CARES Act funding—the first of the relief packages. What we don’t know is how the district is spending those funds. On summer programs or tutoring? Salary increases? HVAC systems or new busses? This reporting requirement would also shed light on how ODE is using its funds and how the governor’s office is spending the modest amount of aid that it received to spend on education.


  • Legislative check on ODE spending. As already noted, ODE also receives a portion of the relief aid through set-asides allowed in the federal legislation. Specifically, all three packages permit state departments of education to reserve up to 10 percent of the total amount of ESSER funding to use for centralized activities. In Ohio, that amounts to somewhere north of $500 million available for ODE—a sizeable pot of money that it can generally use at its discretion. The House legislation includes a check on how ODE uses these dollars by explicitly requiring the department to seek lawmaker spending approval through the state’s controlling board. This oversight mechanism could discourage poor uses of these funds, and it may also create an avenue for legislator input into the agency’s spending decisions.
     
  • Protecting against abuse. Despite the good intentions of the relief programs, there have also been cases of fraud, especially in the paycheck protection and unemployment programs. Although education funds may be less susceptible to abuse, it’s not unheard of for schools to mismanage money. Both Senate and House bills wisely include provisions that allow the Ohio Auditor of State to look into the spending of federal education relief dollars, whether they are being spent by ODE or Ohio schools. The threat of a potential audit could curb questionable spending—things like sweetheart contracts or deviations from spending rules. The provisions would also allow the auditor to investigate concerns and likely issue findings for recovery if instances of abuse are uncovered.

Finally, while not a part of either HB 170 or SB 111, state policymakers should consider one additional measure: Evaluations of schools’ federally funded recovery initiatives. This would increase our understanding not only about how these dollars were spent, but how effectively they were deployed. For instance, as my colleague Jessica Poiner recently highlighted, Columbus City Schools is planning wide-ranging summer programs that are almost certainly being supported to some extent through the relief aid. It’s one thing to know that the district is using the funds to support summer learning, but it’s even more critical to gauge whether these initiatives are making an impact. Good research would help answer questions like how many students participated—and how many did so consistently. Did the summer programs boost learning outcomes or improve other indicators of children’s well-being? It’s true that these evaluations won’t be able to inform immediate spending decisions. But solid, independent research would provide valuable information about the return on these investments, and help guide future decisions about whether to scale up, modify, or wind down schools’ recovery initiatives.

* * *

A significant amount of federal funding is pouring into Ohio schools, with the largest portions going to high-poverty districts. These dollars are of course temporary but they should assist in the efforts to help students regain lost ground. Much, however, hinges on whether schools use these dollars in an effective manner. Of course, state lawmakers need to continue to insist on accountability for student outcomes. To that end, the state should reboot its report card system as soon as possible. Beyond that, however, a little extra oversight around spending these funds wisely could further ensure that students reap the benefits.

view
Remote science courses SR image

Dissecting the pandemic pivot to remote teaching and learning at the college level

Jeff Murray
5.24.2021
Ohio Gadfly Daily

Stories of successful remote teaching and learning experiences during the pandemic are heartening. But more and better data around those successes are required. Evidence suggests that districts will likely continue some level of Covid-era remote learning for the near future, and that old-school virtual charters have drawn in many new families who discovered their need for them in 2020. Anecdotes of successful pandemic pivots are not enough. A new report published in the Journal of Microbiology & Biology Education is a good start at building the vital knowledge base of how best to conduct virtual learning. The data come from the perspective of higher education but many of the lessons are transferrable to K–12.

The three co-authors of the report are all professors at New York University, teaching undergraduate seminar-style biology courses, each enrolling about twenty-five students. All three had to adapt their traditional courses to fully-remote models, taught from their homes to students in their homes located around the world. The instructors’ desire to maintain quality and rigor in their courses while pivoting to remote teaching drove them to reassess their learning objectives—derived from the K–12 Next Generation Science Standards—determining that some could only be communicated and achieved through synchronous, real-time instruction, while others could be successfully met via asynchronous, self-paced coursework. They also needed to revamp their course materials to make them fully accessible to students in the remote mode. Finally, a number of new technology platforms were required to ensure full participation and collaboration among students and with their instructors.

The adaptations required were endless. For example, an experiential learning project—in which students identify twenty unique plant species in their local environment to observe the effects of biodiversification—included changes to cover lack of Wi-Fi in the field, varying access to personal technology, extreme differences in students’ local environments around the world, and even differing levels of pandemic lockdown protocol ongoing in various countries. A number of off-the-shelf remote learning tools were employed to help maintain student progress in the asynchronous effort and to facilitate the group work required. Final presentations were recorded and viewed via Zoom, and while live feedback did not occur, each student was required to view and comment on all the presentations in writing via a Google form.

In a second example, the professors initially thought one of several existing, open-source virtual labs could be used to replace their typical Mendelian genetics project. However, these were found to cover only non-human genetics and did not feature face-to-face phenotyping, both of which had been found to be important for successful student engagement and information retention in the course previously. Pivoting, a synchronous Zoom session which largely approximated the typical classroom version was substituted. This included phenotyping in pairs, individual data analysis, and a full group session to discuss findings. A handful of students unable to attend synchronously completed their work individually on their own time and were able to view a recording of the group discussion.

What does all this amount to? On the upside: Certain learning targets, such as understanding biodiversity and adaptation to various environments, were enhanced by the geographic spread of students. The need for different versions of course materials led the professors to reinvent those materials in positive ways which will help improve access to them in the future. And the pandemic itself, including rapidly-evolving data and misinformation, provided a strong “hook” for group projects on real-world biology concepts.

On the downside: Working with unfamiliar software and modules sometimes put the focus on troubleshooting rather than learning for both teachers and students, varying student access to Wi-Fi and sufficiently powerful devices led to an occasionally unequal experience of the class, and extreme time-zone variations rendered full class synchronization impossible. Luckily, such time zone issues rarely bedevil remote learning in the K–12 space. And it is to be hoped that between philanthropic, state, and federal efforts spurred by the pandemic, internet and enabled-device access will be a quickly-shrinking problem for our schools moving forward.

But the biggest roadblock to the highest quality remote learning identified here and elsewhere is a lack of live personal feedback. Kudos to the NYU professors for their clever adaptations and creative thinking to create virtual conversations—and a hearty welcome back for the old school online message board—but live Q. and A. among students and teachers was largely absent for a variety of reasons. This is the life blood of lecture and seminar classes, a non-negotiable element that must be faithfully replicated if fully-remote learning is to have a permanent and effective place in formal education.

It is unfortunate that the professors did not compare student outcomes between their traditional seminar and the Covid-adapted version. It was likely a deliberate omission with no explanation provided. Such data are, ultimately, what are required to make certain that remote learning efforts properly replicate traditional classroom rigor. However, the details provided here are a useful step forward.

SOURCE: Erin S. Morrison, Eugenia Naro-Maciel, and Kevin M. Bonney, “Innovation in a Time of Crisis: Adapting Active Learning Approaches for Remote Biology Courses,” Journal of Microbiology & Biology Education (May 2021).

view

The effects of immigrant students on the educational performance of their U.S.-born peers

Jeff Murray
5.20.2021
Flypaper

According to U.S. Census data, 23 percent of students in America’s K–12 schools were either first- or second-generation immigrant children in 2015. That was up from 11 percent in 1990 and 7 percent in 1980. This demographic shift required big changes in schools to support those children and their families, especially in areas with exceptional concentrations of immigrant children. What impacts did this influx and the associated changes have on U.S.-born students? The research base is limited, but a new analysis from the National Bureau of Economic Research shines light on this question.

The research team made use of longitudinal data from Florida to address two perennial sticking points in studying this question. First, immigrant students are not randomly assigned to schools and in fact are more likely to enroll in schools educating students from disadvantaged backgrounds. Second, U.S.-born students may decide to leave when large numbers of immigrant students enter their school. Thus, posit the analysts, the negative impacts of immigrant students on U.S.-born students found in previous analyses may not have been accurately evaluated.

With the Florida data, the researchers were able to identify siblings in different grades in the same schools and use their differing levels of exposure to immigrant peers—as well as their responses to it—to build what they judge to be a more accurate model of impact. Instead of a full-cohort analysis as is typically done, they compare math and reading test scores of siblings who experience different cumulative exposures to immigrants based on their ages and grade levels. Additionally, they compare the school-transition experiences of siblings based on their relative exposures to immigrant students. That is, two siblings who start in the same school in different years are held to have the same probability of changing schools over the years, absent the variation in immigrant exposure. This creates a measure of “native flight” against which the academic outcome findings can be compared.

When this model is run, the traditionally-observed negative impacts of immigrant exposure on U.S.-born students’ academic outcomes are actually reversed. All students exposed to immigrants perform better, and this occurs independent of the actual performance level of the immigrant students themselves. The researchers explain that, “[m]oving from the 10th to the 90th percentile in the distribution of cumulative exposure (1 percent and 13 percent, respectively) increases the score in mathematics and reading by 2.8 percent and 1.7 percent of a standard deviation, respectively. The effect is double in size for disadvantaged students.” For White and wealthy U.S.-born students, the effect is still positive but much smaller. Perhaps unsurprisingly, it is just those students from more advantaged backgrounds—youngsters for whom a higher number of acceptable choices are available—who are more likely to exit their schools when immigrant concentrations grow. Those students who remain experience the academic boost. For Black students, however, the positive effect of immigrant exposure appears in both models, perhaps because they’re not “taking flight” in either case.

What might be causing the boost? Parental education level and cultural influence from the country of origin are part of the answer in terms of magnitude, but something else must be involved because the boost appears regardless of immigrant students’ own performance level. The researchers investigate two possibilities: that more resources are available to schools with higher concentrations of immigrant students, and that there is an inherent positive impact of diversity on learning. Neither theory can be proven with the available data. So we don’t know exactly what the mechanism is. We are simply left with the observation that an increase in immigrant exposure boosts academic outcomes for almost all U.S.-born students in a school, but that this boost is only achieved when a specific segment of U.S.-born students leave that school in response to same.

The findings are simultaneously compelling and depressing. If the mechanism at play could be understood, perhaps it could be harnessed to help all students. And with a baby bust underway here in the U.S., the percentage of immigrant students in U.S. classrooms could continue to climb, making that effort even more important going forward.

SOURCE: David N. Figlio, Paola Giuliano, Riccardo Marchingiglio, Umut Özek, and Paola Sapienza, “Diversity in Schools: Immigrants and the Educational Performance of U.S. Born Students,” National Bureau of Economic Research (March 2021).

view
Chad Aldis HB 110 Testimony for Senate 5-10-21 image

Testimony presented before the Senate Primary and Secondary Education Committee on HB 110 – 5/10/21

Chad L. Aldis
5.10.2021
Ohio Gadfly Daily

NOTE: Today, the Ohio Senate’s Primary and Secondary Education Committee heard invited testimony on HB 110, the state budget bill. Fordham’s Vice President for Ohio Policy was invited to testify on topics related to school funding and interdistrict open enrollment. These are his written remarks.

My name is Chad Aldis, and I am the Vice President for Ohio Policy at the Thomas B. Fordham Institute. The Fordham Institute is an education-focused nonprofit that conducts research, analysis, and policy advocacy with offices in Columbus, Dayton, and Washington, D.C. Our Dayton office, through the affiliated Thomas B. Fordham Foundation, is also a charter school sponsor.

Last week, I touched on a host of school funding and education policy issues in House Bill 110. In that testimony, I mentioned some of the strengths of the House school funding plan, including its elimination of funding caps, the increased focus on providing adequate resources for low-income students, and the shift to direct fund choice programs. The House should be commended for their work in those areas. In today’s testimony, however, I’ll limit my comments to three specific areas in school funding that merit further discussion: guarantees, interdistrict open enrollment, and outyear funding.

Guarantees

Ohio has long debated “guarantees,” subsidies that provide districts with excess dollars outside of the state’s funding formula. These funds are typically used to shield districts from losses when the formula calculations prescribe lower amounts due to declining enrollments or increasing wealth. In FY 2019—the last year in which funds were allotted via formula—335 of Ohio’s 609 school districts received a total of $257 million in guarantee funding. The guarantee, it’s worth noting, isn’t directly tied to poverty: A number of higher-wealth districts benefitted from the guarantee in 2019.

Guarantees undermine the state’s funding formula whose aim is to allocate dollars efficiently to districts that most need the aid. Districts on the guarantee receive funds above and beyond the formula prescription, while others receive the formula amount—sometimes even less due to the cap. Because guarantees are usually related to enrollment declines, they effectively fund a certain number of “phantom students” who no longer attend a district.

Among the main ideas of HB 110 is to get all districts on the same formula. That’s exactly the right goal. But while the legislation removes caps, it does not adequately address guarantees. Let me raise three specific issues:

  • Permanent guarantee. In a new section of law (3317.019), House Bill 110 creates a permanent guarantee that ensures no district loses state funding on a per-pupil basis starting in FY 2024. While no estimates have been released on how many districts this may apply to, or what the cost to the state may be, it’s concerning to see the continued reliance on guarantees to fund some districts.

  • Supplemental targeted assistance. In another new section of law (3317.0218), House Bill 110 would send excess money outside of the formula to districts where significant numbers of resident students have enrolled in choice programs. Certain low-wealth districts where more than 12 percent of students attended public charter schools or used private-school vouchers in 2019 would receive an annual bump in state funding, anywhere from $75 to $750 per pupil. This policy, which is akin to funding phantom students, is estimated to cost the state $56 million per year. That may not sound like a large amount of money, but it’s happening at the same time the budget is being phased in and districts are receiving less—sometimes much less—than the formula says that they should.

  • Staffing minimums. Though not a guarantee in a traditional sense, HB 110 includes something like it in its base cost model. School districts—though not charter schools—are guaranteed a minimum number of special teachers, and SEL and administrative staff, even when the plan’s specified staff-to-enrollment ratios would have resulted in lower staffing support. Such minimums boost the base costs of low-enrollment districts, thus creating a small-district subsidy that is funded like a de facto guarantee within the base cost formula.

Interdistrict open enrollment

Open enrollment is an increasingly popular public school choice program, especially among families living in Ohio’s rural areas and small towns. More than 80,000 students today use interdistrict open enrollment to attend public schools in neighboring districts. Research commissioned by Fordham has shown that students who consistently open enroll benefit academically, especially students of color.

Under current policy, the funding of open enrollees is fairly straightforward. The state subtracts the “base amount”—currently a fixed sum of $6,020 per pupil—from an open enrollee’s home district and then adds that amount to the district she actually attends. Apart from some extra state funds for open enrollees with IEPs or in career-technical education, no other state or local funds move when students transfer districts.

In a wider effort to “direct fund” students based on the districts they actually attend, House Bill 110 eliminates this funding transfer system for open enrollment. Open enrollees are included in the “enrolled ADM” of the district they attend and thus receive the same level of state funding as resident pupils of that district. While this seems to make sense at face value, the approach results in significantly lower funding for most open enrollees relative to current policy, creating disincentives especially for mid- to high-wealth districts to accept open enrollees.

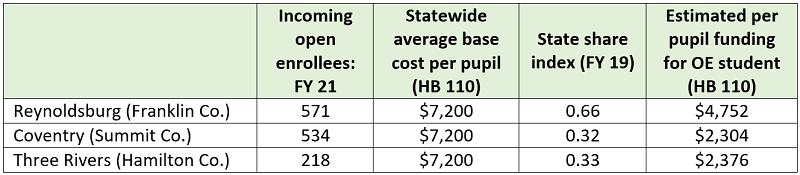
The table below illustrates how applying the state share reduces funding for open enrollment, using three districts that have significant numbers of open enrollees this year. Note, we use the district’s state share index from FY 2019 and the average statewide base cost under HB 110, because those data were not available in the funding simulations. What we see is that open enrollment funding is significantly reduced relative to the current $6,020 per pupil once the state share is applied. Will districts like Coventry and Three Rivers continue to offer open enrollment when per-pupil funding is cut by more than half? Will wealthy districts that currently refuse to participate open their doors when the state funding is so low? Remember that under current policy districts voluntarily participate in the program—it’s not required—so the funding amounts are crucial to opening these opportunities to students.

Illustration of open enrollment funding in HB 110

Chad Aldis HB 110 testimony for Senate Figure 1​

Some have suggested that the new formula when fully phased in won’t create a disincentive in regards to open enrollment and will adjust to produce a funding amount similar to what open enrollees currently receive. If true, that’s fantastic. It’s not in the legislative analysis, and it’s not explicitly in HB 110. This is too important to leave to chance. Please add language to ensure that open enrollees continue to receive adequate funding.

Outyear funding

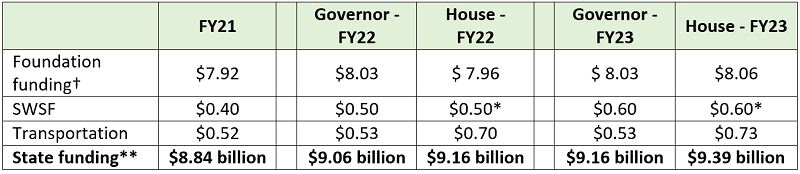
As has been widely reported, the overall price tag of the House funding overhaul is estimated to be an additional $2 billion per year. Yet, as the table below indicates, HB 110 calls for generally modest increases in education spending in the next biennium. Relative to the Governor’s plan, the House raises state education funding by roughly $100 million in FY 2022 and $230 million in FY 2023. Most of those dollars go into transportation rather than into the classroom.

An overview of state education funding, current and proposed (in billions)

Chad Aldis HB 110 testimony for Senate Figure 2​

*In the House plan, the Student Wellness and Success Funds remain a standalone line item, but are used to fund an increase in the economically-disadvantaged component of the funding formula and the SEL portion of the base cost model. **This excludes federal and local dollars, various smaller state expenditures (e.g., educator licensing and assessments), and money for K–12 education not funded via ODE budget (e.g., school construction dollars and property tax reimbursements). † This includes the additional $115 million that was included in the omnibus amendment to the House budget.

The six-year phase-in of the funding increases called for by HB 110 explains the relatively small increases. While this gradual approach may have been necessary, it continues to raise questions about how the rest of the funding model will be paid for. Will future lawmakers need to raid other parts of the state budget to pay for increases, as HB 110 does with the Student Wellness money? Or are they leaving the heavy lifting—possibly raising taxes—to future lawmakers? And what happens when there are calls to re-compute the base costs using up-to-date salaries and benefits, instead of 2018 data? We’ve already heard this committee discuss the need for an additional $454 million to fund based on FY 2020 salary levels. While it might be fine to use three-year-old salary data now, won’t using FY 2018 data be a problem in FY 2026? This alone gives considerable uncertainty about how this funding model can be sustained over the long run.

***

Funding the education of 1.8 million Ohio students is an incredible responsibility, and I commend legislators in both the House and Senate for their diligent work in this area. Creating a fair, sustainable—and student-centered—funding model remains one of the most challenging areas in education policy. For the past two decades, Ohio has made significant progress in funding education, and with additional, smart reforms, we can continue to create a system that is fair, equitable, and built to last.

Thank you for inviting me to share my thoughts and I welcome your questions.

view
Chad Aldis SB 145 testimony image

Testimony presented before the Senate Primary and Secondary Education Committee on SB 145—5/11/21

Chad L. Aldis
5.11.2021
Ohio Gadfly Daily

NOTE: On May 11, the Ohio Senate’s Primary and Secondary Education Committee heard testimony on Senate Bill 145, a proposal to revise school and district report cards in the state. Fordham’s Vice President for Ohio Policy provided proponent testimony on the bill. These are his written remarks.

My name is Chad Aldis, and I am the Vice President for Ohio Policy at the Thomas B. Fordham Institute. The Fordham Institute is an education-focused nonprofit that conducts research, analysis, and policy advocacy with offices in Columbus, Dayton, and Washington, D.C.

I’d like to start by commending the bill sponsor and the committee for tackling this important and incredibly complex issue. School and district report cards perform a variety of critical functions. For parents, the report cards offer objective information as they search for schools that can help their children grow academically and reach their potential. For citizens, they remain an important check on whether their schools are thriving and contributing to the well-being of their community. For governing authorities, such as school boards and charter sponsors, the report card shines a light on the strengths and weaknesses of the schools they are responsible for overseeing. And, finally, as we are reminded during challenging times like this, it can help public officials identify schools in need of extra help and resources.

Because of the many roles it plays, it’s essential that Ohio get it right when designing a report card. The current report card has some important strengths and has even drawn national praise from the Data Quality Campaign and the Education Commission of the States. Nevertheless, there are facets of the report card that can and should be improved. Fordham published a report in 2017, Back to the Basics, calling for a variety of reforms to Ohio’s report card framework including simplifying it and making it fairer to schools serving high percentages of economically disadvantaged students.

As you consider how to improve the report card, we urge you to keep four principle-based questions at the forefront.

  1. Does the report card support equity and ensure high expectations for all students and that each student counts?

  2. Does the report card advance transparency and offer parents and communities clear, simple, honest information about school performance?

  3. Is the report card fair and does it give every school the opportunity to demonstrate growth and improvement?

  4. Is the report card accurate and ensure components are measuring what is intended?

SB 145 significantly reworks the state report card framework. What follows is a summary of the most important changes with a short analysis of how they adhere to the principles that I’ve described.

  • Switching to a star rating system: While Fordham remains a fan of the simplicity and transparency inherent in using A to F grades, we recognize that a state system that views a “C” as average performance creates a disconnect for families that often view a “C” on a student’s report card as a time to intervene. For that reason alone, a shift makes sense. The adoption of a 5-star framework is an excellent alternative. It benefits from being widely used to rate preschools, hospitals, and even products and services on Amazon and Yelp. This is a huge advantage when compared to text-based descriptors that can be either misleading or hard to understand in districts like Columbus where families speak dozens of languages. A 5-star rating system is simple and maintains transparency.

  • Maintaining, but modifying, the overall rating: Akin to a GPA, an overall rating offers a broad sense of performance by combining results from disparate report card measures. It focuses public attention on the general academic quality of a school contributing to both transparency and fairness. In contrast, a system without a final rating risks misinterpretation. It enables users to “cherry pick” high or low component ratings that, when considered in isolation, could misrepresent the broader performance of a school. SB 145 goes a step farther to increase the usefulness of overall grades by ensuring that student growth—a measure fairest to high poverty schools—will never be less than 25 percent of a school or district’s overall grade. It also introduces half-stars to provide for greater differentiation in the overall ratings.

  • Reducing the number of graded components: Simplicity when presenting ratings is critical for a report card to be useful. Report cards for school districts currently have 15 different grades. When you grade too many things, you diminish the value and usefulness of every measure. SB 145 slashes the number of graded measures to six components and one overall grade.

  • Adding context to every graded measure: While already using a well understood 5-star rating system, SB 145 goes a step further to add even more context to the ratings. It calls for the inclusion of text descriptions to supplement rather than supplant the star system, colors to add clarity so that a 3-star rating will be shaded green helping to ensure communities understand it represents acceptable performance and doesn’t come with a negative connotation, and trend arrows to show within a component if a school’s performance is improving or declining. These changes will make the report card fairer and more accurate by increasing the context around the ratings.

The changes just described focused on the overall report card framework. Next, I’ll dive into some of the changes surrounding the individual report card components. These are critical improvements, because poorly structured components feed into the overall rating and harm public confidence in the report card.

  • Streamlining the achievement measure: SB 145 eliminates the indicators met component and bases the rating solely on performance index. This simplifies the measure and contributes to equity because the performance index doesn’t just give a school credit when a student “passes” a state assessment but also when students achieve above and beyond the proficiency mark. It properly keeps the focus on every student reaching his or her potential. Some have advocated for a sixth category under performance index. We oppose doing that. It would ruin long-term comparability and could require increasing the length of state assessments.

  • Changing value-added (student growth): SB 145 makes a couple of changes to the value-added component that should increase fairness. First, it shifts to a 3-year weighted average when calculating growth which ensures that one bad year won’t sink a school’s rating. It also eliminates the current demotion when one individual student group doesn’t perform well. Importantly, the performance of student groups will still impact a school’s rating but will be a part of the equity measure.

  • Adds additional data around graduation ratings: The bill doesn’t make major changes to the graduation rate component as its structure is generally locked-in by federal requirements. It does provide additional context by disclosing how many students with disabilities are continuing their K-12 education—consistent with law that allows them to remain a student until age 22.

  • Shifting from gap closing to equity: SB 145 reworks the component known as gap closing and renames it equity. The current gap closing component allows schools to earn credit when a student group hits either performance index or value-added goals. This creates a very real risk that the academic performance of a student group could be hidden and the group won’t get the supports and resources it deserves to make strong academic progress. The equity component under SB 145 requires that both achievement and growth for each student group, not one or the other, are factored into the rating. This will enhance the overall focus on equity in the system.

  • Restructuring the Early Literacy measure: At-Risk K-3 Readers, the current early literacy component, is one of the most criticized elements of the report card. It focuses solely on the percent of a school’s struggling readers that it helps to catch up. This opens the door for situations where 90 percent of a school’s students read on grade level, but the school receives a low rating for helping its struggling readers. SB 145 tackles this issue by basing half of a school’s rating on the critical task of helping struggling readers to make progress. The other half though is based on the percent of third graders who demonstrate reading proficiency. By considering both improvement and overall performance, the new early literacy measure is fairer to all schools and supports equity by maintaining an emphasis on the importance of all students learning to read. This committee has heard calls for this measure to be based on the promotion rate associated with the third-grade reading guarantee. That would be a huge step backward. Ohio currently has a third-grade promotion rate of 95 percent but a proficiency rate on the third-grade reading assessment of only 67 percent. Success must continue to focus on third-graders reading on grade level. The measure in SB 145 does just that.

  • Overhauling prepared for success: Early literacy may be criticized, but many in the education community despise the prepared for success component. Their concerns are not unfounded: The measure was constructed too narrowly and had an overly ambitious—perhaps even unrealistic—grading scale attached to it. That being said, it’s probably the most important measure on the state report card. It looks beyond state test scores—something we’d all like to do—to determine how ready young adults are when they leave high school. For transparency and accuracy purposes, this component should be reformed. But it shouldn’t be abandoned. SB 145 does just that. It eliminates the current two-tier bonus structure, greatly expands the ways students can demonstrate readiness for college and career, and gives credit to schools and districts for year-to-year improvement. The new measure will be fairer to schools, especially those with low baseline readiness rates, while also supporting equity by maintaining high expectations for all students.

Through its adherence to the principles of equity, transparency, fairness, and accuracy, SB 145 would create a state report card that reinforces a key tenet of education policy. Namely, that all students—given the proper support—can learn and achieve at high levels. We urge this committee to support this important piece of legislation.

Thank you for the opportunity to provide testimony. I’m happy to answer any questions that you may have.

view
Chad Aldis HB 110 Testimony for Senate Finance 5-17-21 image

Testimony provided before the Senate Finance Committee on HB 110—5/17/21

Chad L. Aldis
5.17.2021
Ohio Gadfly Daily

NOTE: Today, the Ohio Senate’s Finance Committee heard testimony on HB 110, the state’s biennial budget. Fordham’s Vice President for Ohio Policy provided interested party testimony on education provisions in the bill. These are his written remarks.

My name is Chad Aldis, and I am the Vice President for Ohio Policy at the Thomas B. Fordham Institute. The Fordham Institute is an education-focused nonprofit that conducts research, analysis, and policy advocacy with offices in Columbus, Dayton, and Washington, D.C. Our Dayton office, through the affiliated Thomas B. Fordham Foundation, is also a charter school sponsor.

As usual, this year’s budget contains a mix of policy and more traditional budgetary changes. My remarks today will highlight a couple of policy concerns we have. Before digging into those, I’ll offer a few brief thoughts on the proposed new school funding formula.

School Funding Changes

Fordham has long argued for some of the key components of the House’s school funding formula. This includes ending caps and guarantees, direct funding school choice programs, and—most importantly—funding schools via a functioning formula. We commend the House on its work to develop its funding plan. That being said, we continue to have a few concerns.

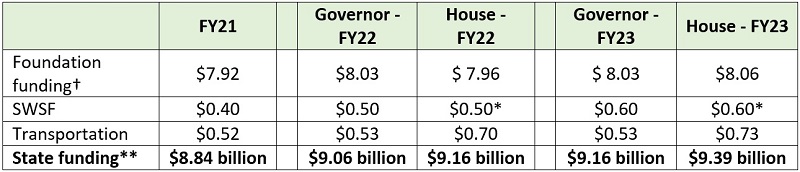
First, proponents of HB 110 espouse ending guarantees but actually codify three separate guarantees. Guarantees subvert a properly functioning formula. Second, tying the base cost to 2018 salaries keeps the costs artificially “lower” now, but this decision will put tremendous pressure on future general assemblies to significantly boost spending as we get further and further away from 2018. Complicating matters, the more districts independently decide to increase salaries, the higher the average salary climbs and the more state dollars they’ll generate. Finally, as the table below indicates, while the House concluded that the state needs to spend an additional $1.8 billion on education, it didn’t really make much of a down payment on those costs. Relative to the Governor’s plan, the House raises state education funding by roughly $100 million in FY 2022 and $230 million in FY 2023. Most of those dollars go into transportation rather than into the classroom.

An overview of state education funding, current and proposed (in billions)

Chad Aldis HB 110 testimony for Senate Finance figure 1​

*In the House plan, the Student Wellness and Success Funds remain a standalone line item, but are used to fund an increase in the economically-disadvantaged component of the funding formula and the SEL portion of the base cost model. **This excludes federal and local dollars, various smaller state expenditures (e.g., educator licensing and assessments), and money for K–12 education not funded via ODE budget (e.g., school construction dollars and property tax reimbursements). † This includes the additional $115 million that was included in the omnibus amendment to the House budget.

This creates considerable uncertainty about how this funding model can be sustained over the long run.

Education Policy Changes

  • Quality community school support fund. Two years ago, Ohio adopted this first-of-its-kind program that provides additional funding of up to $1,750 for economically disadvantaged students attending high-performing charter schools. These supplemental funds help to narrow chronic funding gaps, build the capacity of successful schools to serve more kids, and incentivize continued improvement in charter school performance. As more schools qualified in year two, the per-pupil funding amounts dropped to just over $1,000 per pupil. Governor DeWine increased the program appropriation to $54 million per year in the executive budget. We urge you to fully fund this important initiative either by restoring the funds that the governor appropriated or making it a permanent part of the charter school funding framework.

  • Broader charter school changes. Thanks to the leadership of this body and the charter school community, students attending brick and mortar charter schools in Ohio now academically outperform similar students attending traditional public schools. The quality community school support fund is a good start to ensuring that our state’s best charter schools have the ability to grow and provide more opportunities to students. Some other changes that we’d recommend include increasing the facility funding for charter schools to $750 per pupil (from $250). A recent study found that Ohio was only meeting 18 percent of the facility needs faced by charter schools. The result is that dollars meant for teaching and learning must be rerouted to pay for buildings. Making it easier for charters to access both unused district facilities and favorable financing rates would also help address the issue. Given the improvements in the sector, we also recommend that the geographic limitations on where charter schools are allowed to open be lifted. Finally, we urge you to reject House changes that would roll back charter school accountability by resetting the default closure rule for poorly performing charter schools and putting the 72-hour rule on hold for next school year. 

  • Graduation requirements. After many years of debate, the legislature passed new less test-focused graduation requirements last year. HB 110 makes a number of clarifying changes to the graduation requirements and most are okay, but the changes around graduation seals would be a huge setback. Seals were created to supplement the existing diploma requirements and allow students to show mastery or deeper engagement in specific areas. The bill modifies the citizenship and science seals to give them to any student who simply passes a class in the subject area with a B or better. Currently, a student needs to pass an EOC, AP, or IB exam (or pass a College Credit Plus course) to demonstrate a deeper learning of government or science. By awarding a seal for passing required classes, HB 110 would eviscerate any potential benefit seals were supposed to have. It would be preferable to simply eliminate the seals requirement and the accompanying bureaucracy altogether than to make them meaningless.

  • ACT/SAT requirement for juniors. HB 110 eliminates the universal administration of the ACT or SAT to all high school juniors. Starting with the class of 2018, current law ensures that all young people have at least one opportunity to take these exams. Before this requirement, only 16 percent of Lorain students took the ACT or SAT. In Lima, it was a mere 36 percent. How many students who skipped these tests could’ve gone on to earn post-secondary credentials and degrees? This isn’t about accountability. It’s about opening doors to our most disadvantaged students. Taking the ACT or SAT exams should be retained as a requirement for all juniors.

  • Report card reform. We urge you to add Senate Bill 145, Chair Brenner’s comprehensive retooling of Ohio’s state report card, into HB 110. The bill incorporates the work of a diverse group of stakeholders into a well-vetted plan that would result in a report card that supports equity, fairness, transparency, and accuracy. It would be a huge step forward. While I’m generally reluctant to add such proposals to the state budget, time is critical in this case. To be fair to schools and districts, if report cards are going to be reformed, it needs to be done before this body breaks for the summer. When school starts in the fall, expectations must be clear. 

Thank you for the opportunity to provide testimony. I’m happy to answer any questions that you may have.

Fordham Logo

© 2026 The Thomas B. Fordham Institute
Privacy Policy
Usage Agreement

National

P.O. Box 110
Burke, VA 22009

202.223.5452

[email protected]

Ohio

P.O. Box 82291
Columbus, OH 43202

614.223.1580

[email protected]

Sponsorship

130 West Second Street, Suite 410
Dayton, Ohio 45402

937.227.3368

[email protected]