Few topics in K–12 education spark as much debate as the role of technology in schools. A cell phone in every pocket, a Chromebook in every backpack, and AI that keeps getting smarter: tech is everywhere in today’s classrooms.
But what do students themselves think? To dive deeper, we commissioned a nationally representative survey of more than two thousand current and recent high school students. Fordham’s national research manager, Brian Fitzpatrick, led the analysis and authored the report. His findings show that school-issued devices are often misused, making them nearly as distracting as students’ personal cell phones. Combine that with unethical use of AI and rampant grade inflation, and we’ve sadly hollowed out the American high school experience.
Technology isn’t the enemy here. But the findings suggest we need far less of it in today’s high schools.
Download the full report or read it below.
Foreword
By Amber M. Northern and Michael J. Petrilli
After years of mounting concern about students and screens, the techlash came to a head in June when the Los Angeles Unified School District made headlines for approving a new screen-time policy for students.
The policy is blunt by design. It limits students’ school-assigned screen time on district-issued devices (such as laptops and tablets),[1] counting both in-school use and homework. Students in pre-K through first grade cannot use school devices for instruction at all, while older elementary students are limited to 60 minutes per day. Middle and high schools have subject-specific limits; for example, high schoolers may spend no more than 90 minutes per subject per week on screens, up to a weekly maximum of 600 minutes.
Opinions were mixed on whether LAUSD got it right. Some welcomed the limits, while others thought tech deserved a more nuanced accounting of its virtues.
Yet whatever one thinks of America’s second-largest school district’s attempt to rein in the downsides of technology, one thing is clear: LAUSD tapped into the national zeitgeist. Weary of children transfixed by devices, isolated from peers and adults alike, district leaders responded to parental pressure and essentially said, “Enough is enough! There has to be a better way.”
Though we might quibble about the details, we at Fordham agree with the impulse. It sure seems, from the outside, that technology has transformed the school experience, especially during high school, and not necessarily for the better. But to find out for sure, we decided to ask the kids themselves. We wanted to know whether students see technology as useful to their learning—or whether they’re weary of tapping keys and scrolling screens. (Some recent polls pointed to the latter.)
We also wanted their sense of just how pervasive technology use is in schools and what misuse on their part might look like. More specifically, how have school-issued devices contributed to distraction and academic dishonesty? How do grading policies and artificial intelligence exacerbate those challenges? And most important, what can schools do now—long after the genie has left her proverbial bottle—to preserve the benefits of technology and AI while reducing their harms?
To answer these questions, we conducted a nationally representative survey of 1,011 current high school students and 1,013 recent graduates. Impact Research and UpONE Insights fielded the survey and Fordham’s national research manager, Brian Fitzpatrick, led the analysis and report writing.
The investigation yielded four big findings:
First, illicit tech use is rampant.
Seventy-six percent of respondents report personally engaging in at least one form of illicit technology use daily during high school, including scrolling social media, messaging friends, and shopping or gambling online (Figure F-1). Roughly one-third report daily YouTube viewing or recreational gaming, while more than one in five say they use AI without permission.
Figure F-1. Taken together, 76 percent of respondents report some kind of daily illicit tech use during high school.
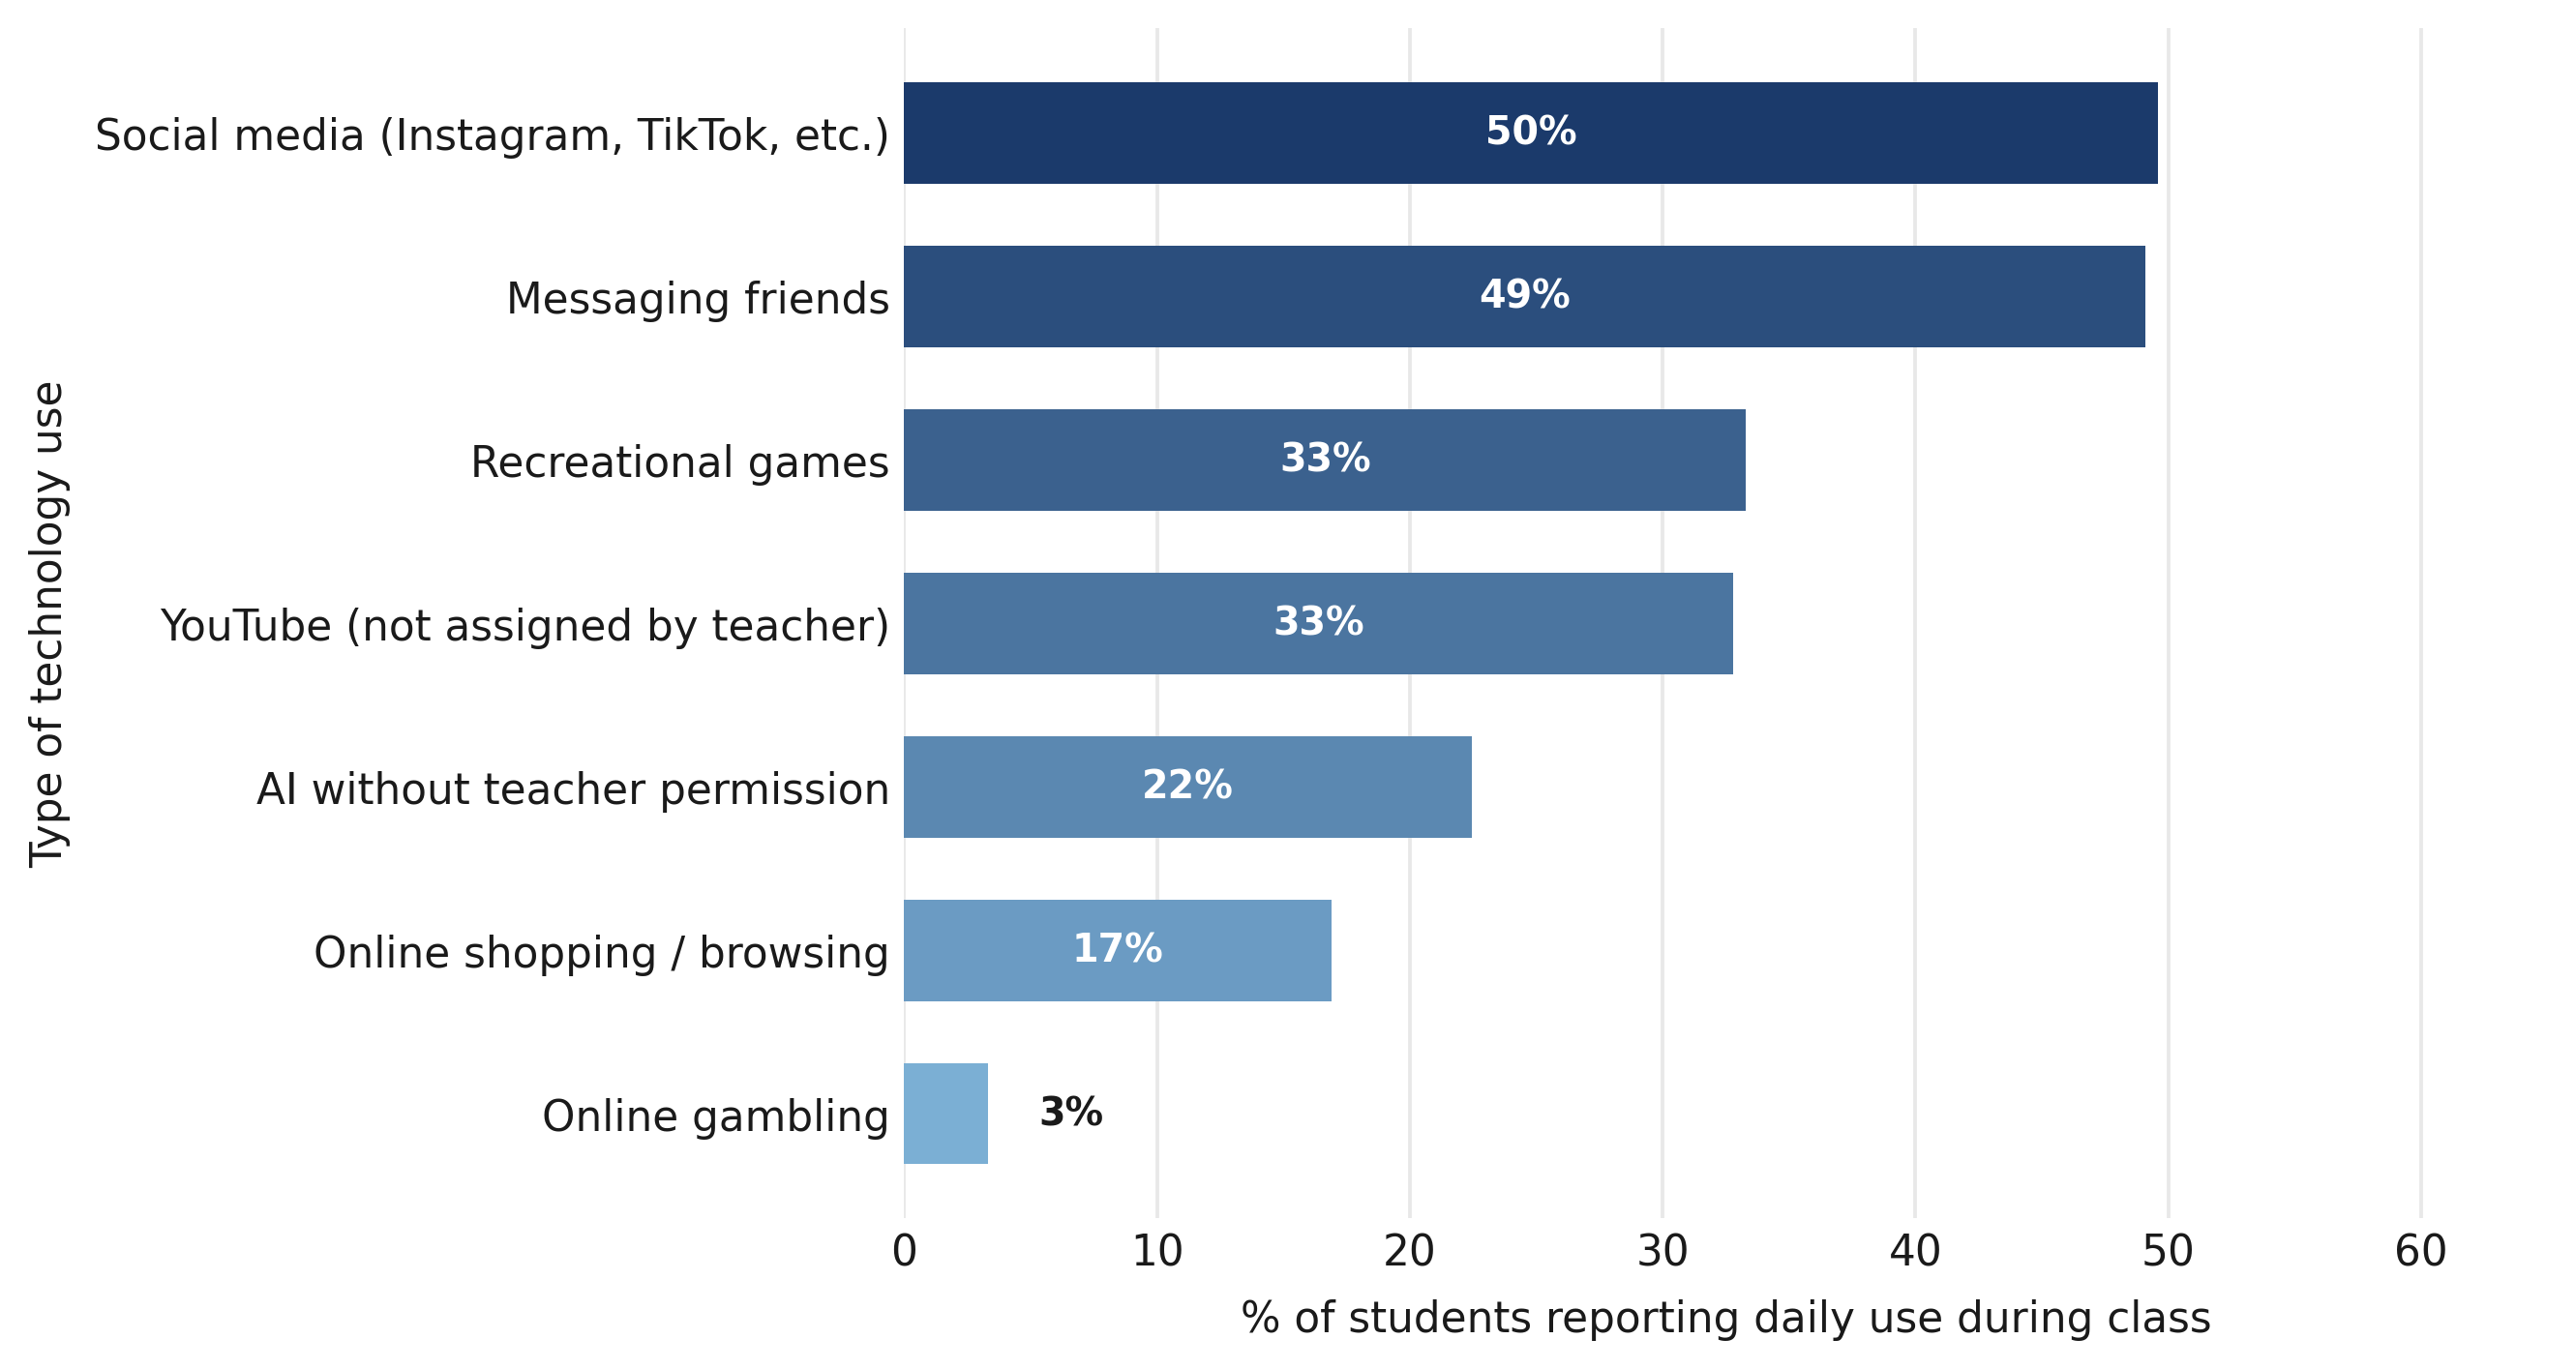
Note: Each bar represents the percent of respondents who report that they use each technology “multiple times a day” or “once a day” during school hours. Because respondents could select all that apply, the 76% figure reflects the share who reported at least one of these behaviors daily.
Second, AI is undermining the high school experience.
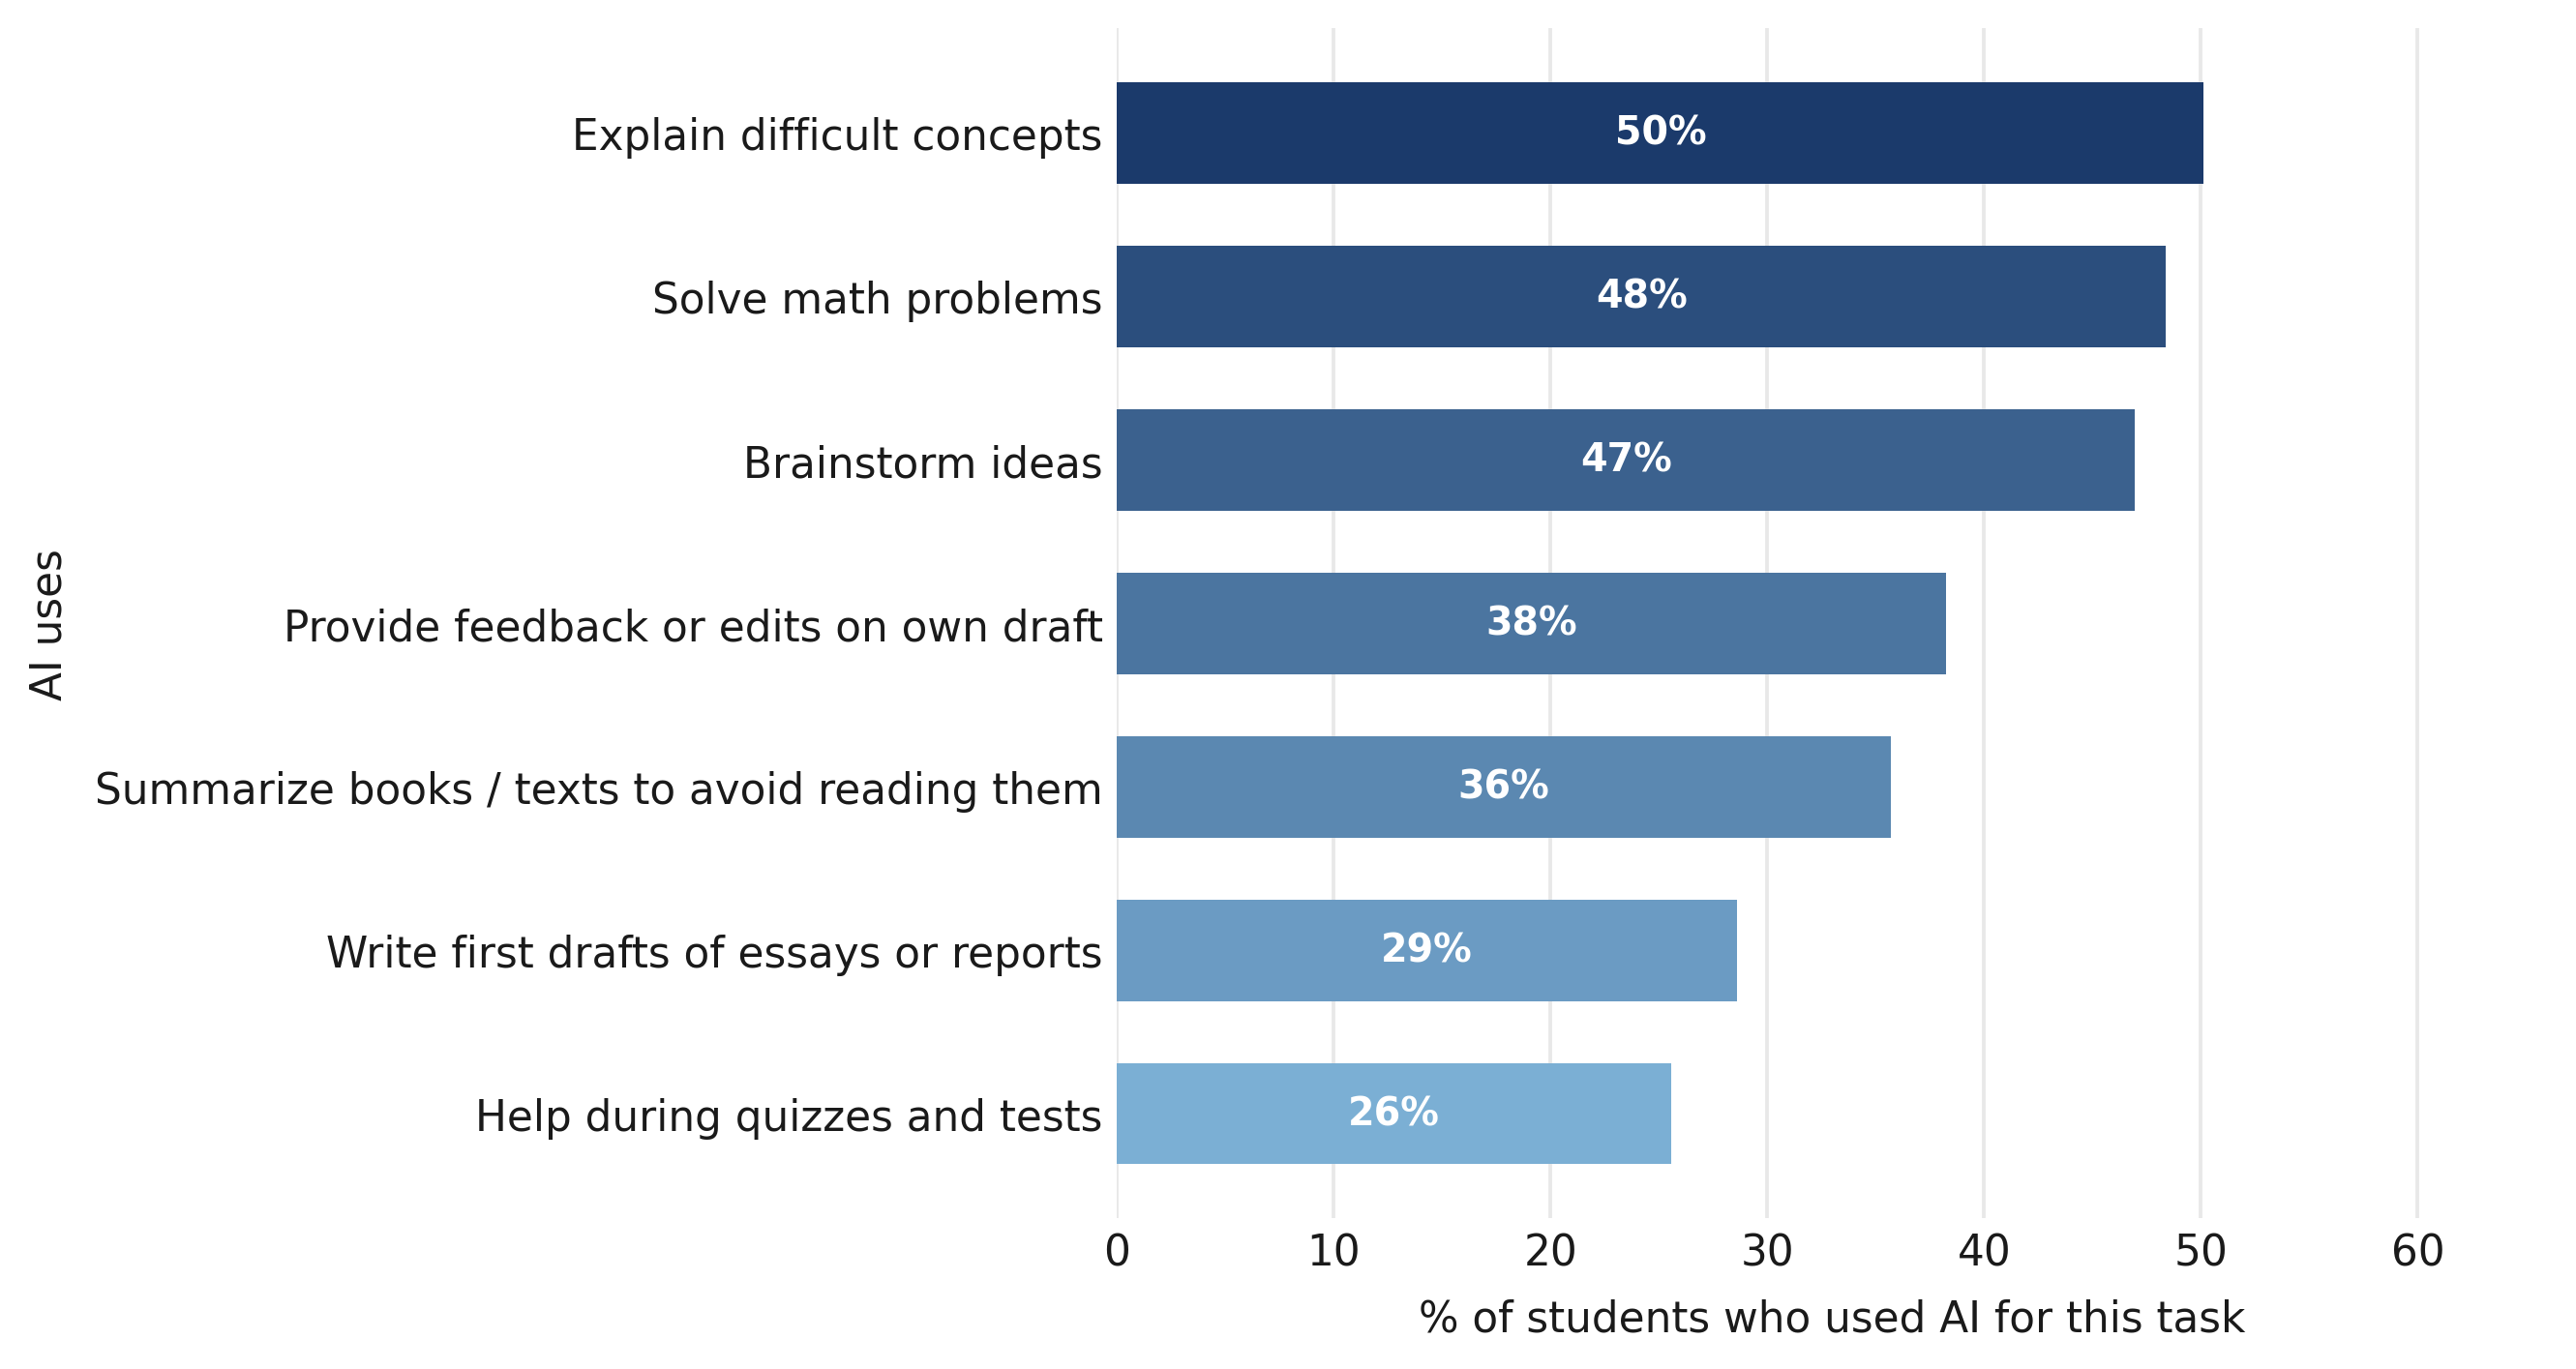
Many students are using AI not to support their learning but to bypass it altogether (Figure F-2). While roughly half of respondents say they use AI to explain difficult concepts and brainstorm ideas, that same proportion say they use it to “solve math problems.” One-third (36 percent) use it to summarize books or other texts to avoid reading them, 29 percent to write the first draft of an essay or report, and 26 percent to help during quizzes or tests. Lest the point be missed: those uses sound an awful lot like cheating.
Figure F-2. The most common uses of AI are legitimate, but many students also use it to cheat.
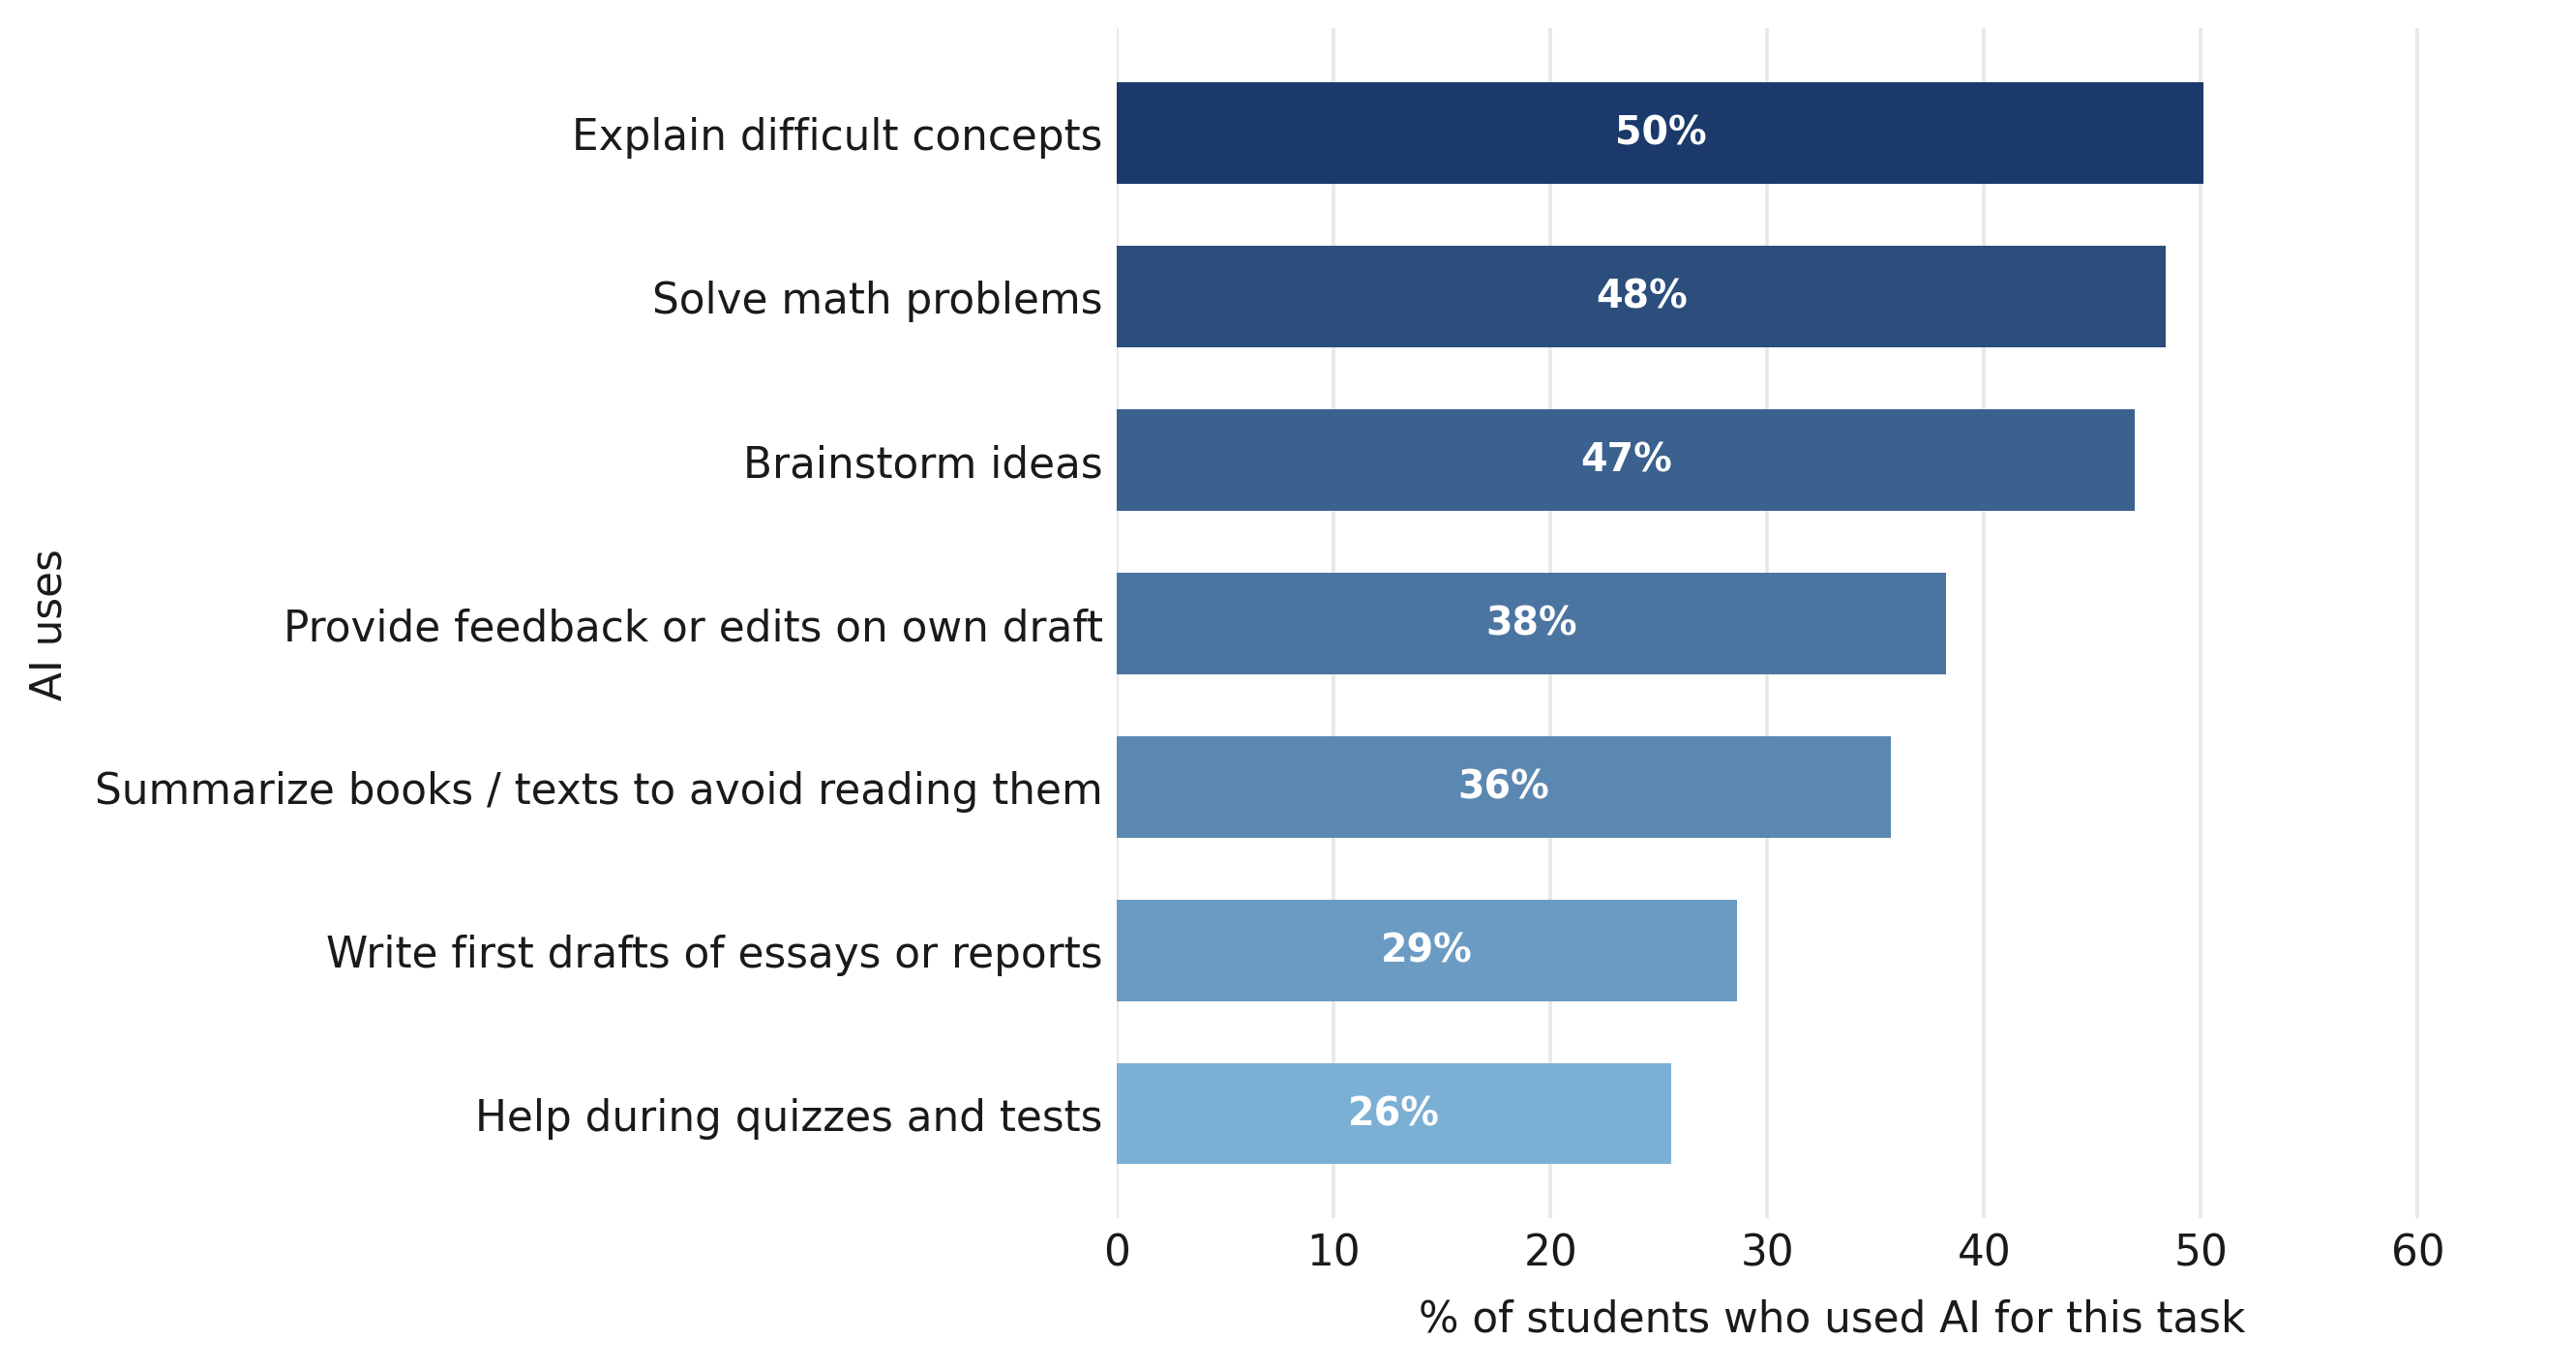
Note: Percentage of respondents who report using AI for each task during high school.
Third, most U.S. high school students and recent graduates say they spend the majority of class time on school-provided devices.
Illicit use and sanctioned use are hard to tell apart. When so much of the school day runs through screens, it becomes difficult for teachers to know whether a student is completing an assignment or scrolling TikTok.
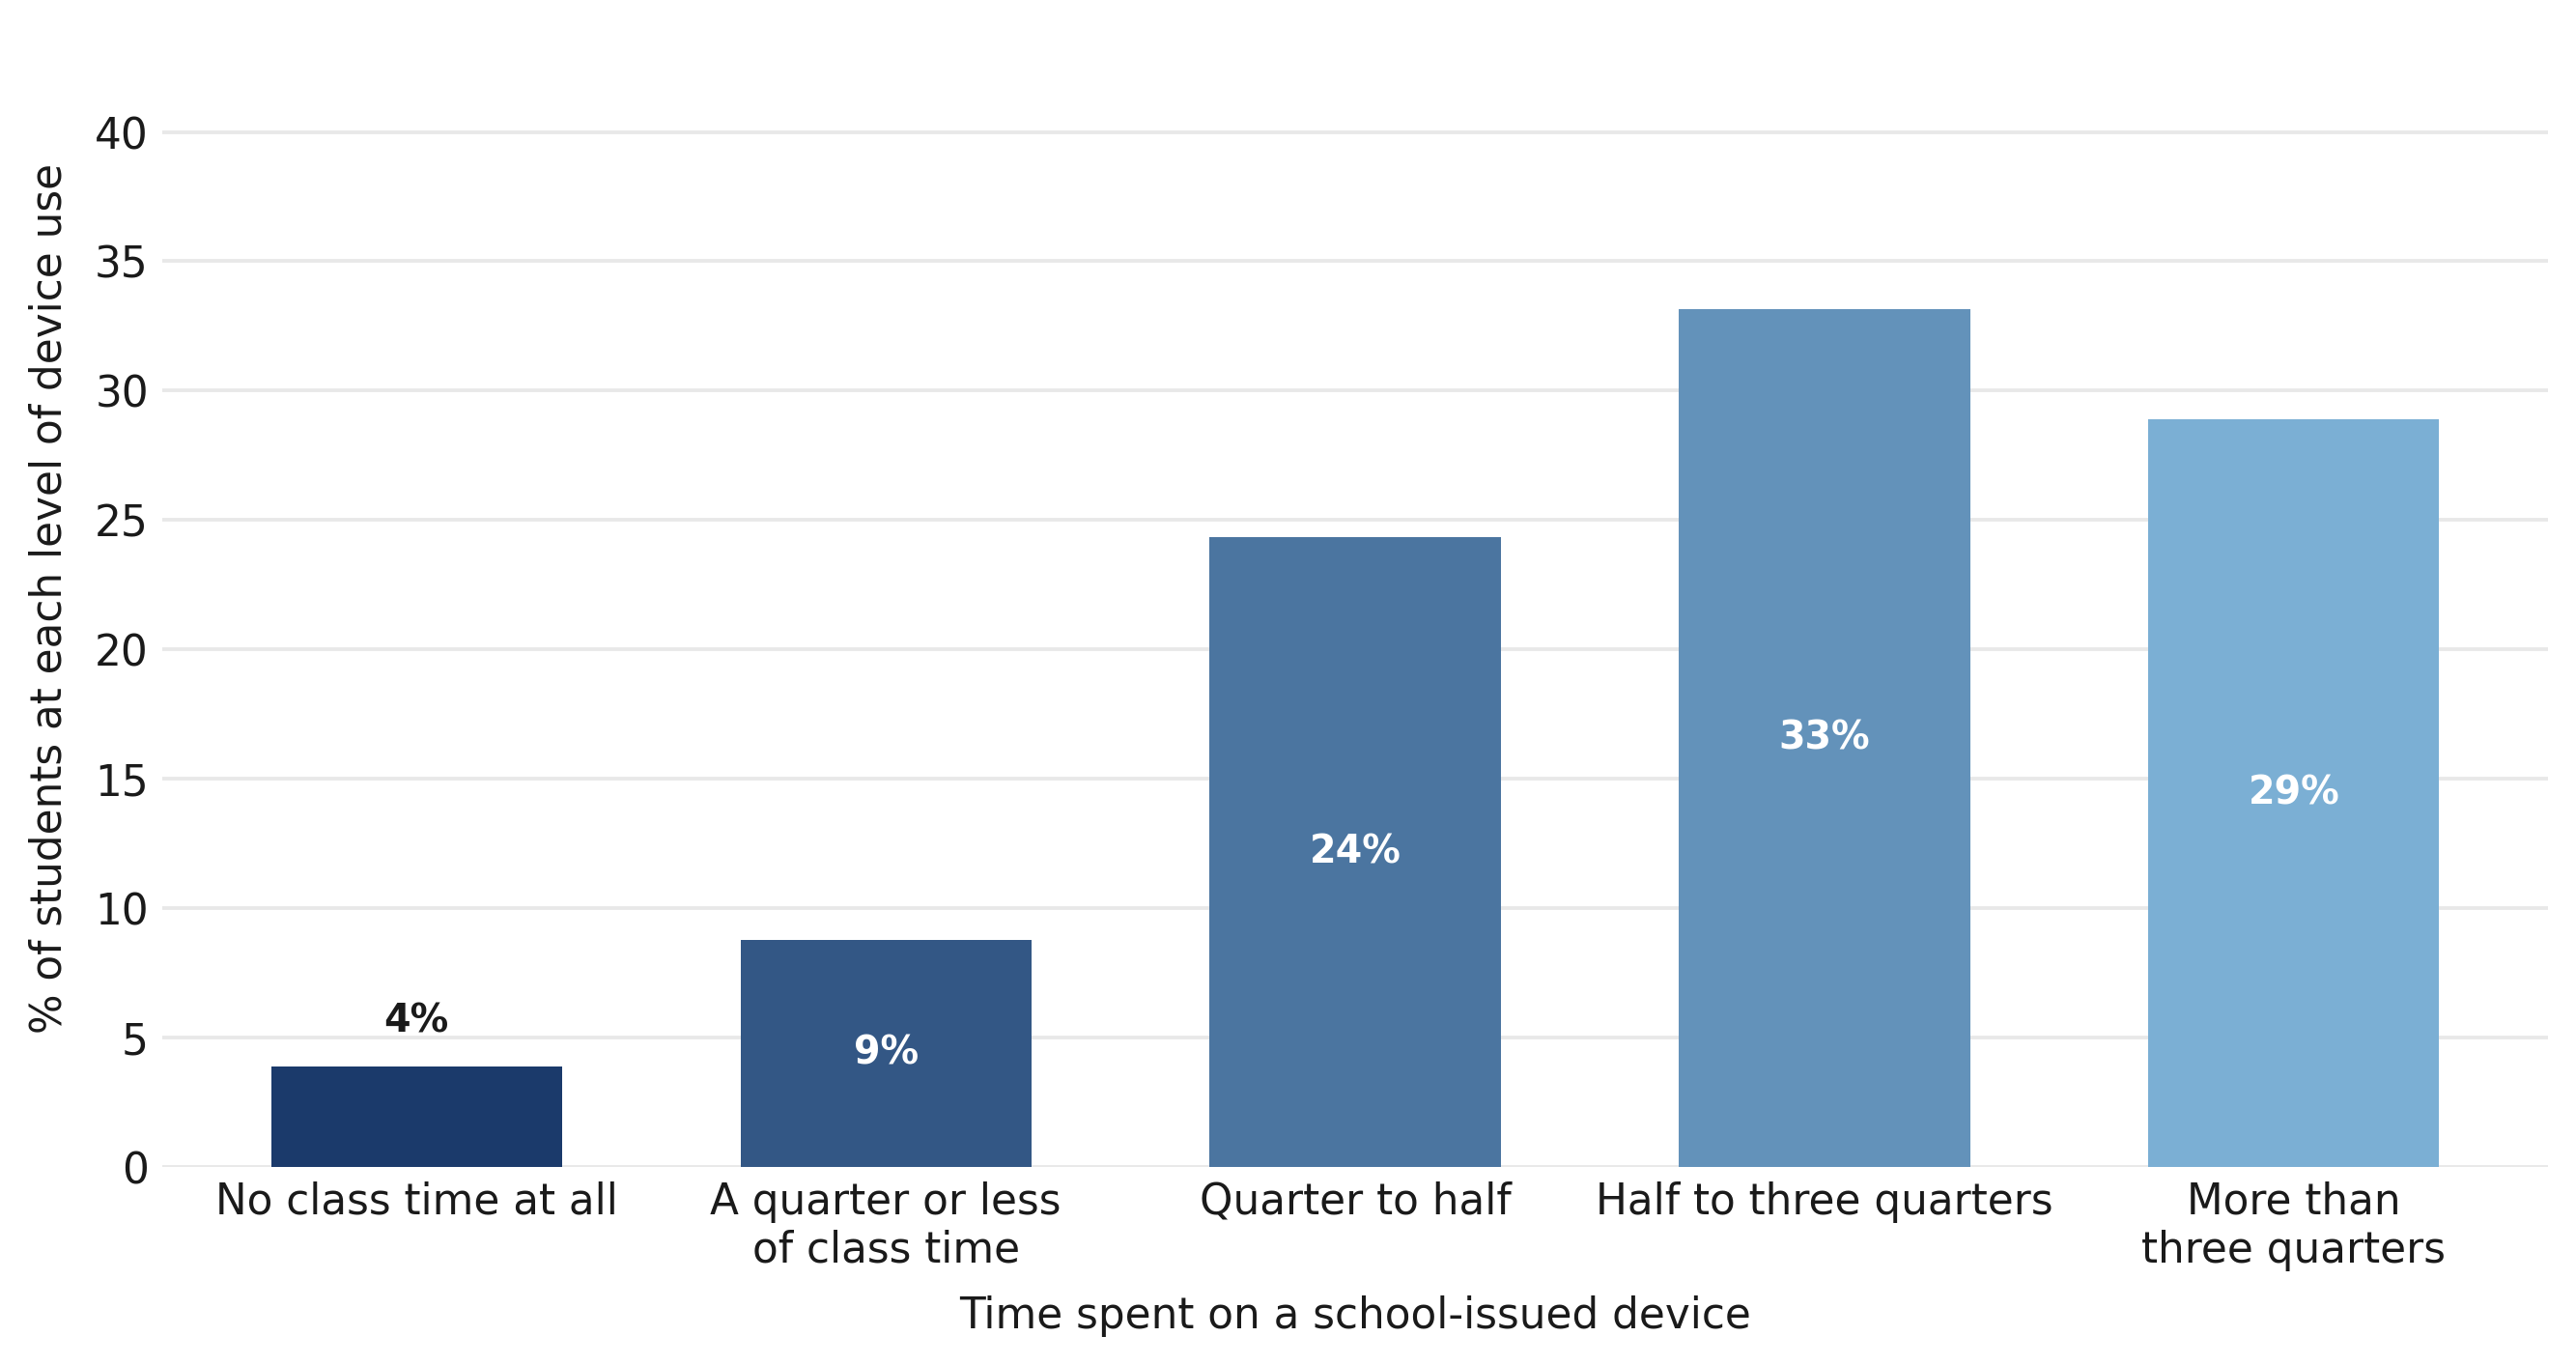
Figure F-3 reveals that 62 percent of respondents spend more than half of their in-class time on school-issued devices. Let’s compare that to the new screen limits in Los Angeles. Under a typical six-hour school day, LAUSD’s cap would allow high school students to spend no more than about one-third of instructional time on screens. Based on our survey data, however, a student who spends at minimum half of class time on a school-issued device would log 900 minutes per week in this hypothetical schedule—50 percent more than LAUSD’s 600-minute weekly limit, and that’s not including doing homework on school devices.
Figure F-3. Most respondents report spending between half and three quarters of their school day on a school-issued device.
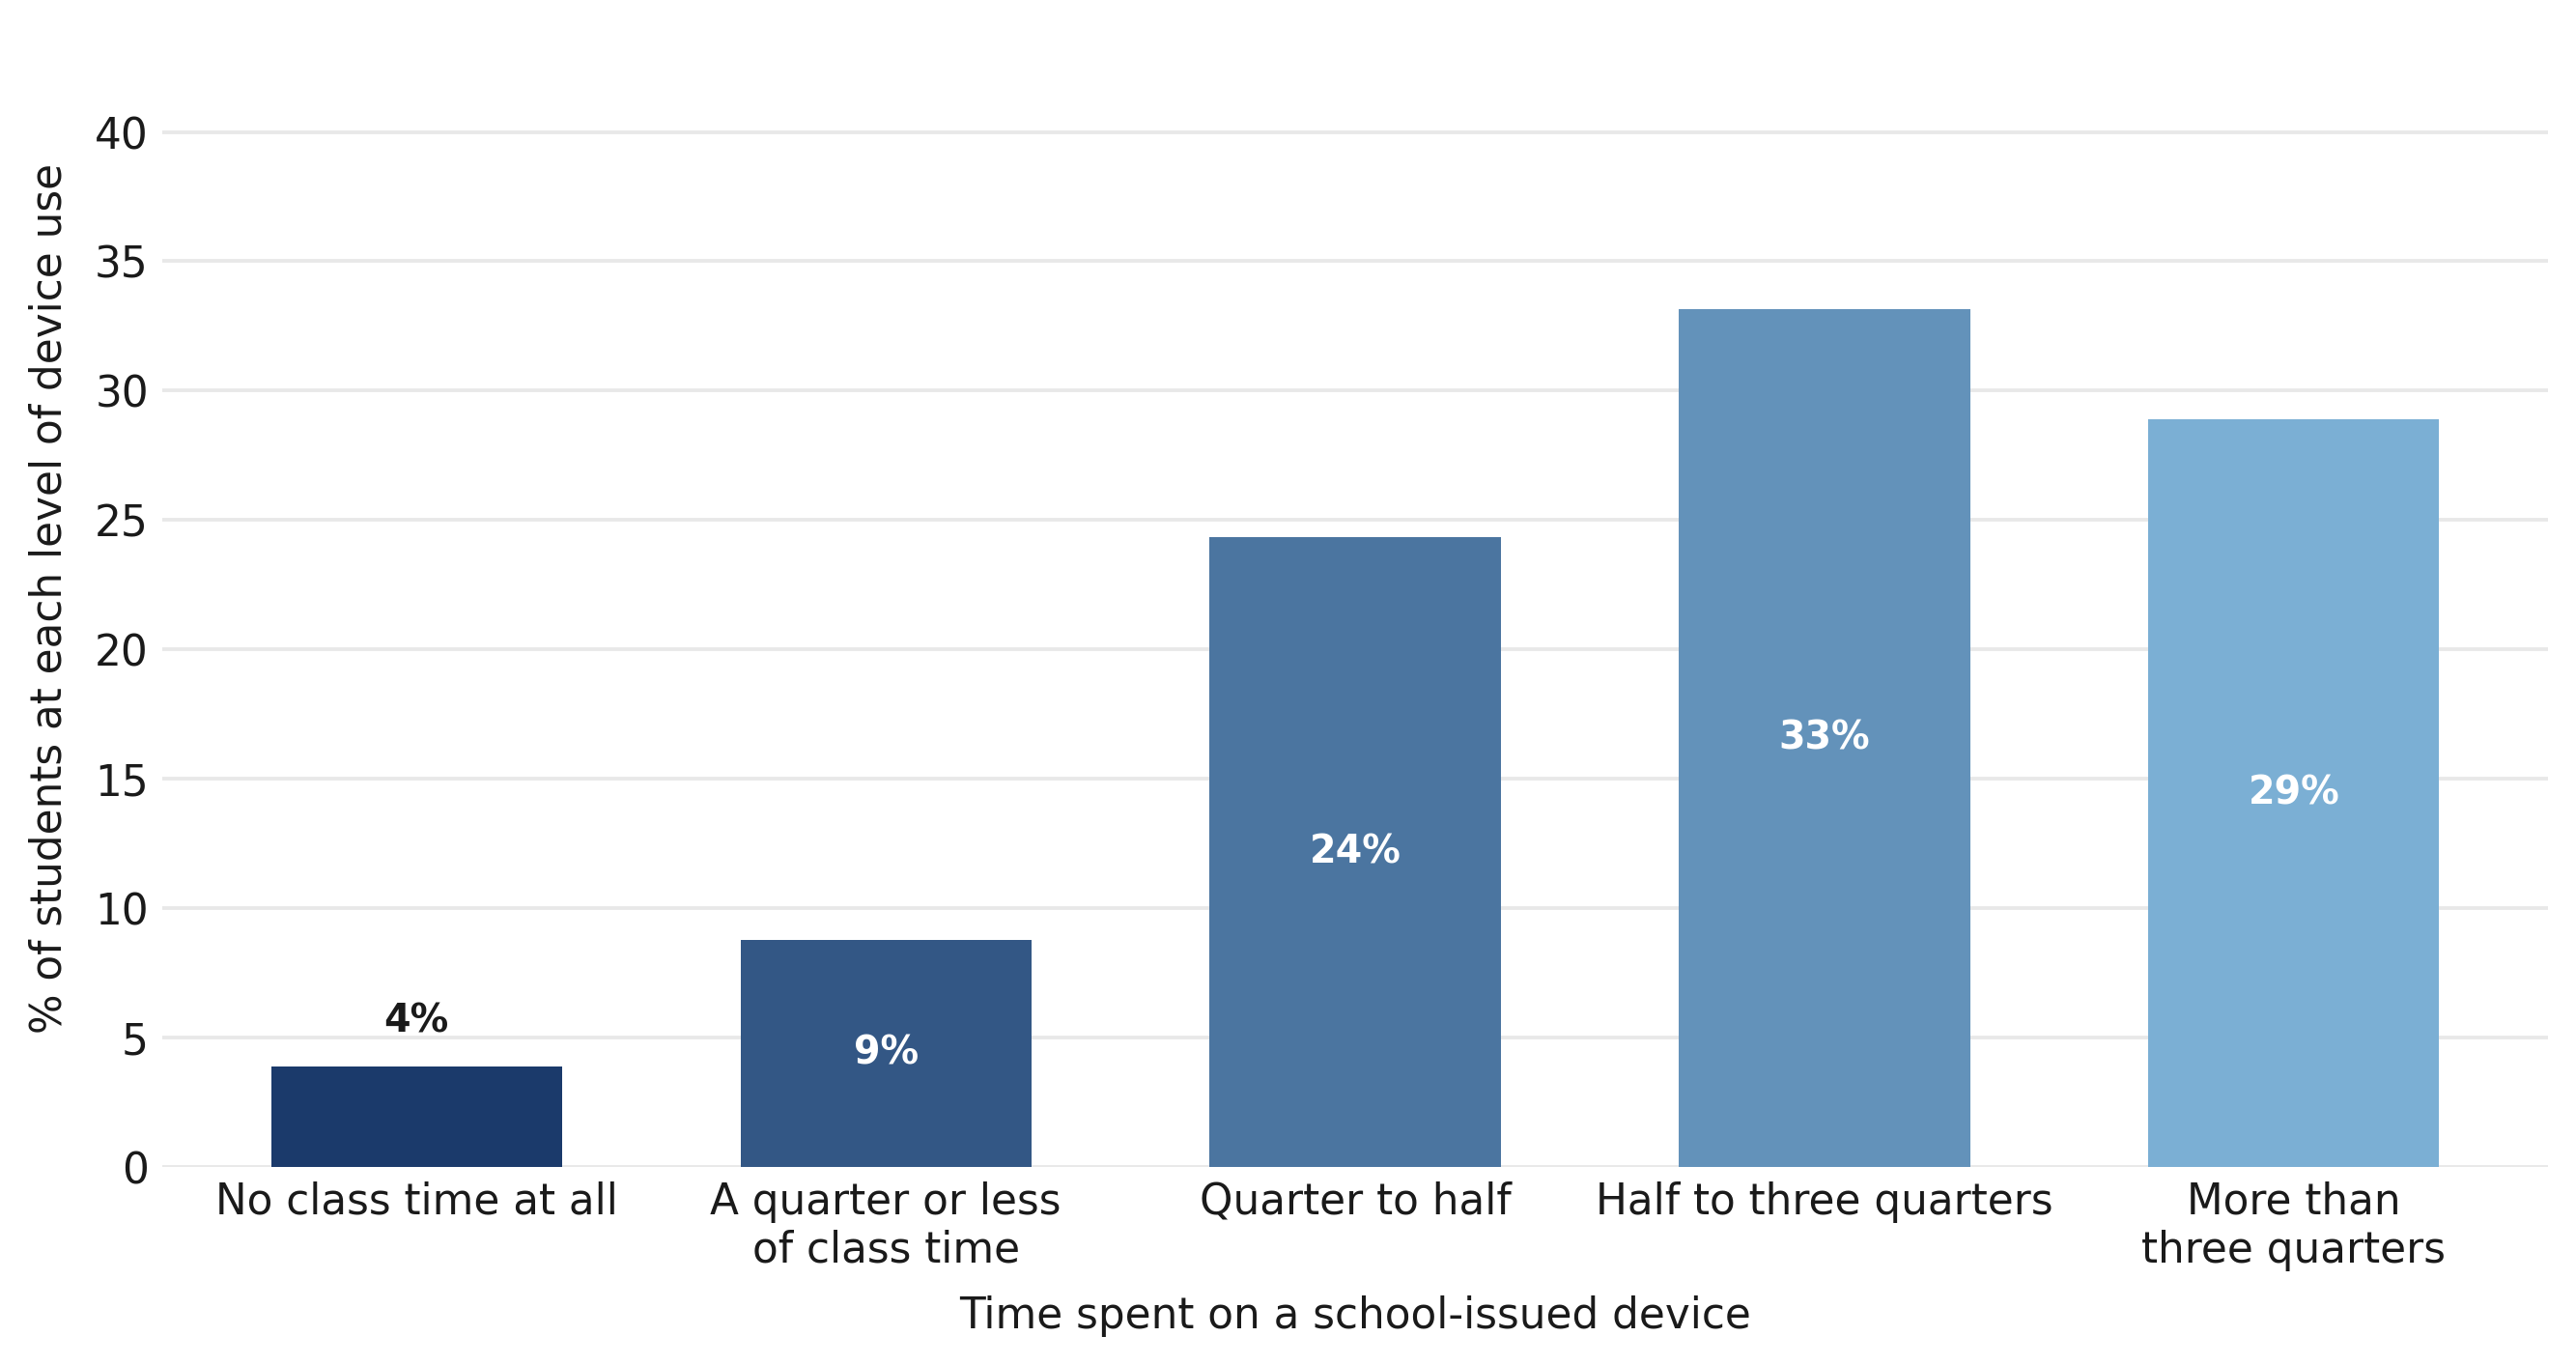
Note: Bars represent the percent of respondents across self-reported levels in response to the question, “In a typical day, how much of your class time do/did you spend working on a device provided by your high school, such as a laptop or tablet?”
Finally, weak grading standards make distraction and AI misuse worse.
Many respondents report grading practices that lighten the consequences of not doing the work: partial credit for missing assignments, late-work policies that result in little penalty, and broad access to test retakes.
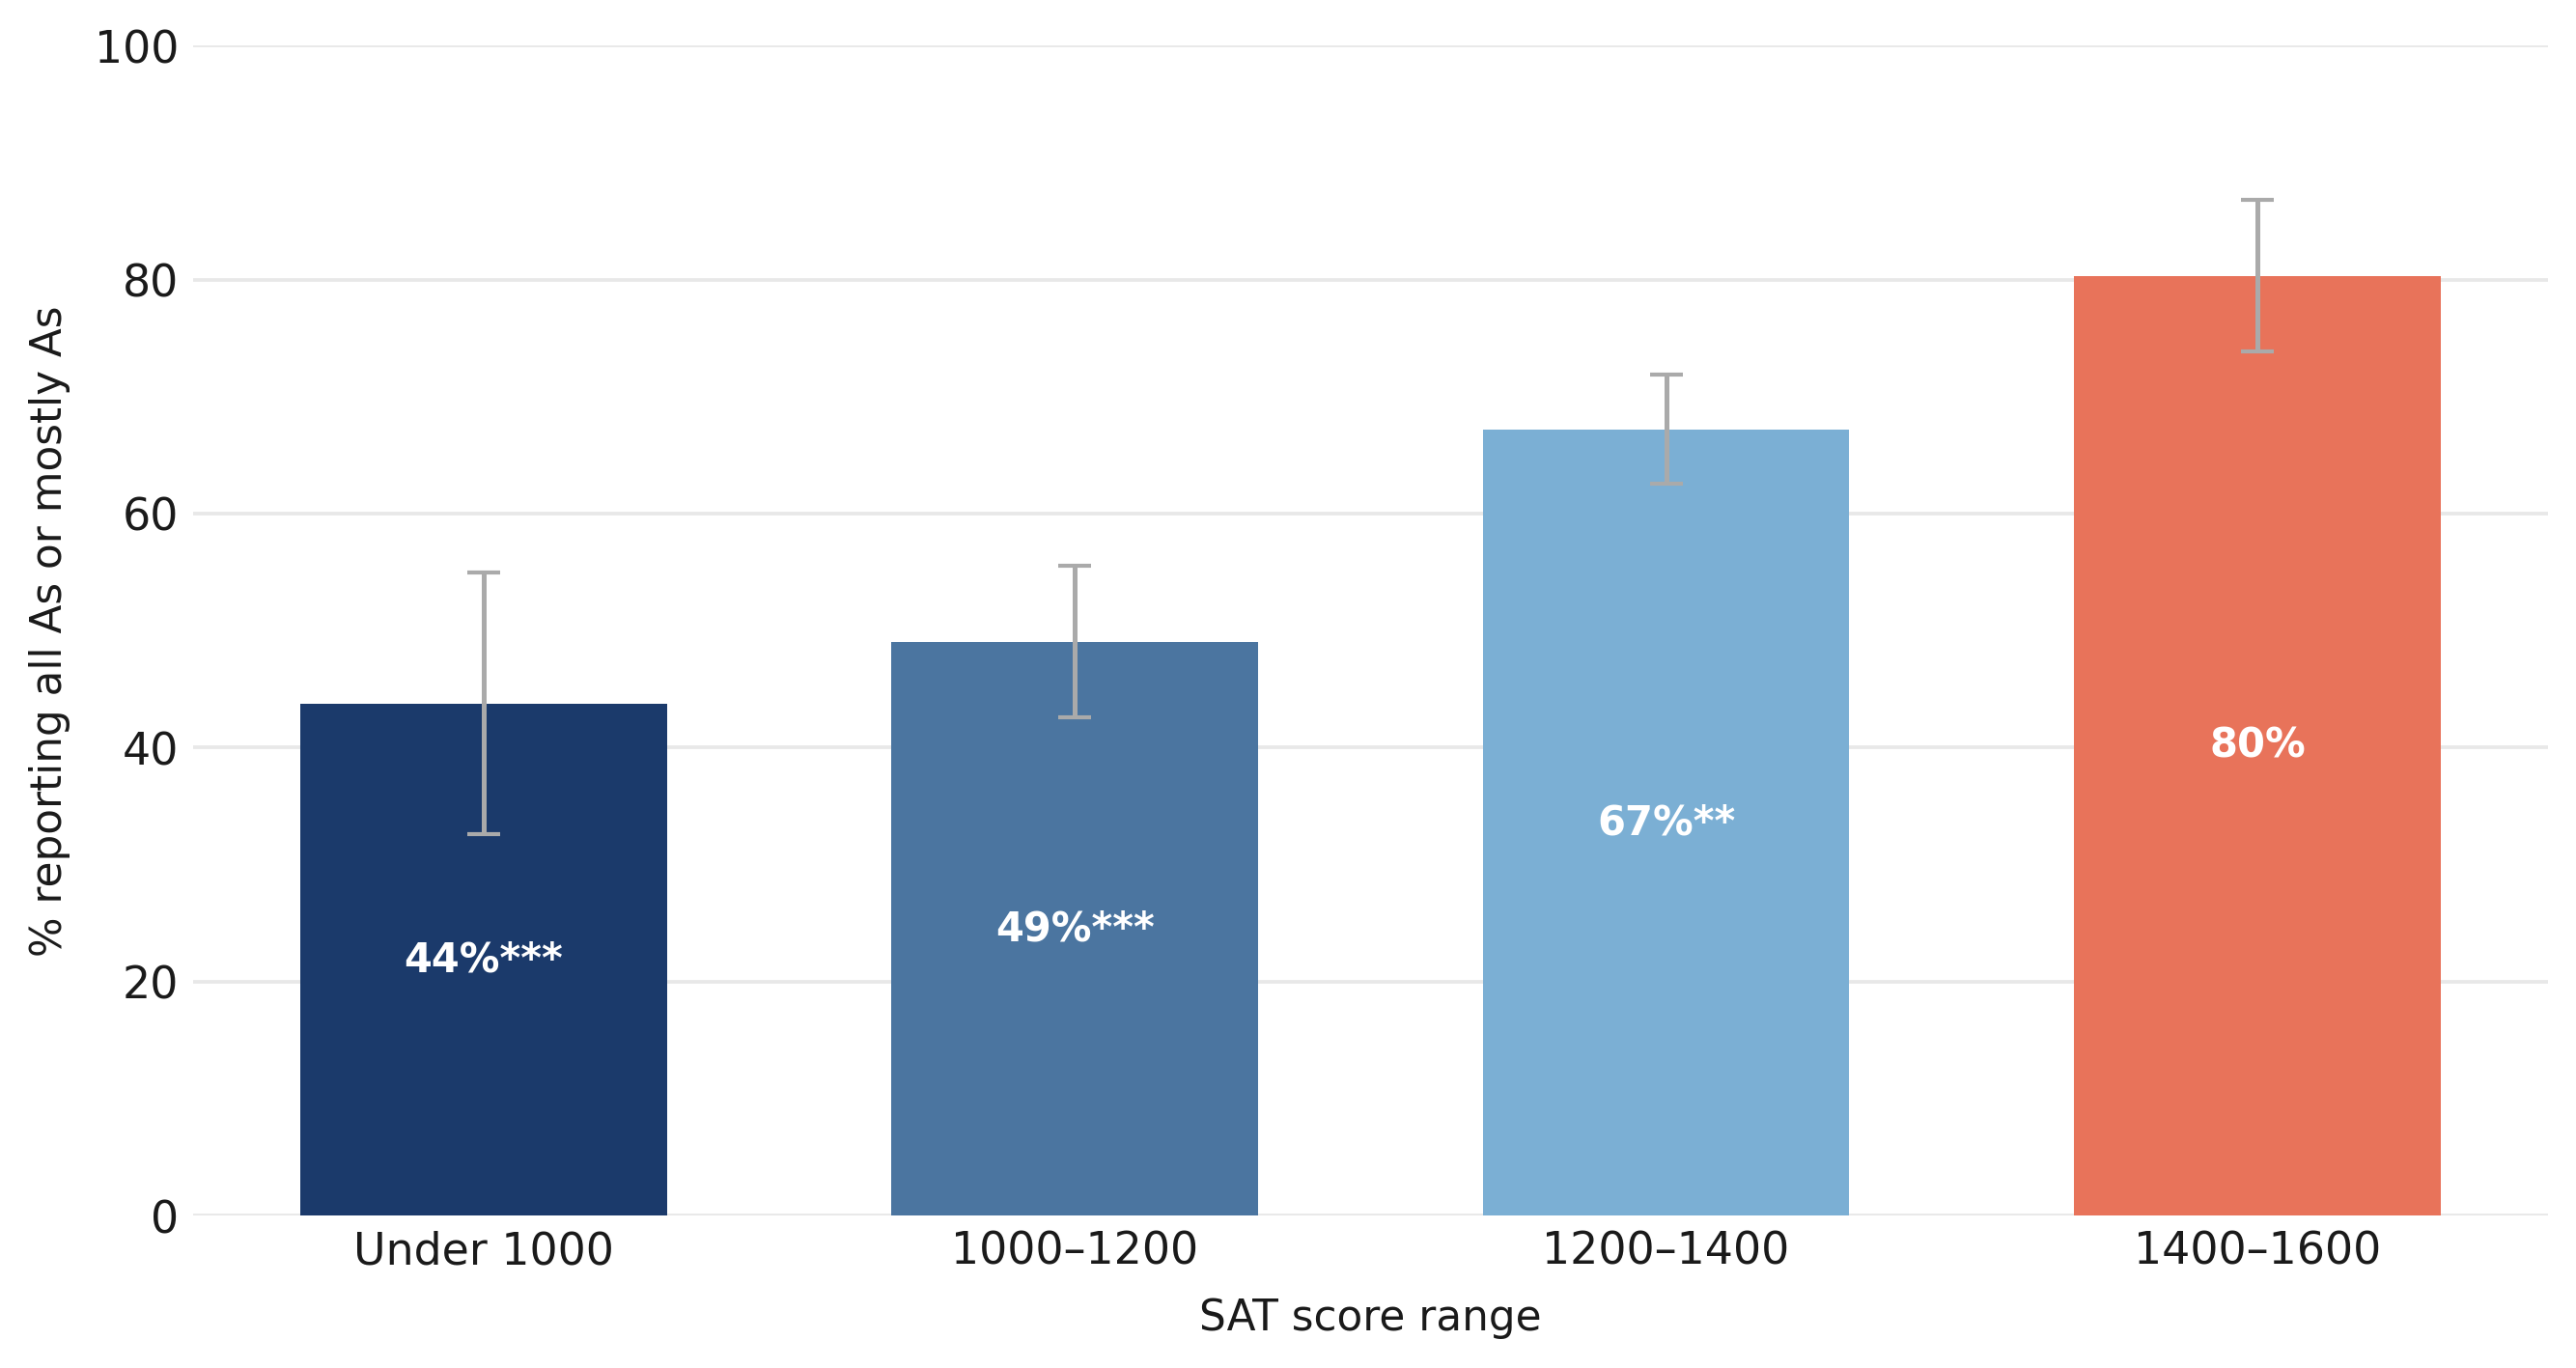
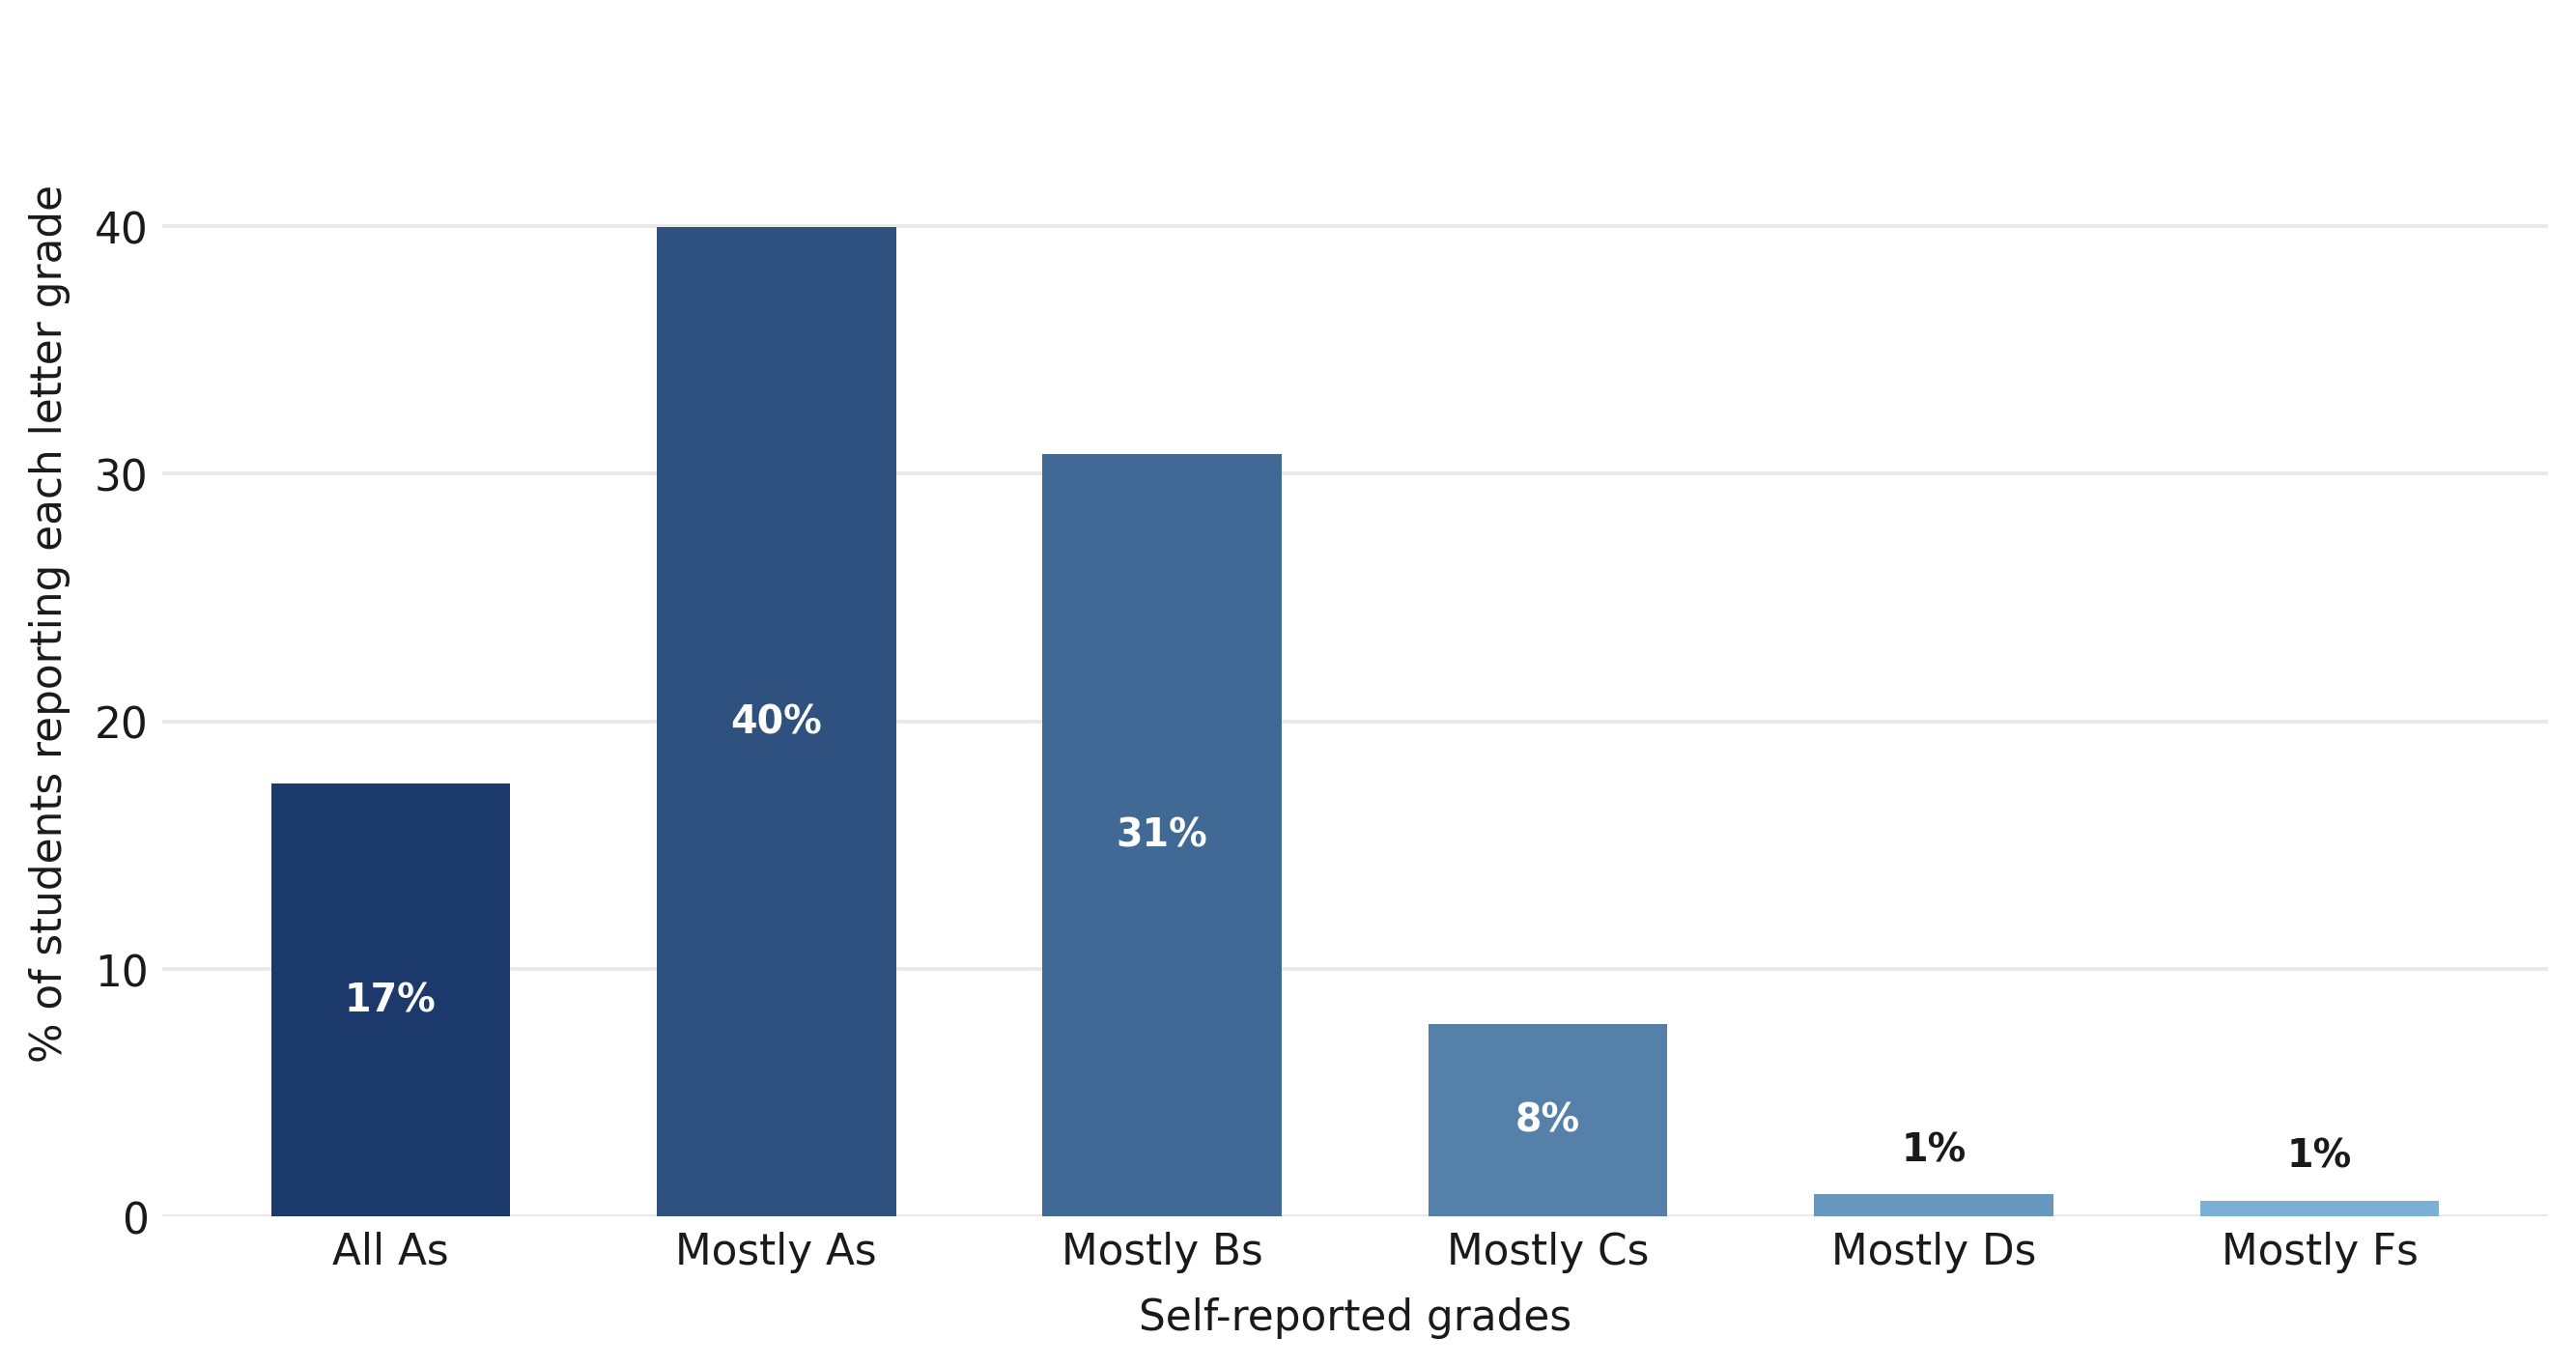
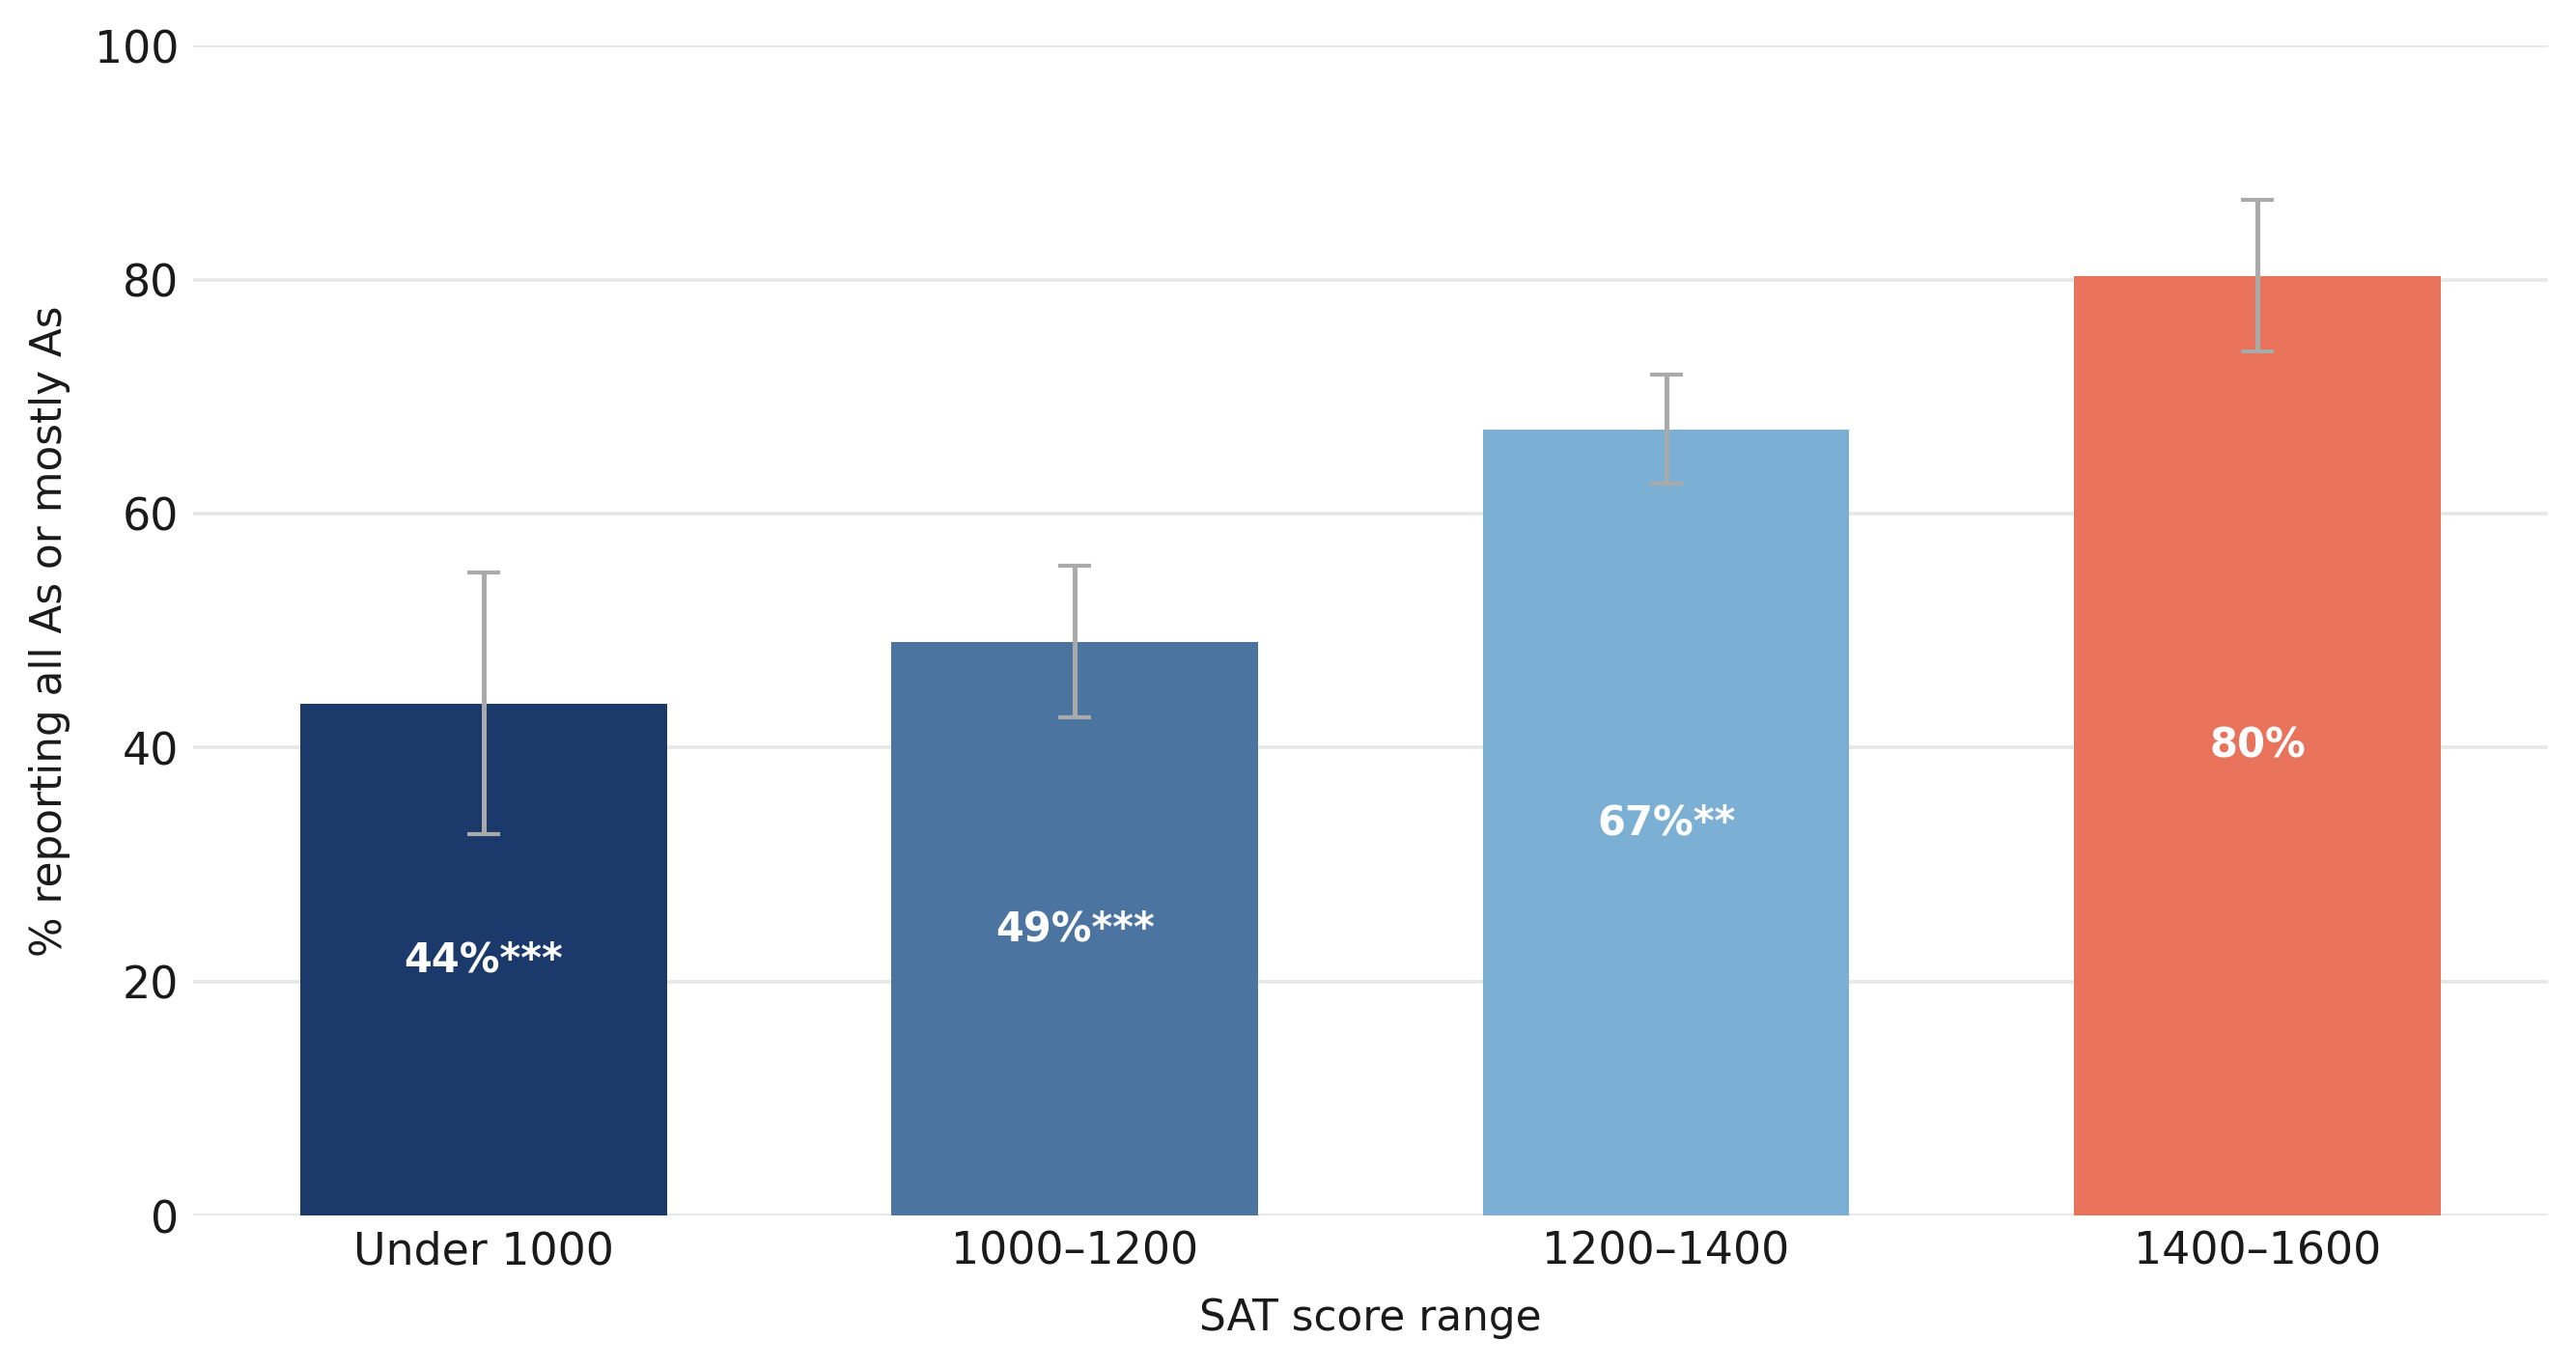
At the same time, grades are heavily concentrated at the top. Fifty-seven percent of respondents report earning all A’s or mostly A’s, including many whose SAT or ACT scores place them in the bottom half of the national achievement distribution (Figure F-4). Put simply, high grades don’t always mean students have mastered the material.
Figure F-4. A sizeable minority of respondents at the bottom of the SAT and ACT score distributions still report getting all or mostly A’s.
Panel A
Panel B
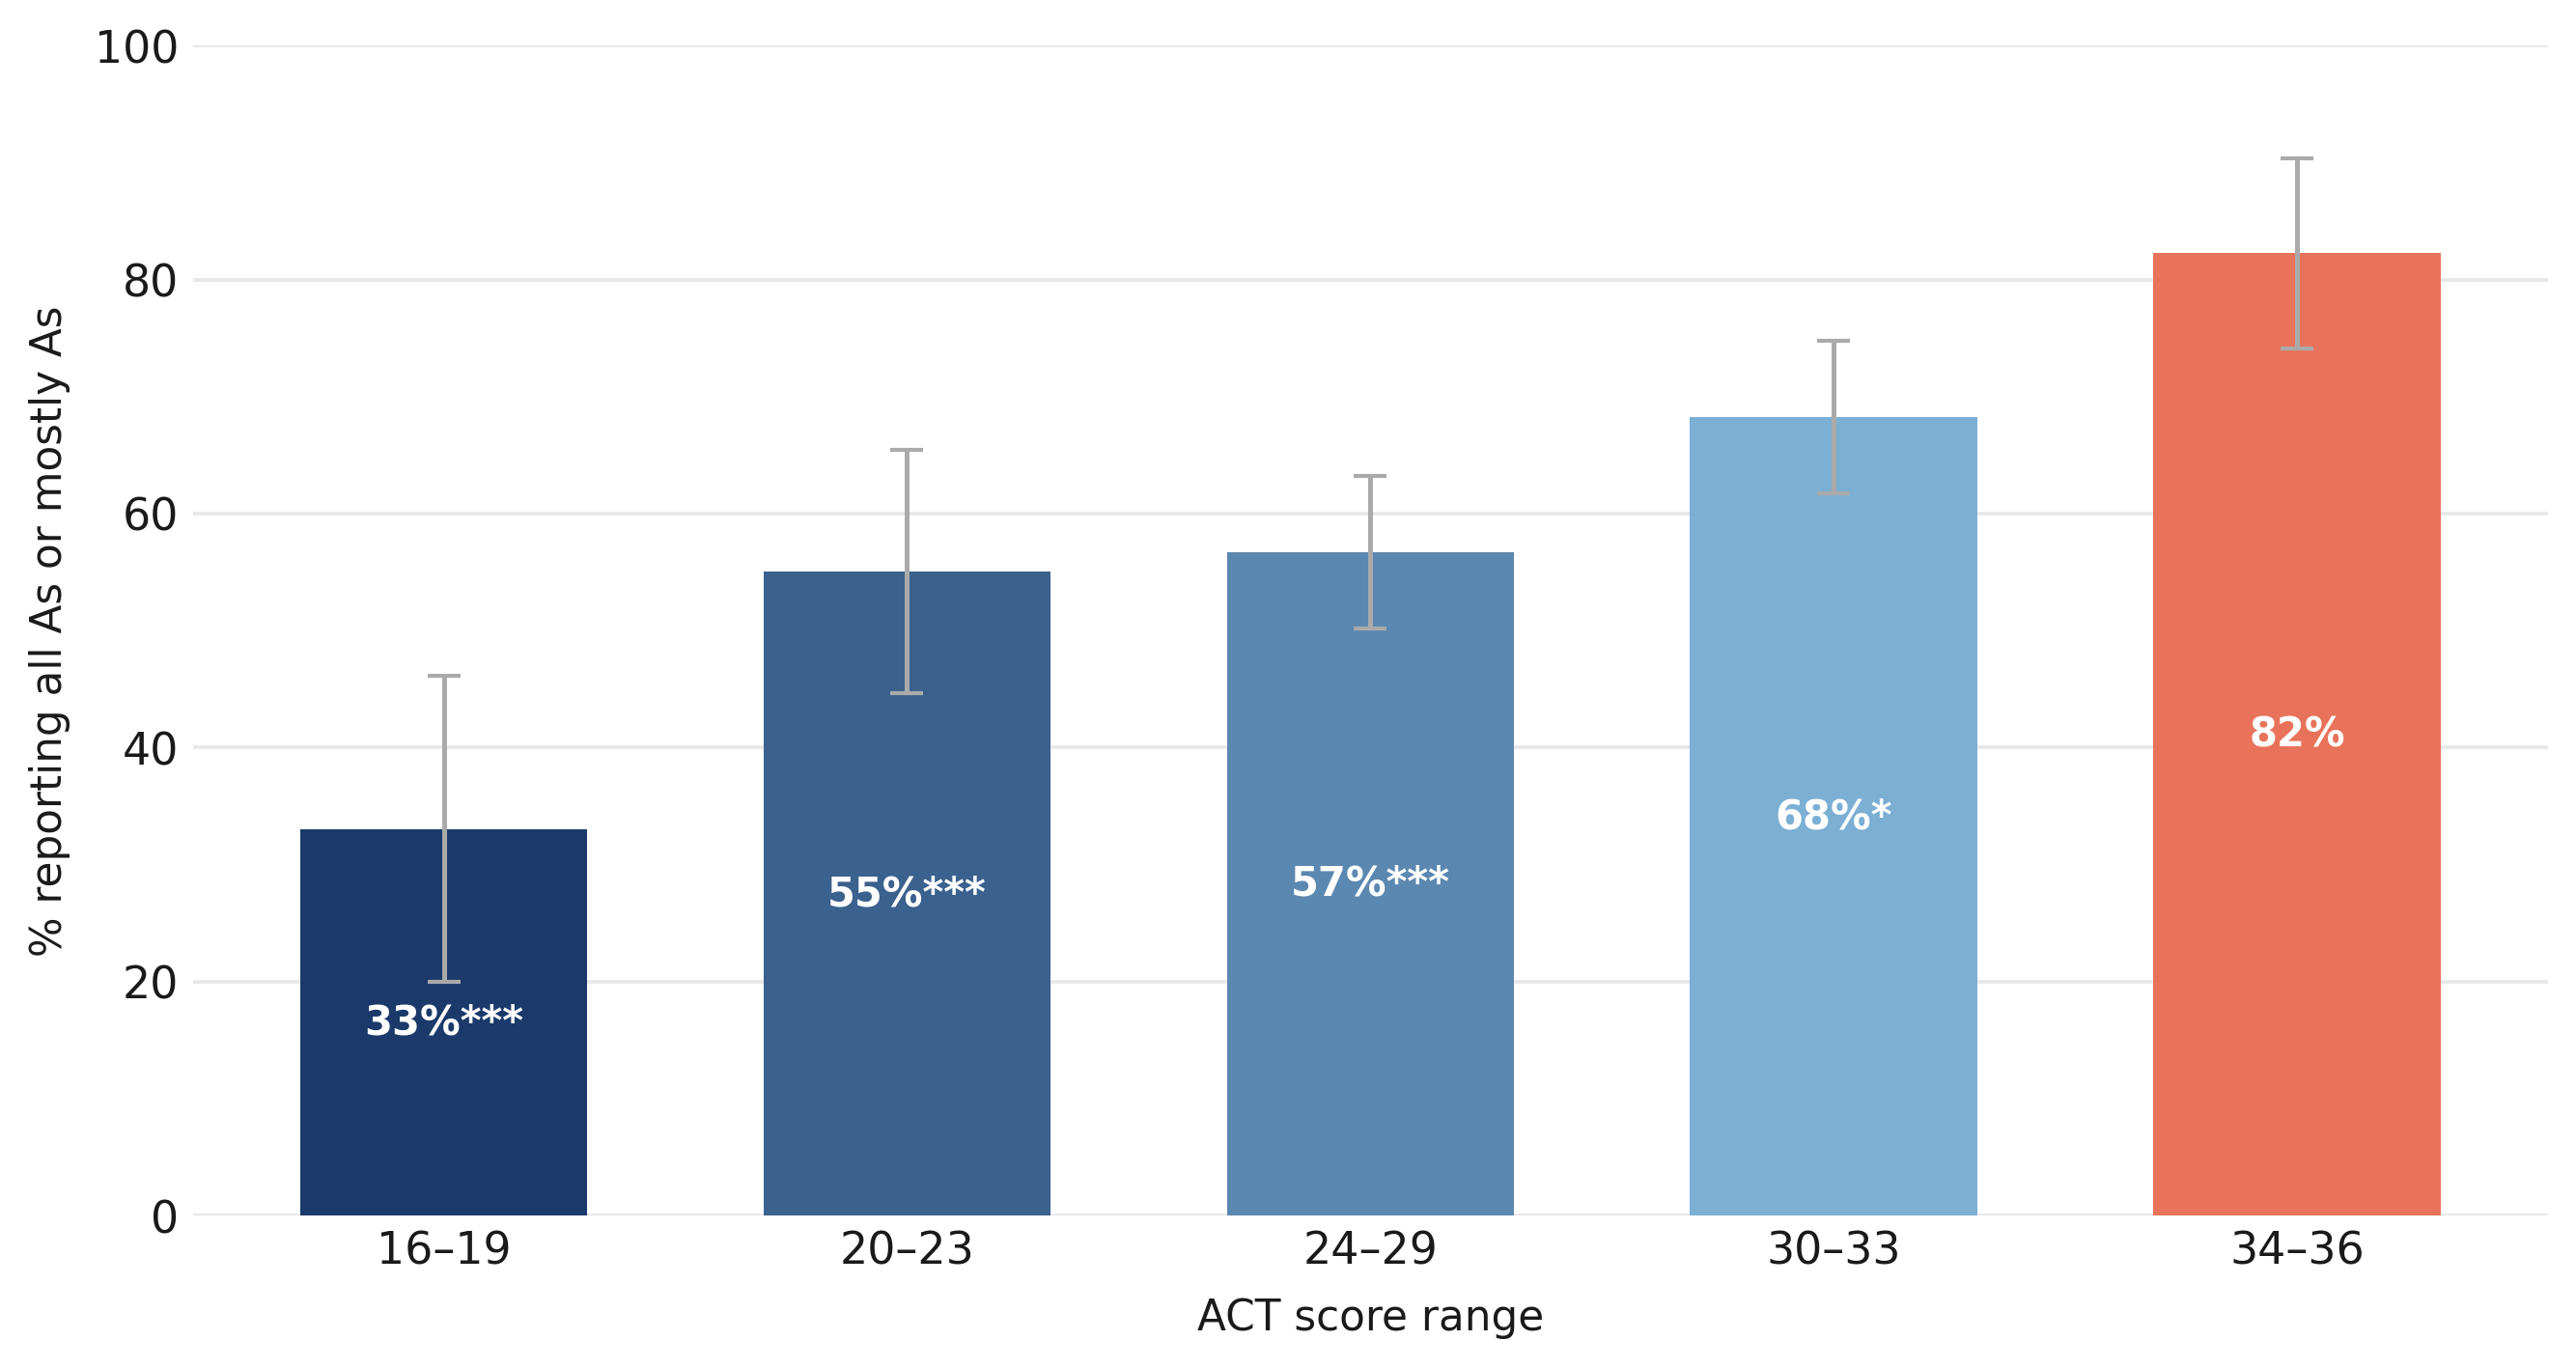
Note: Bars represent the percent of respondents by how they characterize the grades they earn/earned in high school depending on their self-reported SAT or ACT score. The salmon-colored bar indicates the reference category (the highest SAT/ACT score range); confidence intervals calculated at the 95 percent level; + = p<0.1, * = p<0.05, ** = p<0.01, & *** = p<0.001.
Taken together, our results suggest that American high school students are caught up in—and often contribute to—a disturbing and interconnected set of problems: rampant distraction, widespread AI misuse, heavy dependence on screens, and grading practices that make it easier to earn high marks without mastering the material.
Subsequently, Fitzpatrick urges states, districts, and schools to take five steps (some of which echo LAUSD’s policy):
- reduce the amount of time students spend on devices;
- place greater reliance on supervised, in-class, paper-and-pencil, and oral exams;
- make grading expectations school-wide and explicit by eliminating routine retakes and enforcing valid consequences for late work;
- ensure that school-device firewalls work; and
- adopt stricter bans on cell phones and other personal devices.
We of course agree, but here are three additional observations.
First, device-delivered education runs the risk of diminishing the role of the teacher. In the hands of a less skilled instructor, technology can shift the teacher’s role from knowledgeable expert who sets high expectations and builds trusting relationships to a classroom monitor who watches students work on screens and tries to enforce on-task behavior. When technology starts to replace effective teaching rather than support it, districts and schools need to tap (or slam!) the brakes.
Second, this whole thing brings to mind Ted Sizer’s much lauded 1984 book, Horace’s Compromise, named for fictional high school teacher Horace Smith, who tacitly agrees not to push his students too hard if they agree to sit quietly and cause no trouble. Sizer summed it up as, “Give a little, and get along.” Today, Horace’s students would have screens to help them sit quietly, making the compromise even easier. In other words, today’s kids can be sitting in class and still be somewhere else entirely.
And that, in our view, is the deeper danger with overreliance on screens and AI, in combination with weaker expectations and easier grading. Students can “check out” without leaving the classroom. Over time, that means that precious few of them will develop the knowledge, concentration, and self-discipline they need to reach their full academic and cognitive potential in life and in service of society.
Third, the combination of AI-driven cheating, tech-enabled distraction, and equity-minded grade inflation is hollowing out the American high school experience. Today it’s beginning to seem more performative than substantive. Yes, high schools have always included some amount of hoop-jumping, box-checking, and authority-pleasing; that’s the nature of any large bureaucratic organization, and young people have to learn to deal with it. (One of us—guess who—facetiously calls it the “bull-shittification of high school!”) But that doesn’t mean we have to keep piling it on. If classes can be endured by zoning out on screens, assignments evaded through cheating, and high grades awarded without mastery, then we have to ask ourselves: What are we even doing here?!
If we listen to young Americans, we’ll hear that the high school experience is not working as it should—and that the problems go deeper than tinkering around the edges. Screen time limits and such might help, but only if paired with a major rethinking of the high school experience. Yes, that means going back to pencil and paper assignments, recalibrating what it takes to get an A, and putting the Chromebooks back in their carts. All that will help. But it also means asking our teenagers to do cognitive work that really matters to their futures, whether of the traditional college-prep variety or something more career-oriented.
In other words, we will only solve these problems by restoring the basic conditions for learning: attention, effort, honest work, and adults willing to hold adolescents to high expectations.
Introduction
For most of American history, students could not bring portable televisions into a math class, leaf through endless stacks of photos, jokes, and gossip from friends in minutes, play poker while sitting in school, or outsource their essays to a machine. Today, millions of high school students can do all these things, often doing them on devices provided by their schools, and increasingly doing them in plain sight. The question is not whether that is happening—the answer is clearly yes—but how pervasive it has become and what schools can do about it.
To find out, the Thomas B. Fordham Institute commissioned a survey of 1,011 current high school students and 1,013 recent graduates, fielded by Impact Research and UpONE Insights, asking about their use of technology during the school day, their use of artificial intelligence (AI) for academic work, their perceptions of grading standards and school policies, and more. The results are striking. Illicit technology use—social media, YouTube, gaming, and unsanctioned AI—is indeed widespread, enabled in large part by the very devices schools provide. Meanwhile, schools’ grading systems make all these trends worse, as permissive policies make high grades easier than ever to obtain while inflated grade distributions make them harder than ever to trust, undercutting students’ incentive to pay attention in the first place.
Students and recent graduates recognize all of this themselves. Many conscientious respondents signaled frustration with the half-measures that characterize current school policy: phone policies that are rarely enforced, firewalls that are easily circumvented, and AI rules that are widely ignored. This report takes their observations seriously. Our findings reflect not only patterns in the data but the voices of respondents who, when given the chance to speak candidly, make clear that they want schools to set and enforce firmer expectations across the board—for academic honesty, grading standards, effort levels, and more.
Background
The integration of digital technology into American high schools accelerated rapidly over the past two decades. Beginning in the mid-2000s and gathering speed through the 2010s, many districts adopted one-to-one device initiatives—programs that place a school-issued laptop or tablet in the hands of every student. The COVID-19 pandemic then pushed this trend further still: with schools closed and instruction moved online almost overnight, device access became a prerequisite for participation in schooling itself. By the time students returned to physical classrooms, the Chromebook, iPad, and/or school-issued laptop had become a standard fixture of the high school day for an enormous number of US youngsters.
This proliferation was initially met with great fanfare. Boosters envisioned a new era of education, with digital platforms expanding access to content, streamlining communication between teachers and students, and enabling new forms of collaborative learning. Worthy online education ventures emerged, such as Sal Khan’s well-regarded Khan Academy. But these devices also introduced a set of problems that schools have struggled to manage. The firewalls that many began to create, intended to block access to social media sites and the like, have proven inconsistent—and students have, characteristically, proven resourceful.[2] The same device that a student uses to access coursework, assignments, and readings can, with a few keystrokes, also open Instagram, TikTok, YouTube, or an online game. Meanwhile, the smartphone has introduced a parallel channel of distraction that no device policy alone can address—to say nothing of the laptops, tablets, and smartwatches students often bring to school as well.
The most recent development, and perhaps the most consequential, is the emergence of artificial intelligence (AI). Since the release of ChatGPT in late 2022, students have had access to tools capable of summarizing assigned readings, drafting essays, solving math problems, and providing real-time assistance during quizzes. These capabilities have raised fundamental questions about what homework, essays, and take-home assessments actually measure, whether students are doing their own schoolwork, and whether the grades they generate still mean what they once did.
Several recent surveys have polled teenagers about their use of AI. RAND's American Youth Panel tracked AI use among middle and high schoolers across multiple waves in 2025, finding rising usage coupled with substantial student ambivalence about its effects on their own learning. The College Board documented rapid growth in generative AI use for schoolwork, with large majorities of high schoolers reporting such uses by mid-2025. The Center for Democracy and Technology surveyed nearly 1,000 ninth- through twelfth-graders in 2024–25 on the potential risks of AI, including weakened relationships between students and teachers.
Yet these surveys were limited in scope. Most focused narrowly on AI, and many relied on adults’ perceptions rather than students’ own accounts. To our knowledge, none to date have asked students about teacher grading policies alongside their school’s technology environment—or examined how those areas may interact. Our approach treats AI misuse, screen time, and grading practices as parts of the same ecosystem and reveals how weak guardrails in one may reinforce permissive norms in another.
Data and Methods
Our primary data source is a nationally representative online survey of 1,011 current high school students and 1,013 recent high school graduates, fielded by Impact Research and UpONE Insights between February 3 and March 10, 2026. The sample includes respondents in grades 9–12, distributed approximately evenly across those four grade levels. The recent graduate sample consists of individuals who completed high school roughly within the past four years and were ages 18 through 22 when surveyed. At that time, 44 percent of graduates were enrolled in four-year colleges or universities, 14 percent in two-year colleges, 12 percent in job training programs, while 30 percent were not participating in any education program. Sixty-six percent were employed full- or part-time.
Both samples were weighted to align with U.S. Census data on their respective age cohorts, and the survey is representative of the demographic composition of high school students and recent graduates nationwide. Throughout the report, except where noted, we combine the two subsamples into a single sample to infer the behavior of modern U.S. high school students with as much precision as possible. Each full-sample estimate has an estimated range of plus or minus 3.1 percentage points at the 95 percent confidence level; the corresponding ranges for subgroup analyses are larger and vary by subgroup size.
We employed descriptive statistics to summarize response distributions and inferential statistical methods, including correlation analyses and significance testing, to examine associations between variables and evaluate group differences.
We also include verbatim responses throughout to an open-ended question that asked, “What would motivate high school students to put more effort into their academics?”
Findings
Finding 1 Illicit tech use is rampant.
A majority of survey respondents report using technology for non-academic purposes on a daily basis during the school day—and the problem is not confined to personal smartphones. The data suggest that this is not the behavior of a small minority of inattentive students: it is, to a significant degree, today’s norm.
Tellingly, analysis of survey metadata found that 22 percent of surveys completed by current students were filled out at least partially during typical school hours (between 9 a.m. and 2 p.m. local time on weekdays)—consistent with the patterns of off-task device use that the findings themselves document. In other words, the act of taking the survey itself illustrated the problem the survey was designed to measure.
Finding 1a. About half of respondents report daily in-class use of social media and messaging friends, a third of them watch YouTube or play video games, a fifth (22%) use AI without permission, and roughly one in six (16%) shop online. All told, more than three quarters report daily misuse of tech.
According to the survey, 76 percent of respondents report at least one form of daily technology misuse during class time (Figure 1). The most common forms are social media—Instagram, Snapchat, TikTok, and similar platforms—with 50 percent of respondents reporting daily use in class. Messaging friends through non-classroom channels was reported by 49 percent. Roughly a third of respondents say they watch unassigned YouTube videos (33 percent) or play recreational games (33 percent) each day. One in six shops or browses online stores on a daily basis (17 percent), while 22 percent report using AI tools without their teacher's permission. Even online gambling, though much less frequent, is reported by 3 percent of respondents on a daily basis.
The scale and seriousness of these figures are hard to overstate. Fifty percent of respondents using social media every school day is not an occasional lapse in judgment—it is a structural feature of the modern high school experience. The 22 percent using AI without permission is equally notable: this represents more than one in five respondents, and the actual rate is almost certainly higher, since respondents may be reluctant to acknowledge it. Taken together, the data suggest that daily distraction and academic shortcutting have become deeply embedded habits.[3]
Figure 1. Taken together, 76 percent of respondents report some kind of daily illicit tech use during high school.
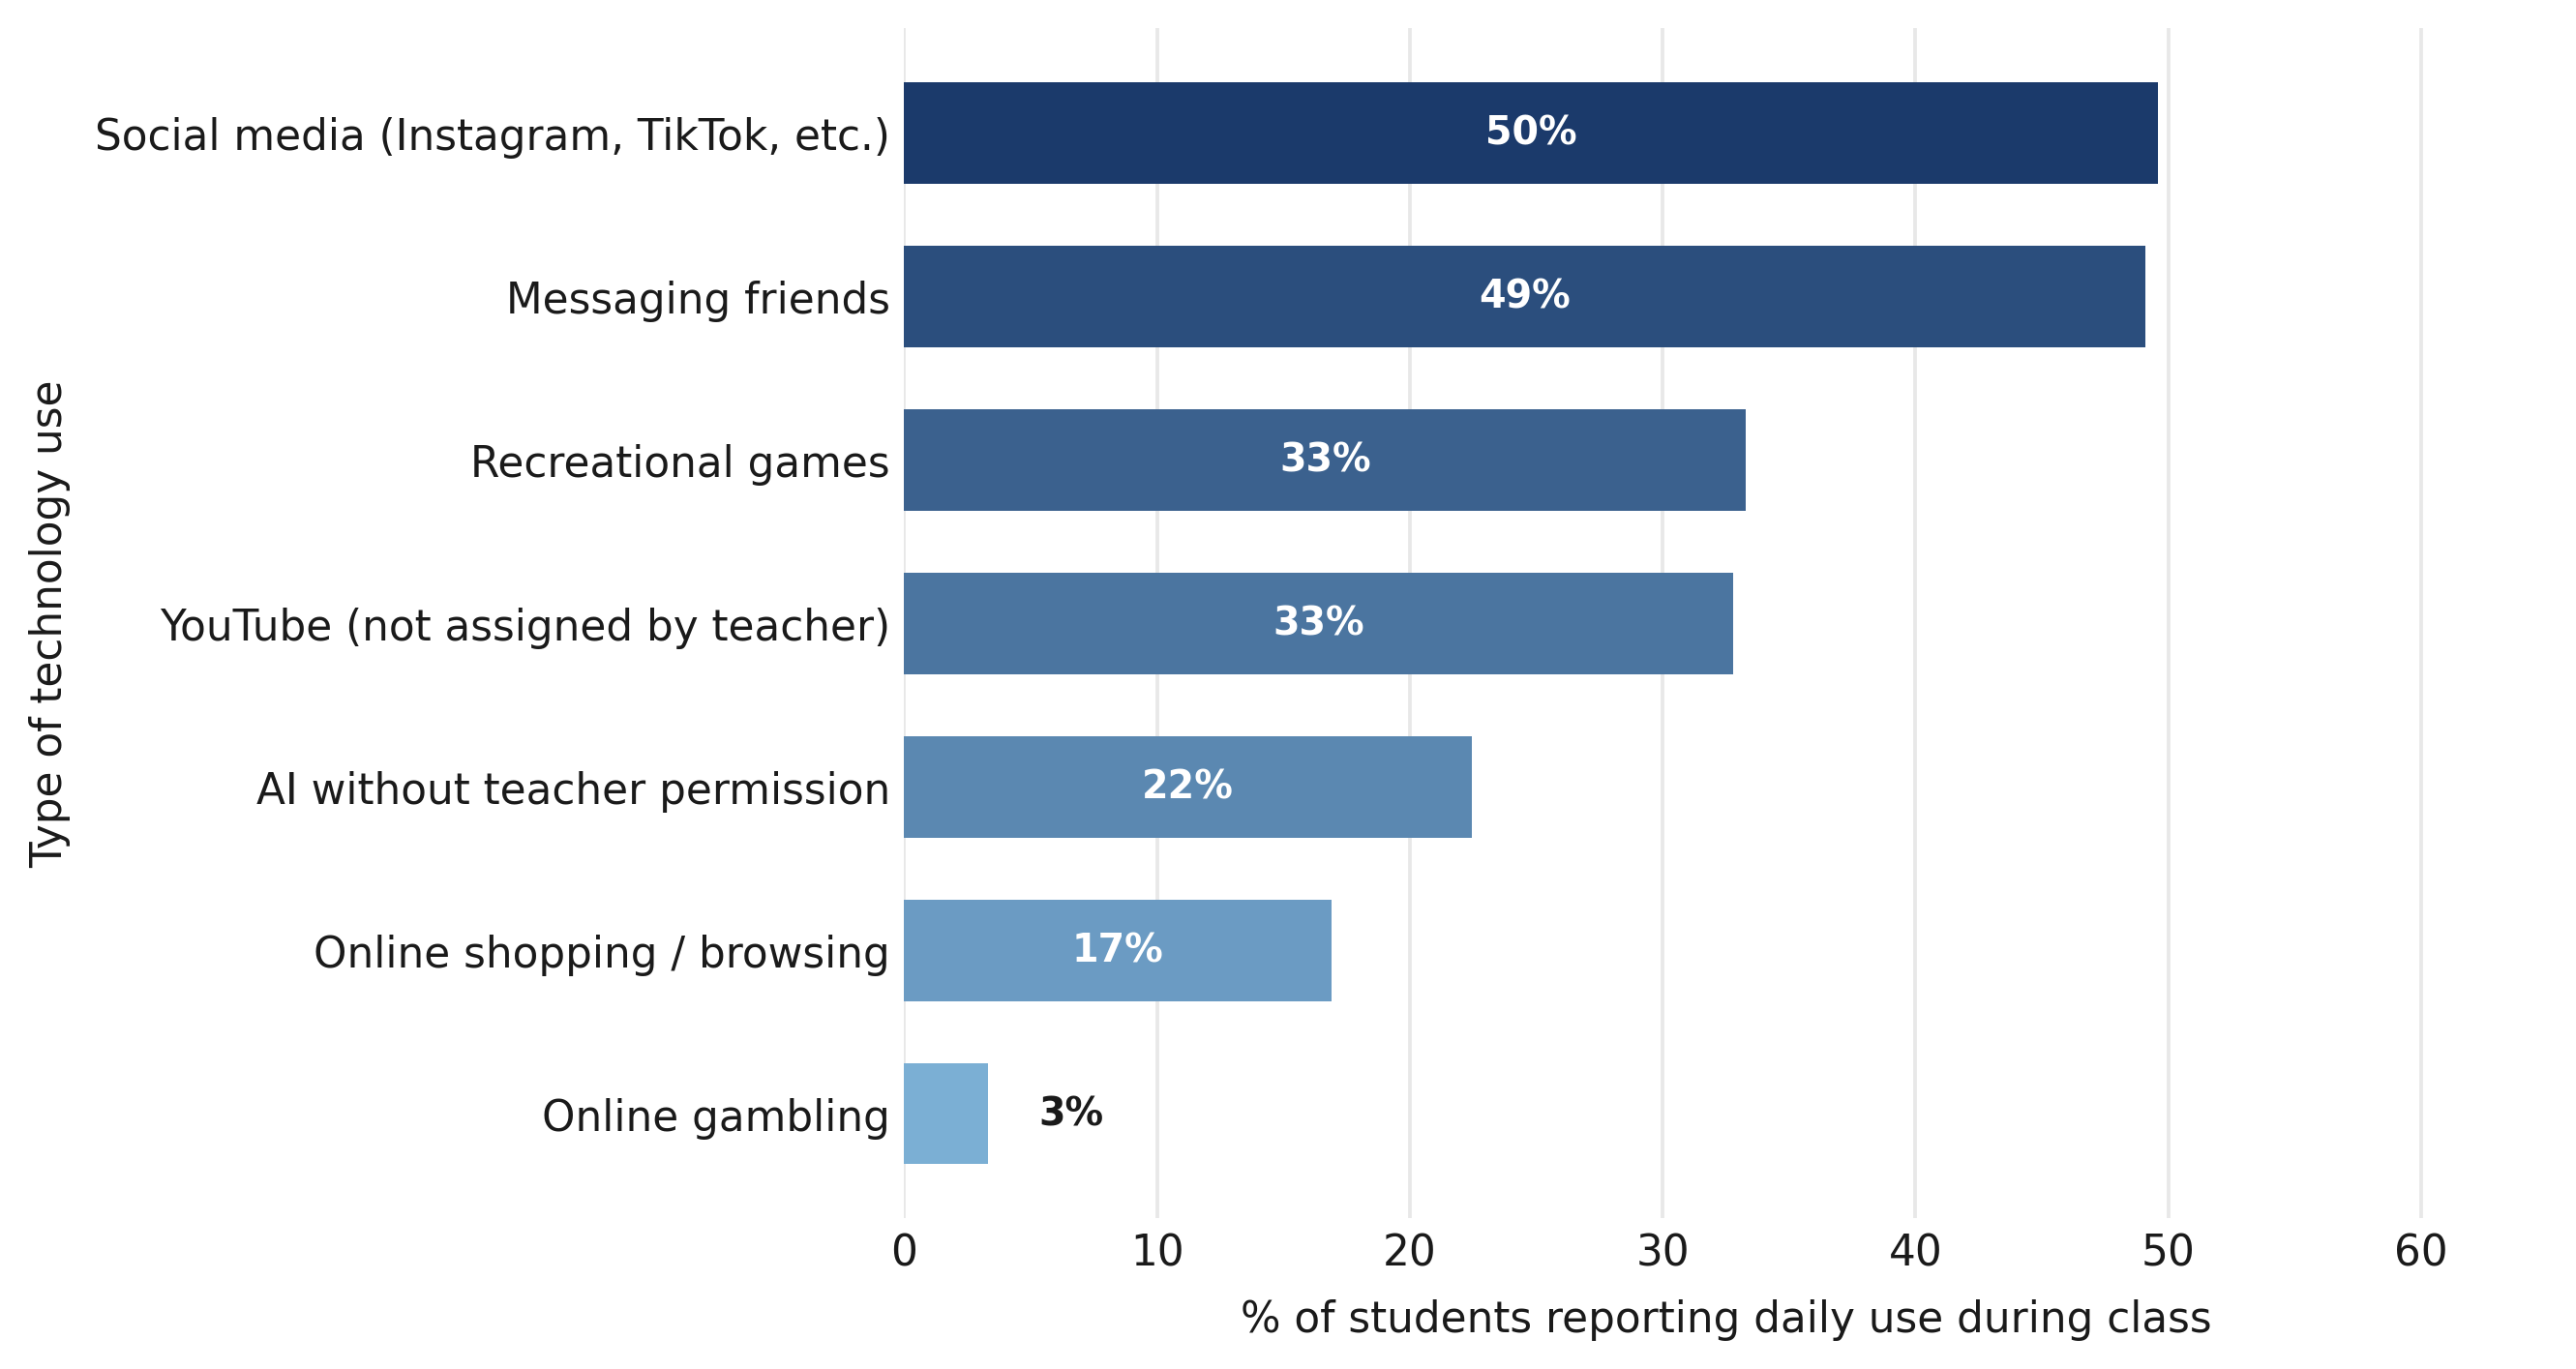
Note: Bars represent responses to the question, “Here are some online activities. For each, please indicate whether or not it is accessible to you during or in between classes at your high school, whether on a personal smartphone, a personal computer or tablet, or a school-issued computer or tablet.”

A key reason that illicit tech use is so pervasive is that school-issued devices provide direct access to the platforms driving it. More than half of respondents—66 percent—report that YouTube is accessible on school-issued devices (Figure 2). Some teachers may of course use YouTube for instructional purposes, but the scale of reported access suggests that much of this use is unsanctioned. More than a third of respondents say that school-issued devices are how they access recreational online games (39 percent) and online shopping (34 percent).[4] Even social media, which schools commonly attempt to block, is accessible on school-issued devices for 14 percent of respondents.
Apart from online gambling, more than two-thirds of respondents report being able to access each category of illicit tech use either on a school-issued device or on their phone. As a result, effective efforts to decrease tech-based distractions will likely require efforts to curtail both.
Figure 2. YouTube and chat apps are easy to access on school-issued devices; social media mostly require smartphones.
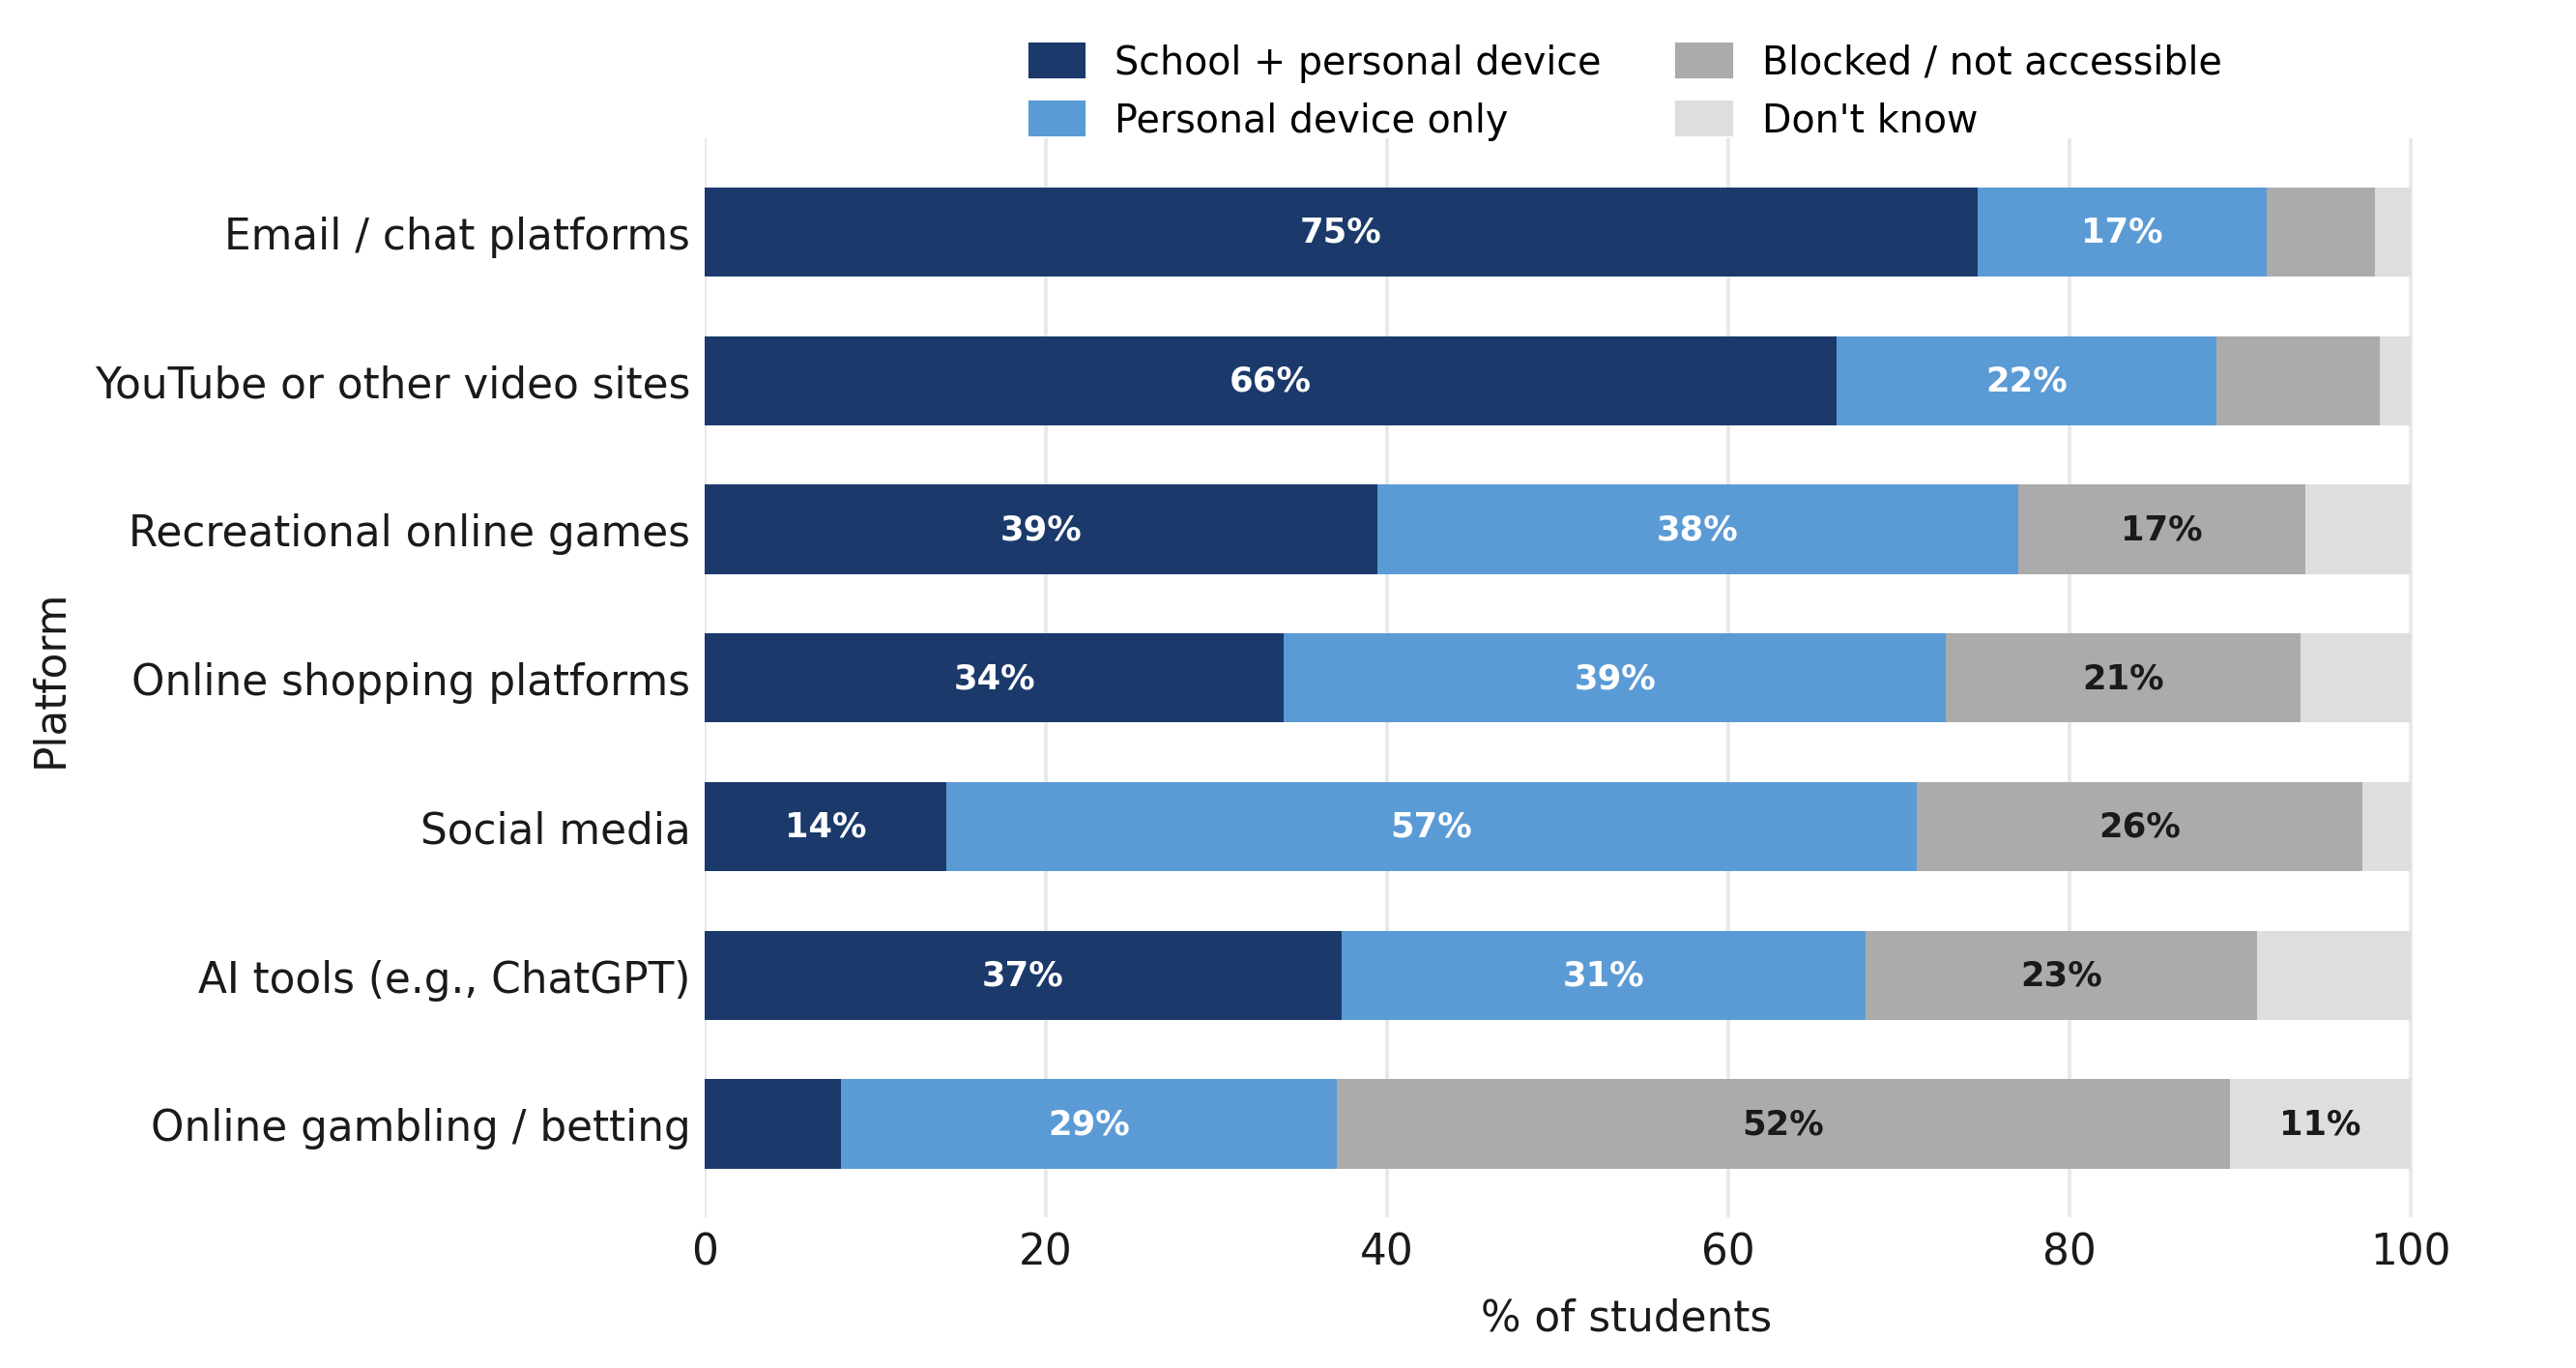
Note: Bars represent responses to the question, “Here are some online activities. For each, please indicate whether or not it is accessible to you during or in between classes at your high school, whether on a personal smartphone, a personal computer or tablet, or a school-issued computer or tablet.”
The consequences of permissive device access are visible in classrooms every day. Fifty-eight percent of respondents agree that, when devices are in use, many of their classmates are watching videos, using social media, or engaged in other off-task activities (Figure 3). Less than one-third say it is easy to get around school firewalls—suggesting that the problem may be less about respondents actively circumventing security measures and more about the fact that many platforms, including YouTube, are not blocked to begin with.[5] Interestingly, respondents who report better firewalls are less likely to report accessing social media via school devices but are more likely to report social media use via personal devices.
Figure 3. Firewalls appear hard to get around but also don’t prevent off-task behavior.
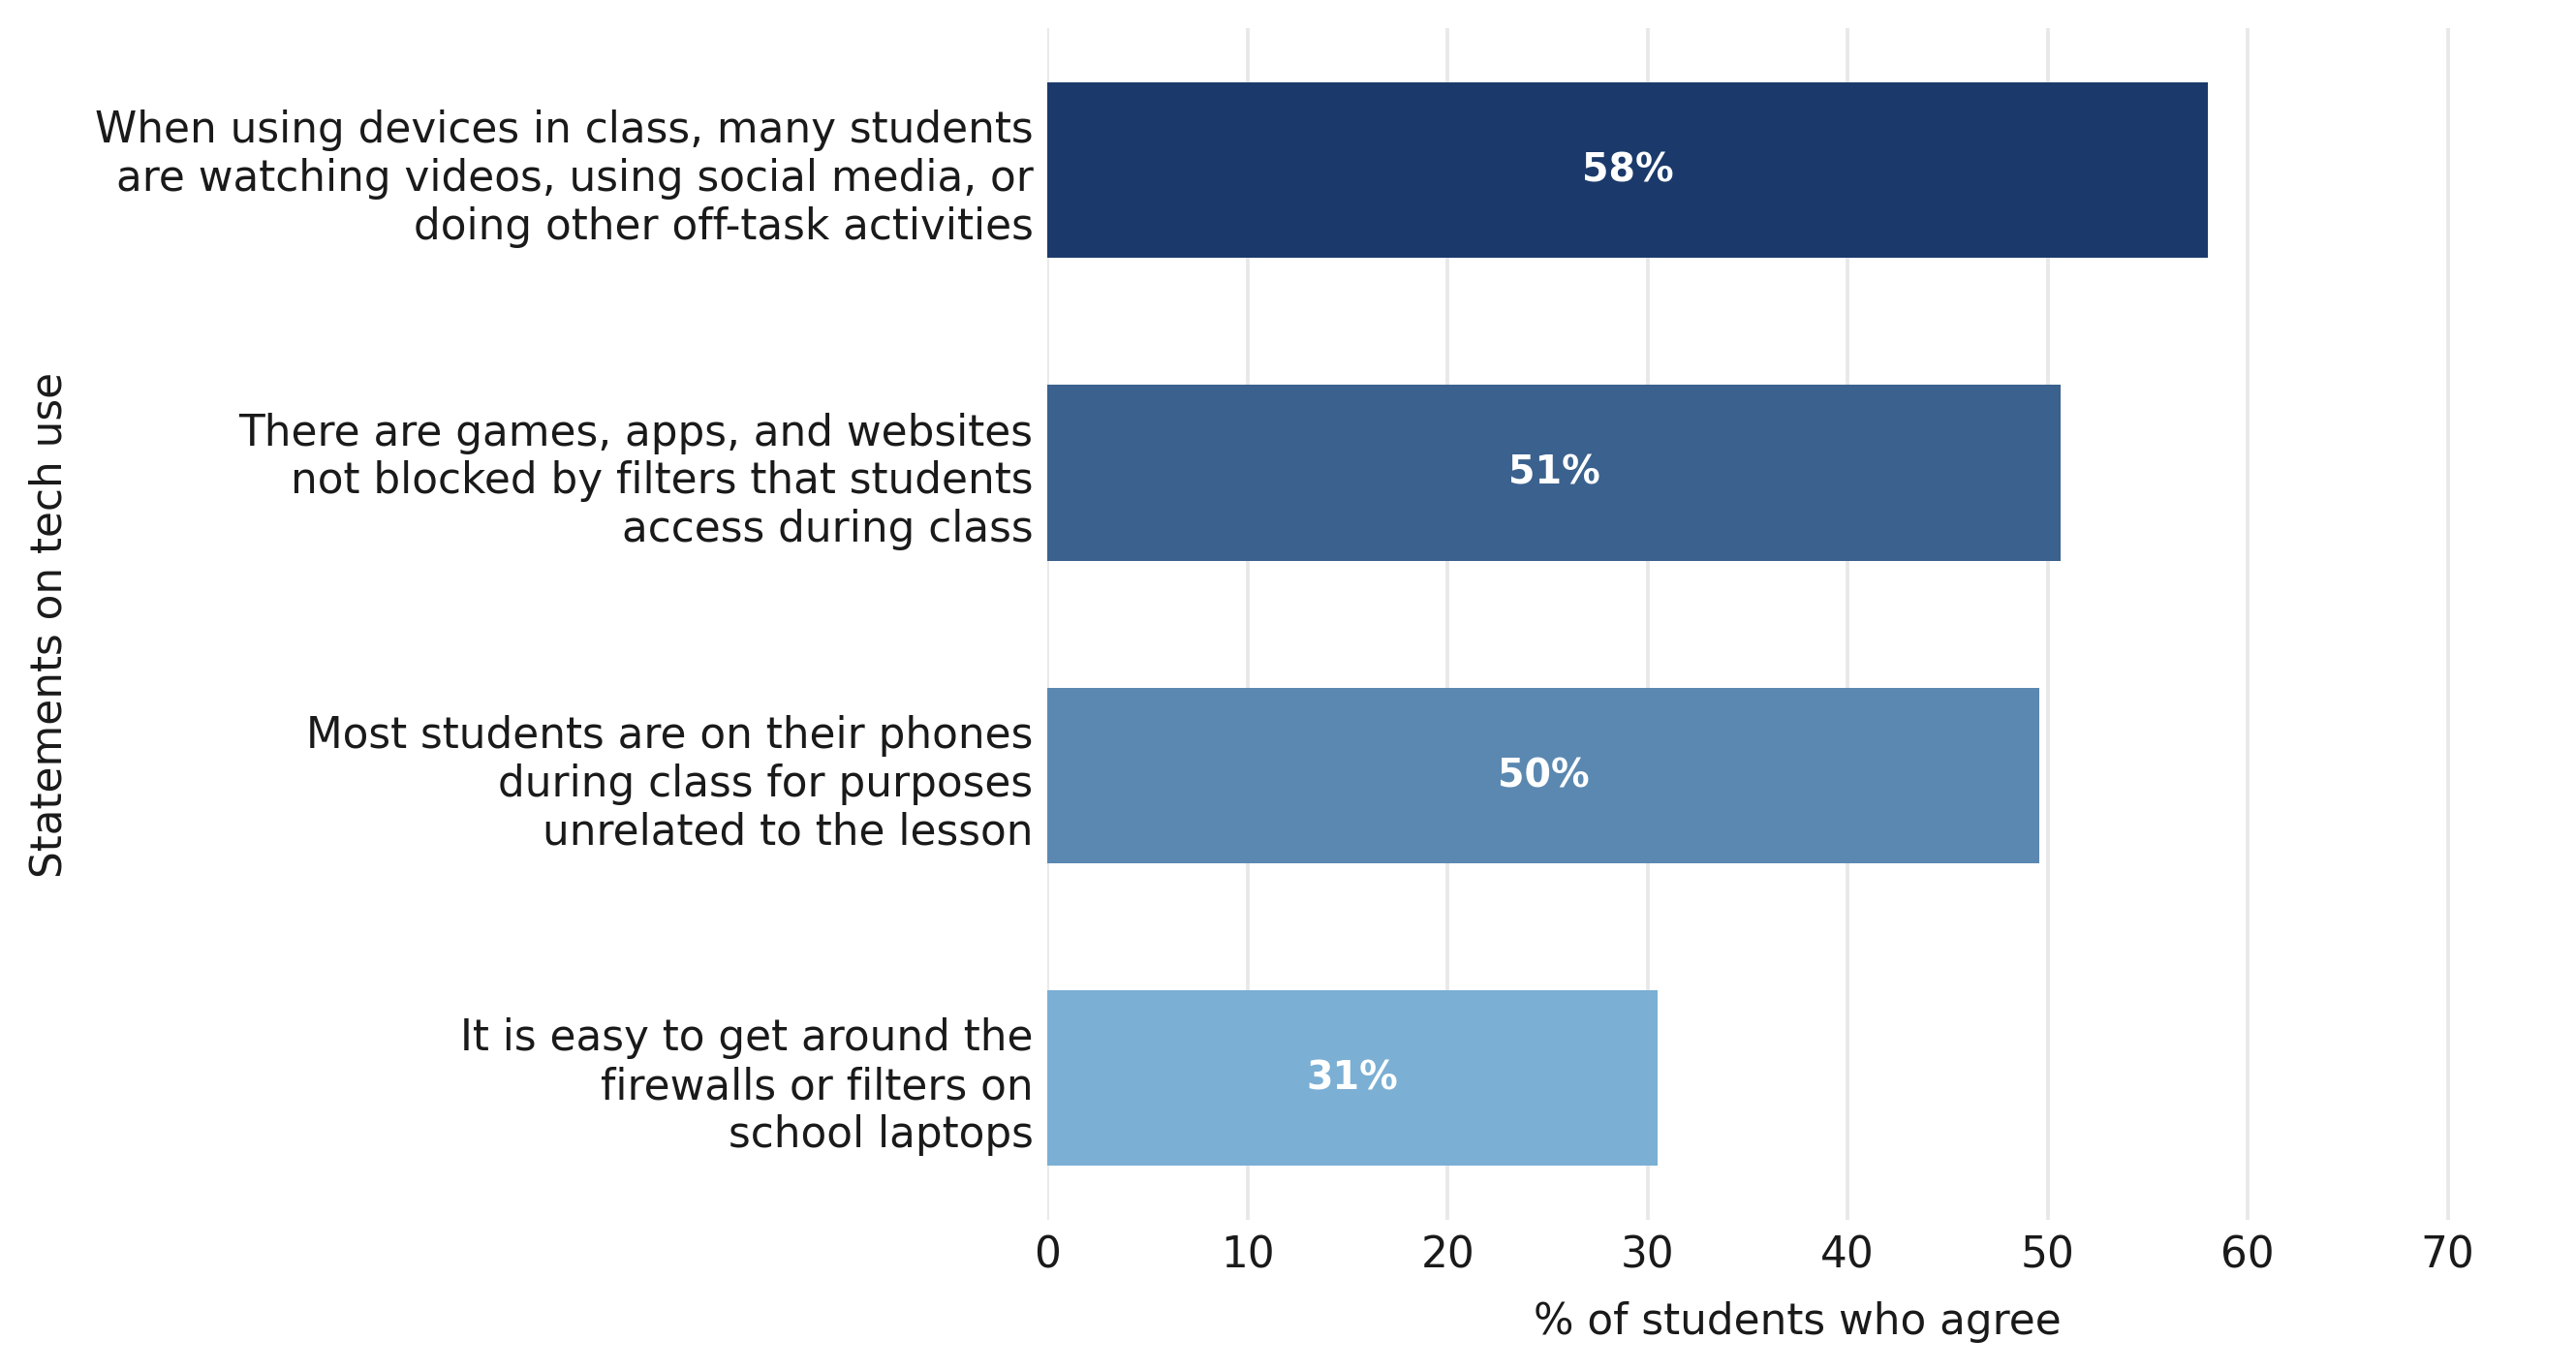
Note: Bars represent the combined percentage of respondents who either “strongly agree” or “somewhat agree” to each statement.
If students are primarily misusing school-issued devices via platforms that should be blocked but are not, then a partial but worthy solution is better enforcement of existing access controls. If much of the off-task activity is happening on personal smartphones or other personal devices, school device policies alone are insufficient. The data suggest that both dynamics are operating simultaneously.

Finding 1b. Students in schools with a policy of leaving cell phones in the central office or locked pouches have by far the lowest rates of social media use.
The survey provides a clear piece of encouraging evidence: among both current students and recent graduates, respondents in schools with the strictest phone policies report the lowest rates of illicit technology use. Among respondents whose schools require phones to be left in a central office or locked in a pouch, 33 percent report daily social media use—compared to 54 percent in schools where phones are permitted in class so long as respondents do not use them, and 64 percent in schools where the policy is left to the discretion of individual teachers (Figure 4).
Figure 4. Sixty-four percent of respondents report daily social media use when cell policy is left to teachers compared to 33 percent in schools that ban phones.
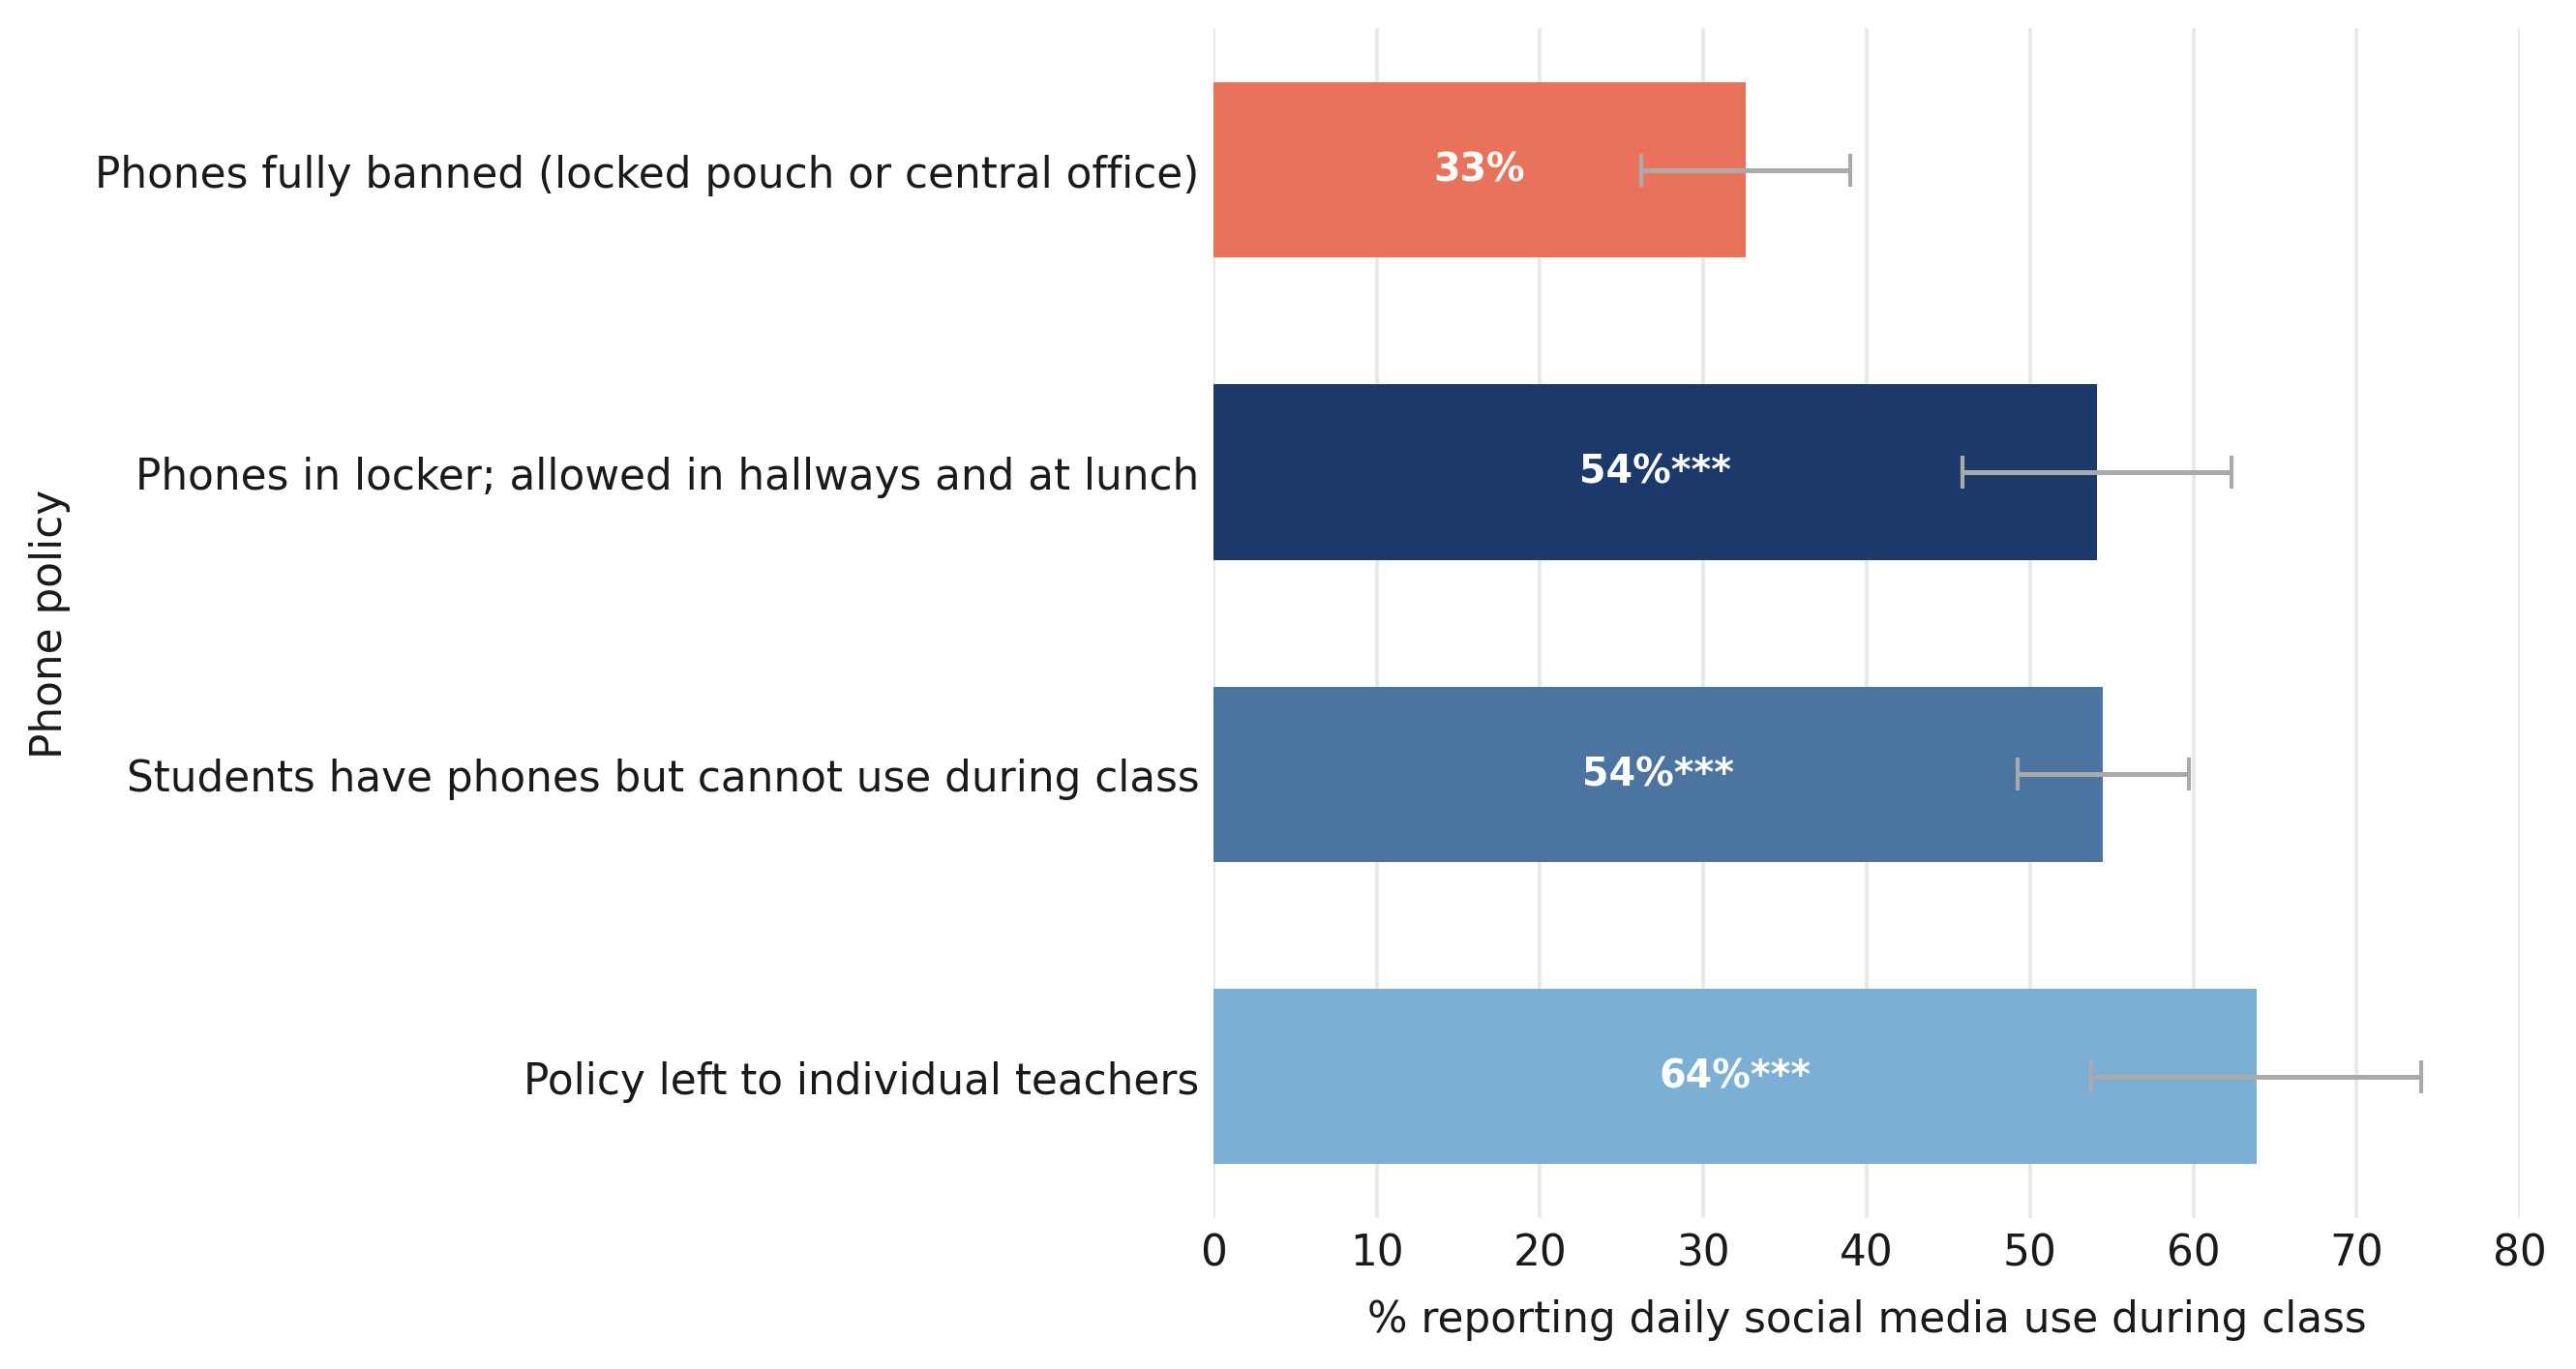
Note: Each bar represents the percent of respondents who report using social media “multiple times a day” or “once a day,” depending on their school’s cell phone policy. The salmon-colored bar indicates the reference category; confidence intervals calculated at the 95% level; + = p<0.1, * = p<0.05, ** = p<0.01, & *** = p<0.001.
This gap is substantial and consistent. It also comes with a critical qualifier: even in schools with the strictest phone policies, nearly one in three respondents still reports daily social media use—likely via school-issued devices, personal laptops, smartwatches, or other devices not covered by phone bans. This underscores a key point: phone policies and school-issued device policies must be addressed together. A strict phone policy not accompanied by controls on what students can access via other devices leaves open a significant pathway to distraction.
Finding 1c. Lower-performing respondents have higher rates of social media use in schools, but even among respondents who got “all As,” 48 percent report daily social media use.
As one might expect, daily social media use during the school day is not evenly distributed across the grading spectrum. Among respondents who report earning mostly C’s, 63 percent say they use social media daily, compared to 48 percent of respondents who report earning all A’s (Figure 5). Still, 48 percent is a large number, so high academic achievement does not appear to insulate respondents from distraction. It may simply mean they are better at managing it, or that its impact on grades, however real, is masked by generous grading policies of the kind documented below in Finding 4. In either case, the data argue against treating this as a problem confined to lower-performing students.
Figure 5. Even among straight-A students, 48 percent report daily social media use.
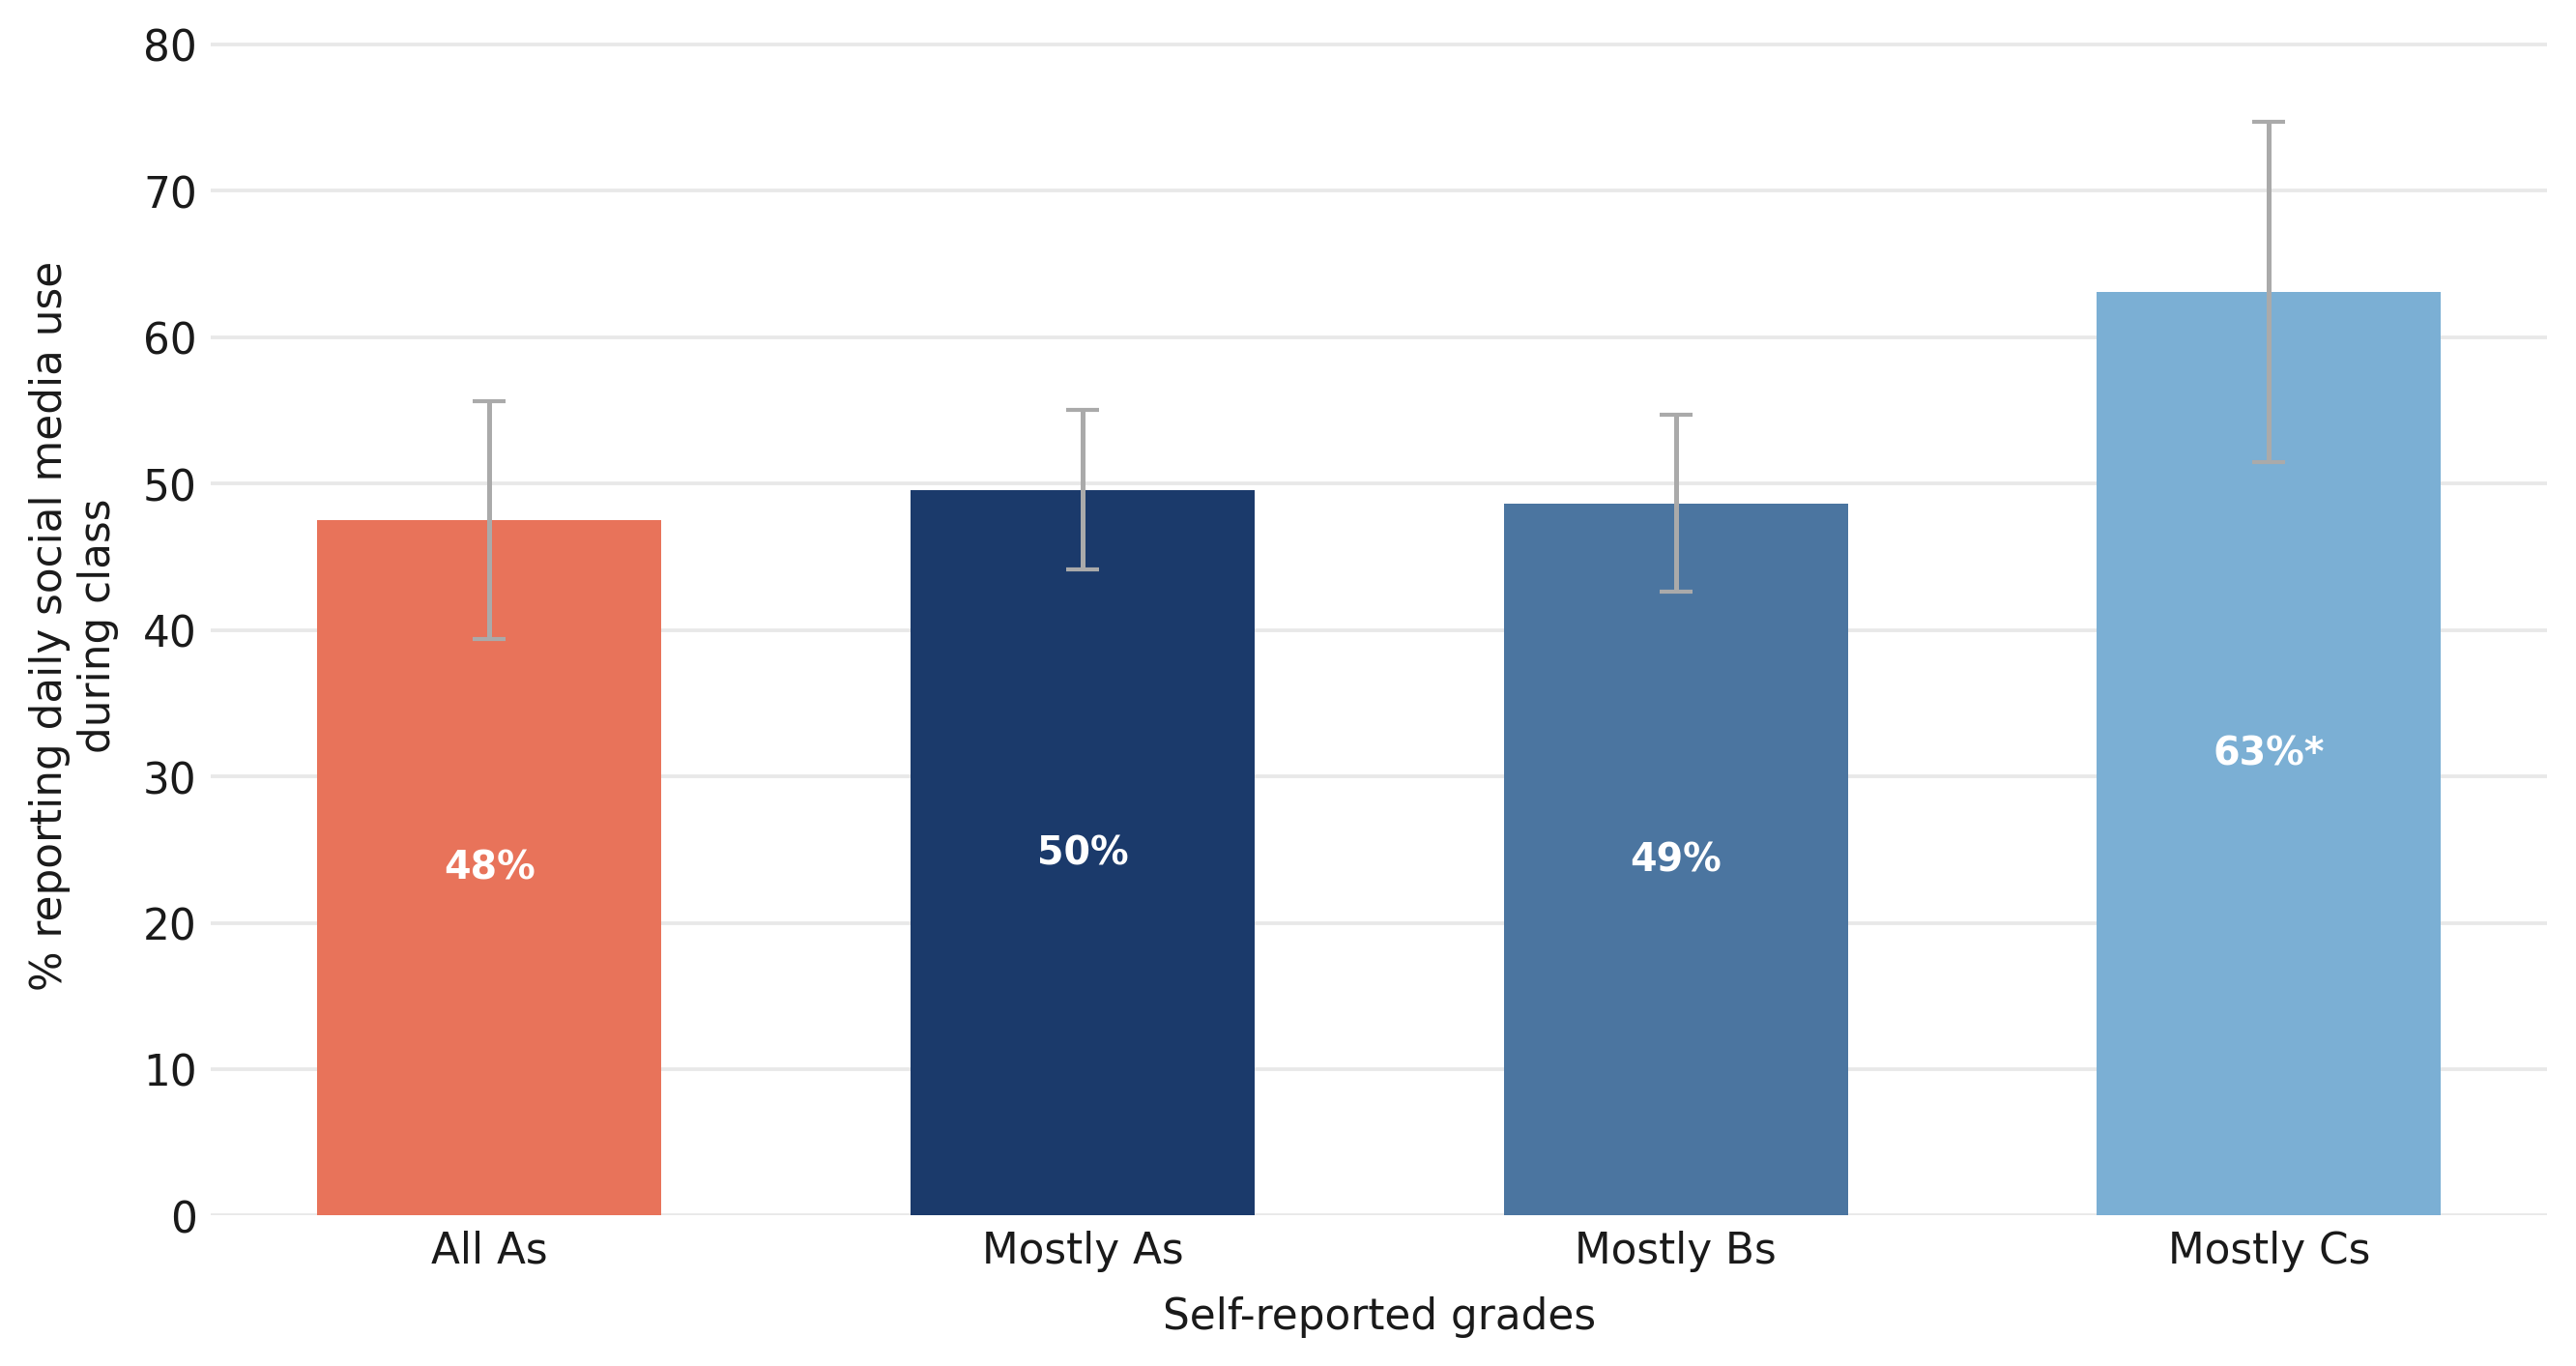
Note: Each bar represents the percent of respondents who report using social media “multiple times a day” or “once a day,” depending on how respondents characterize the grades they earn/earned in high school. The salmon-colored bar indicates the reference category; confidence intervals calculated at the 95% level; + = p<0.1, * = p<0.05, ** = p<0.01, & *** = p<0.001.
Finding 2 AI is undermining the high school experience.
The emergence of generative AI has introduced a new and more fundamental challenge to the integrity of high school academics. Unlike social media or gaming, which distract students from doing their work, AI tools can do the work for them—almost instantly, fluently, and in ways that are difficult to detect. The survey data suggest that the misuse of AI in academics has already moved from novelty to norm: Most respondents report at least some unsanctioned use of AI, and a large majority believe that academic work has been devalued as a result.
Finding 2a. A quarter to almost half of respondents say they use AI to bypass the learning process; even more say their peers do.
When asked which tasks they had used AI to complete during the school year, respondents reported a wide range of applications—some broadly considered legitimate, some not (Figure 6). Among the most common uses were explaining difficult concepts (50 percent), brainstorming ideas (47 percent), and providing feedback or edits on papers (38 percent). But a substantial share report using AI in ways that bypass the learning process entirely: 48 percent use it to solve math problems, 36 percent to summarize books or other texts to avoid reading them, 29 percent to write the first draft of an essay or report, and 26 percent to help during quizzes or tests.
That last data point is particularly sobering. Quizzes and tests are among the primary tools used by teachers to evaluate individual student mastery; that a quarter of respondents report AI assistance during those evaluations speaks to a fundamental breakdown in the integrity of academic assessment. The use of AI to avoid reading assigned texts is similarly corrosive: whatever skills and knowledge those texts were meant to build go unbuilt when a summary suffices.
Figure 6. The most common uses of AI are legitimate, but many students also use it to cheat.
Note: Percentage of respondents who report using AI for each task during high school.
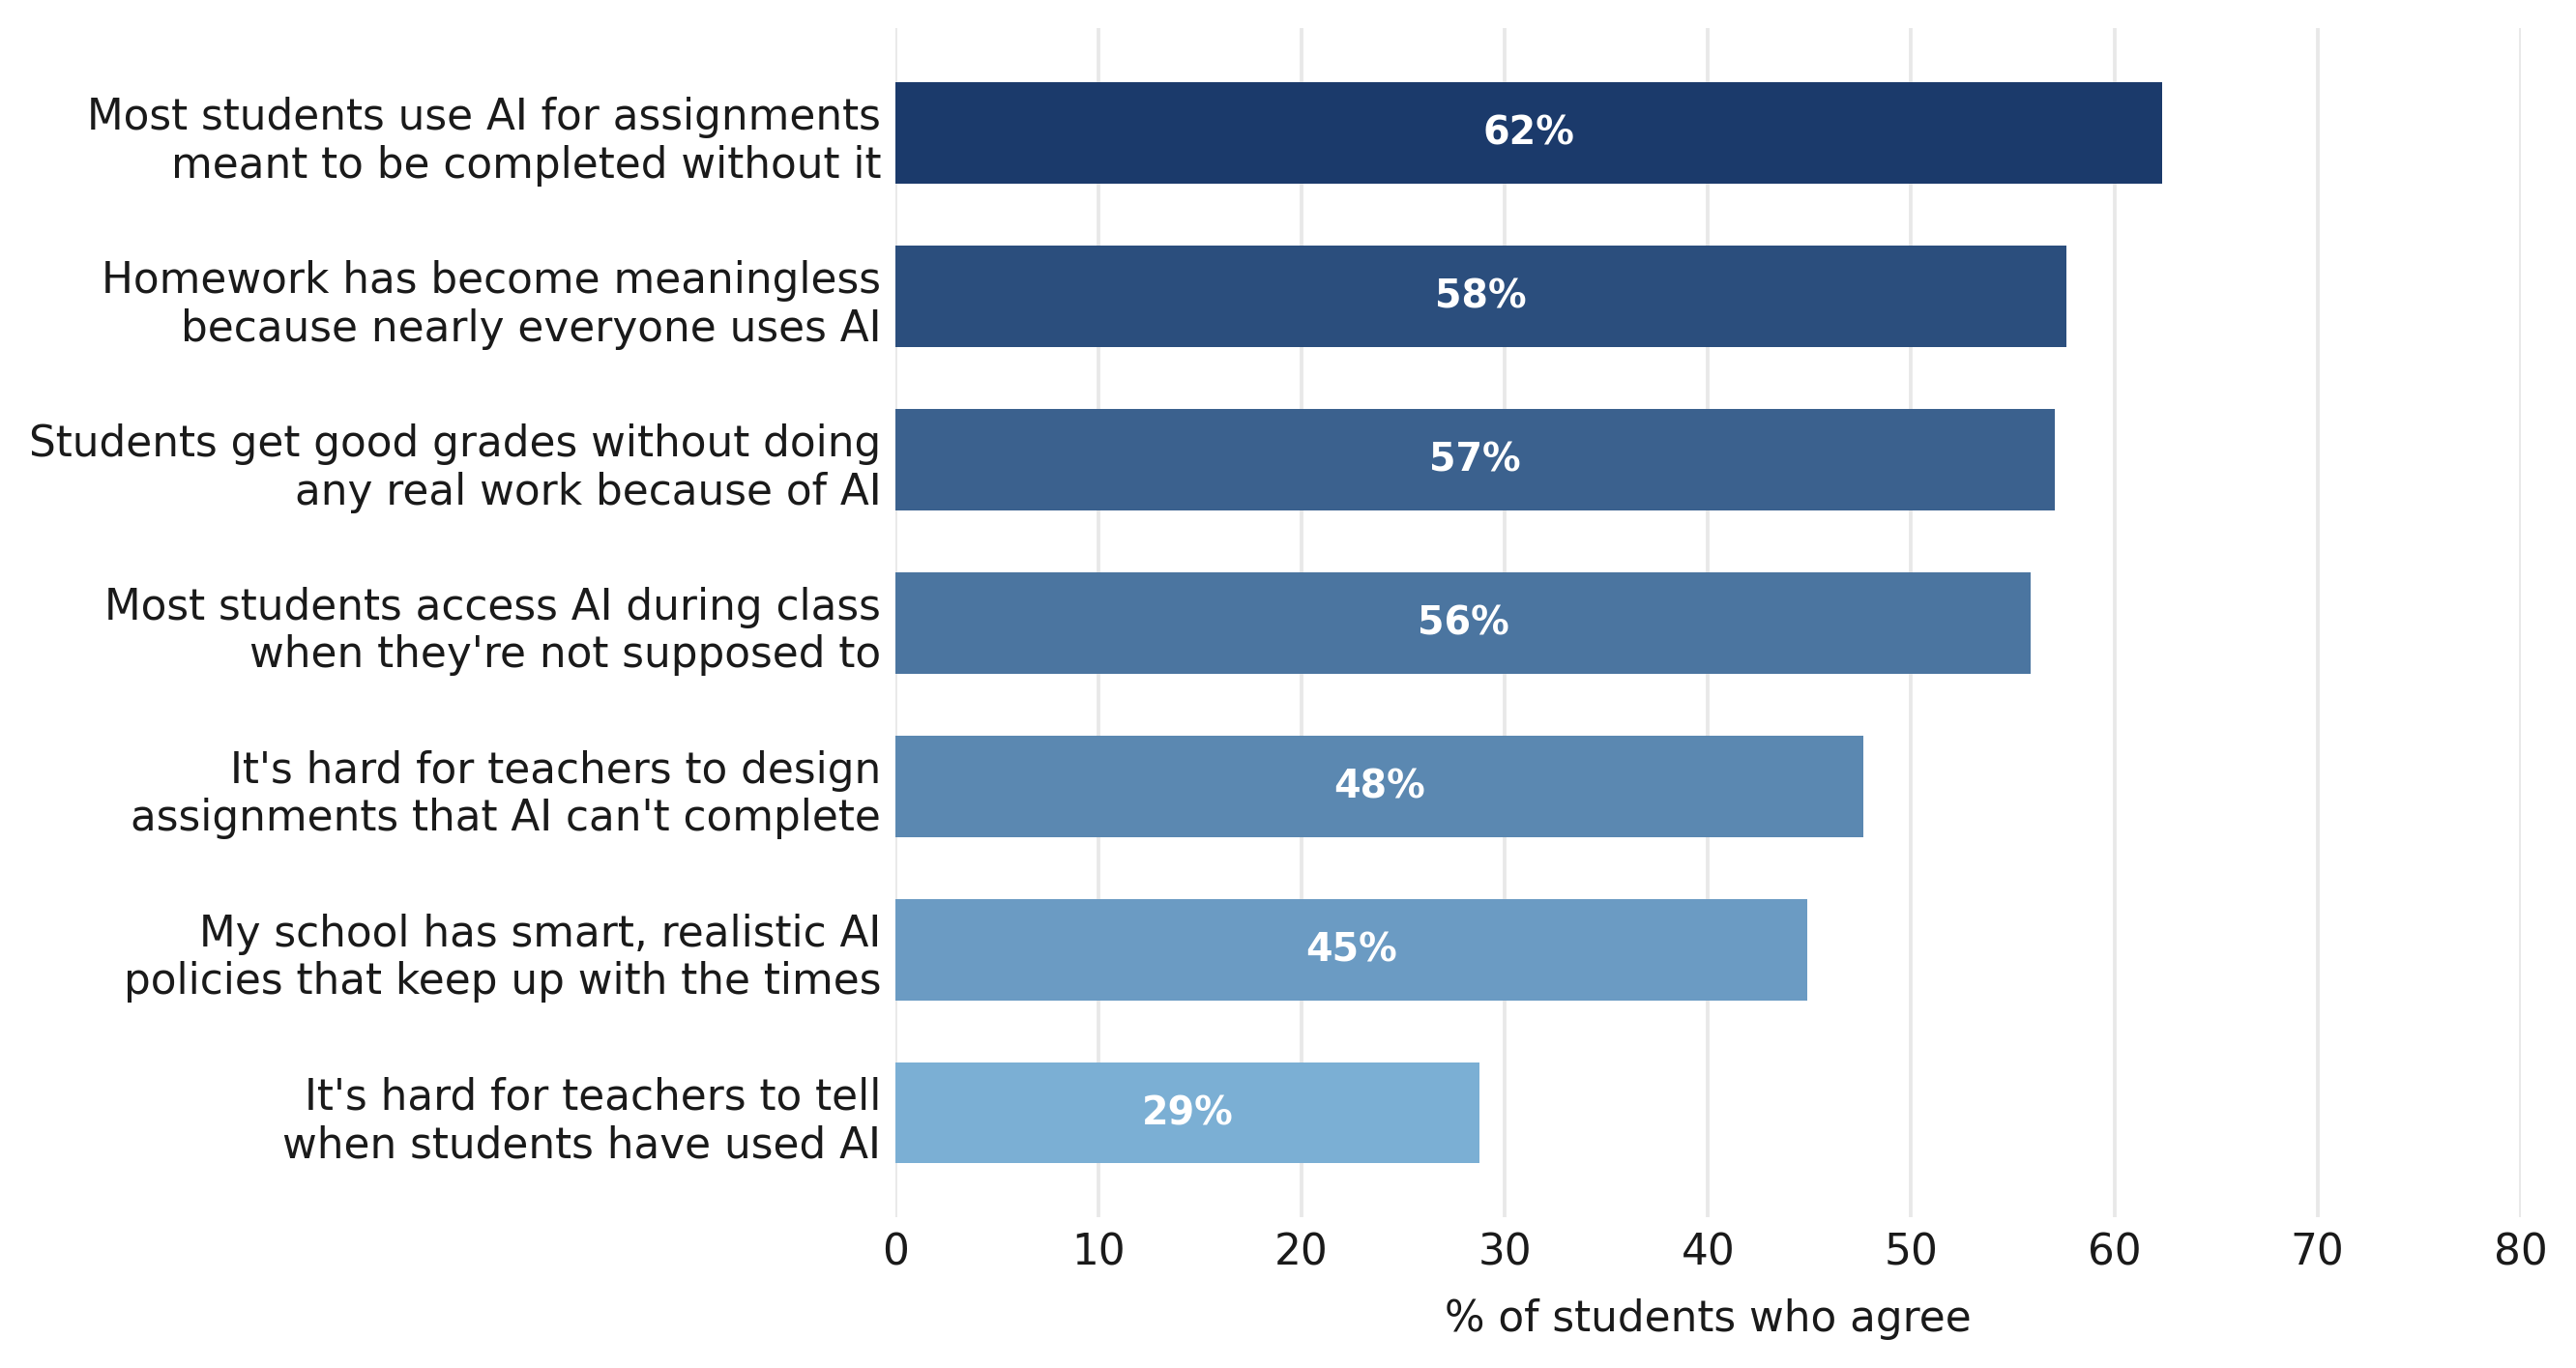
Students are not only using AI improperly themselves—they are well aware that their peers are doing the same. Sixty-two percent agree that most high school students are using AI for assignments that are supposed to be completed without it, and 57 percent agree that high schoolers who have done no real work are getting good grades thanks to AI (Figure 7). Fifty-eight percent agree that homework has become meaningless because nearly everyone is using AI. Fifty-six percent say that most high school students are using AI in class when they are not supposed to be. Since respondents tend to be more candid about peers than about themselves, these peer-directed responses are likely closer to the truth than the self-reported rates cited earlier.
These are damning numbers—and they come from students themselves, not from teachers or outside observers. The perception that AI use is universal, that it enhances one’s GPA, and that it has hollowed out the value of homework represents a profound legitimacy crisis for academic work as currently structured. Students who choose to do their own work face a real or perceived disadvantage relative to peers who outsource it, which creates a powerful incentive to do the same.
Figure 7. Current and former high school students view AI as undermining their education, not enhancing it.
Note: Bars represent the combined percentage of respondents who either “strongly agree” or “somewhat agree” to each statement.

Finding 2b. Half of respondents say it is difficult for teachers to come up with AI-proof assignments.
The survey also reveals how students perceive teachers' capacity to respond. Nearly half of respondents—48 percent—agree that it is hard for teachers to come up with assignments that cannot be completed by AI (Figure 7 above). Only 45 percent say their school has smart, realistic policies around AI that keep up with the times—meaning most students view their school's AI governance as inadequate.
Finding 3 Most U.S. high school students and recent graduates say they spend the majority of class time on school-provided devices.
Beyond illicit use of school-provided devices, the survey raises broader questions about the sheer extent to which such devices have come to dominate the high school day. Nearly a third of respondents—29 percent—say they spend 75 percent or more of their class time on a school-provided device (Figure 8). An additional 33 percent say they spend between half and three-quarters of class time on such devices. In total, 62 percent of respondents say school-issued devices occupy a majority of their in-class time.
This level of device dependence has implications that extend beyond distraction. When most of the school day is organized around a screen, the dividing line between sanctioned academic work and unsanctioned browsing becomes invisible to the teacher. A student who appears to be staring at a screen and typing may be completing an assignment—or messaging a friend, watching a video, or asking AI to write their response. The survey data suggest this ambiguity is a meaningful driver of the problems documented in Findings 1 and 2.
Figure 8. Most respondents report spending between half and three quarters of their school day on a school-issued device.
Note: Bars represent the percent of respondents across self-reported levels in response to the question, “In a typical day, how much of your class time do/did you spend working on a device provided by your high school, such as a laptop or tablet?”

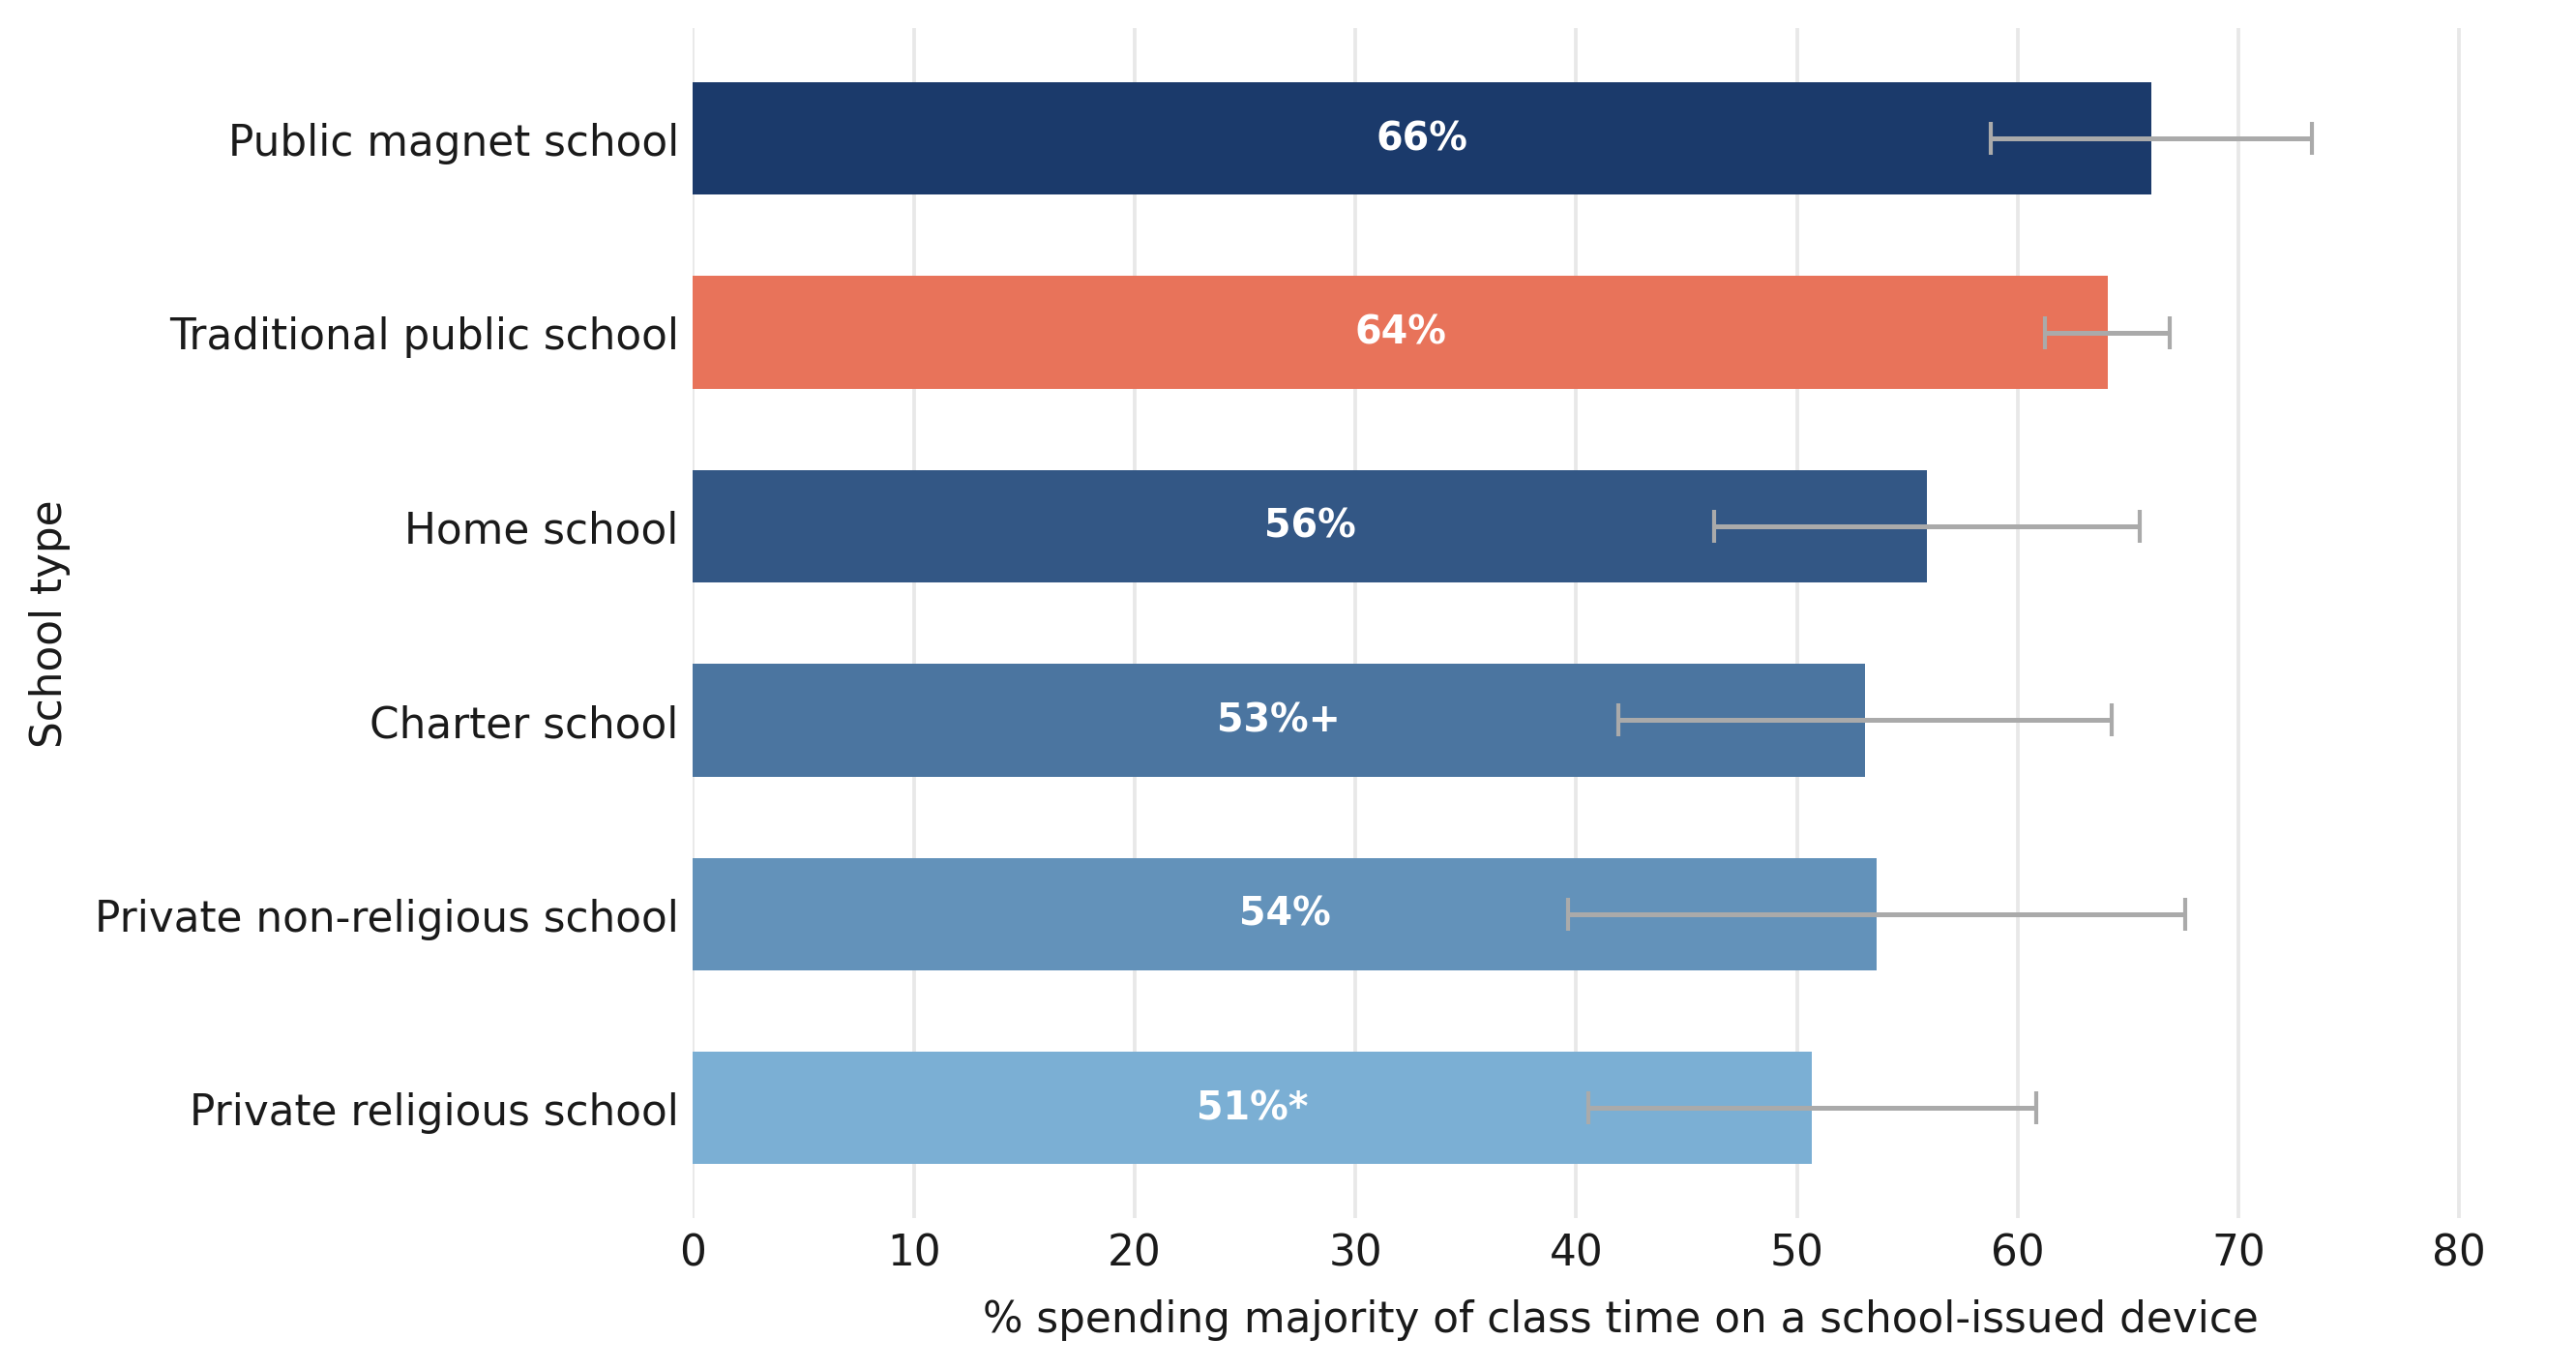
This rate is lower in charter, private, and home schools. Respondents in traditional public schools report among the highest rates of frequent use on school-issued devices: 64 percent say they spend the majority of their days on them (Figure 9). These rates are significantly lower at private religious schools (51 percent), where the difference is unlikely to be due to chance. The rate is also lower in charter schools (53 percent), though that difference is only marginally significant. All other differences are statistically insignificant due to small sample sizes.[6]
Figure 9. Time on screens is lower in charter and private schools.
Note: Bars represent the percentage of respondents who report spending 50% or more of their time spending on school-issued devices depending on school sector. The salmon-colored bar indicates the reference category; confidence intervals calculated at the 95% level; + = p<0.1, * = p<0.05, ** = p<0.01, & *** = p<0.001.
Finding 3a. Device use is linked to students thinking they can get away with missing school.
Heavier reliance on school-issued devices is associated with a weaker belief that attendance matters. Among respondents who spend three quarters or more of their class time on devices, 35 percent think they could get away with skipping school without it affecting their grade. By comparison, just 16 percent of those who spend a quarter or less of class time on devices think they could get away with skipping class (Figure 10).
Figure 10. Respondents who spend more class time on school-issued devices are more likely to believe that missing school won’t affect their grades.
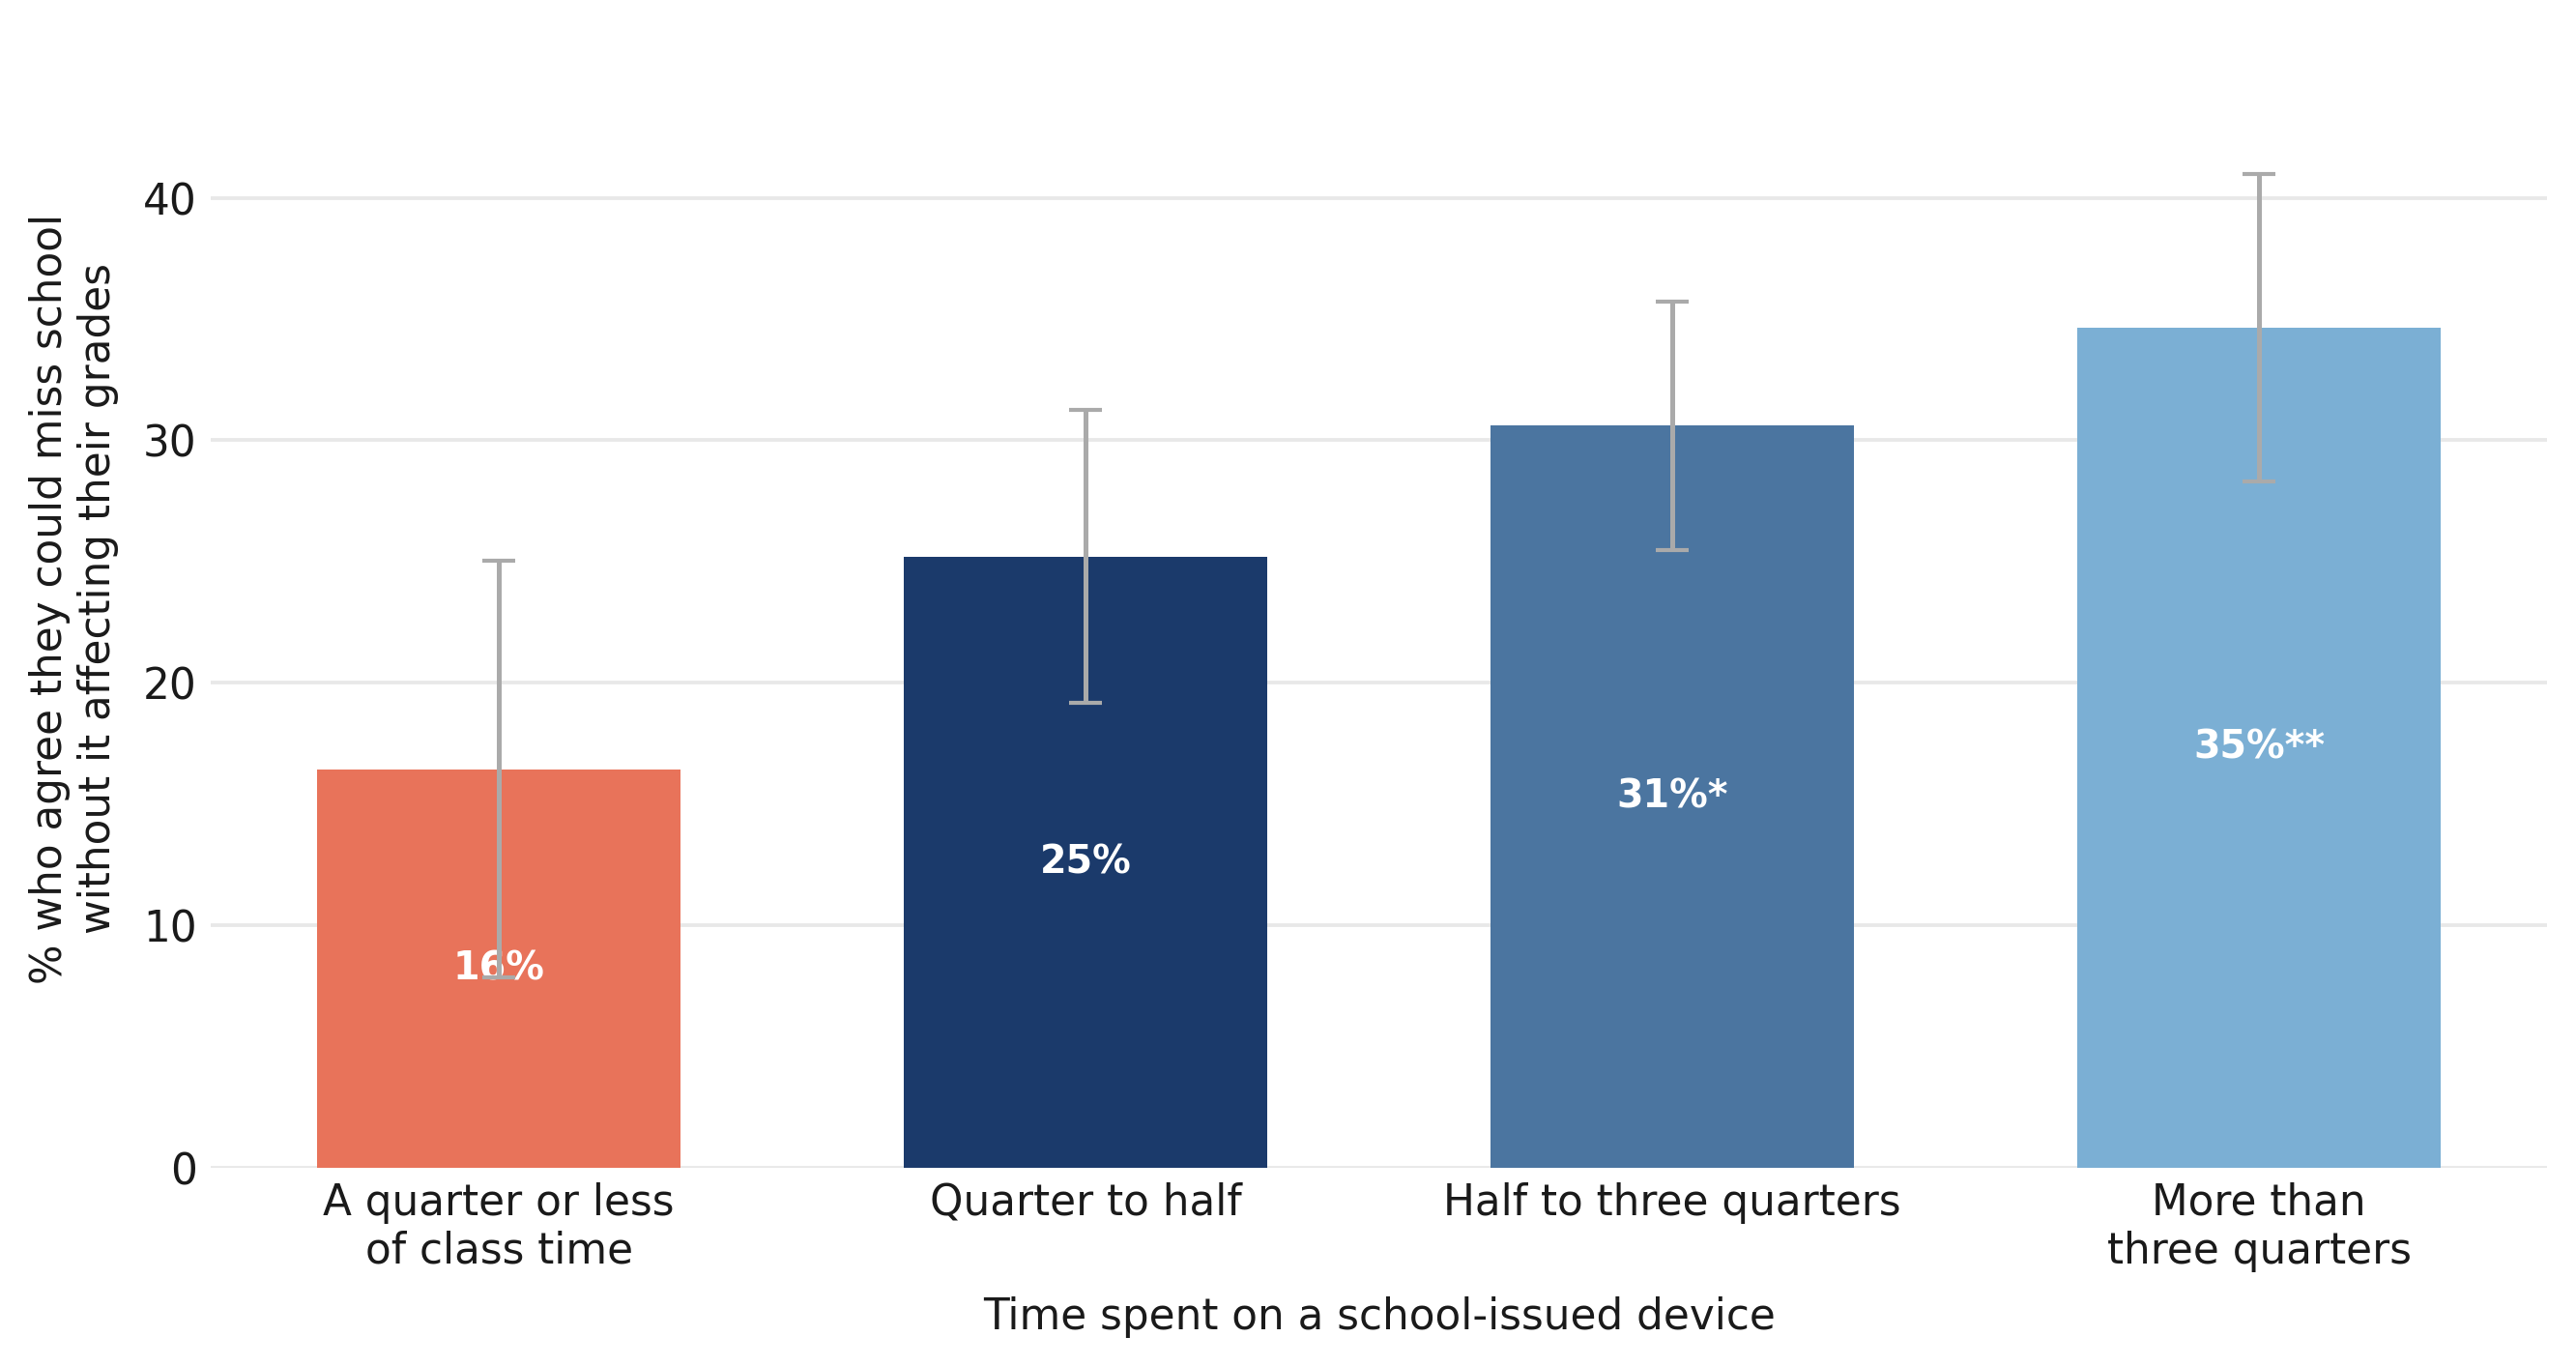
Note: Bars represent the combined percentage of respondents who strongly or somewhat agree with the statement, “I could miss school often and it wouldn't really affect my grades,” depending on the amount of time respondents report spending on school-issued devices. Only 39 students reported using devices for “no class time at all.” This category was removed for clarity. The salmon-colored bar indicates the reference category; confidence intervals calculated at the 95% level; + = p<0.1, * = p<0.05, ** = p<0.01, & *** = p<0.001.
Finding 4 Weak grading standards make distraction and AI misuse worse.
Pervasive distraction, widespread AI misuse, and heavy device dependence might matter less if academic standards were robust enough to ensure that honest effort remained a prerequisite for earning good grades. The survey data suggest that’s not the case. A substantial share of respondents report that schools award partial credit for never-submitted work, impose no penalties for late assignments, and allow unlimited test retakes. At the same time, a majority of respondents report earning all A’s or mostly A’s, including many whose standardized test scores suggest that their academic performance is well below that level.
Finding 4a. Over a quarter of survey respondents report getting partial credit for missing assignments.
When students fail to turn in an assignment, the consequences vary considerably by school. Overall, 55 percent of respondents say they receive a zero for missing work, while 29 percent say they receive partial credit even when work is never submitted (Figure 11). An additional 12 percent say there is no consistent policy at their school. In other words, the incentive to complete every assignment is compromised, if not negated, for a non-trivial number of respondents.
Figure 11. Almost one in three students (29 percent) say that they get partial credit for missing assignments.
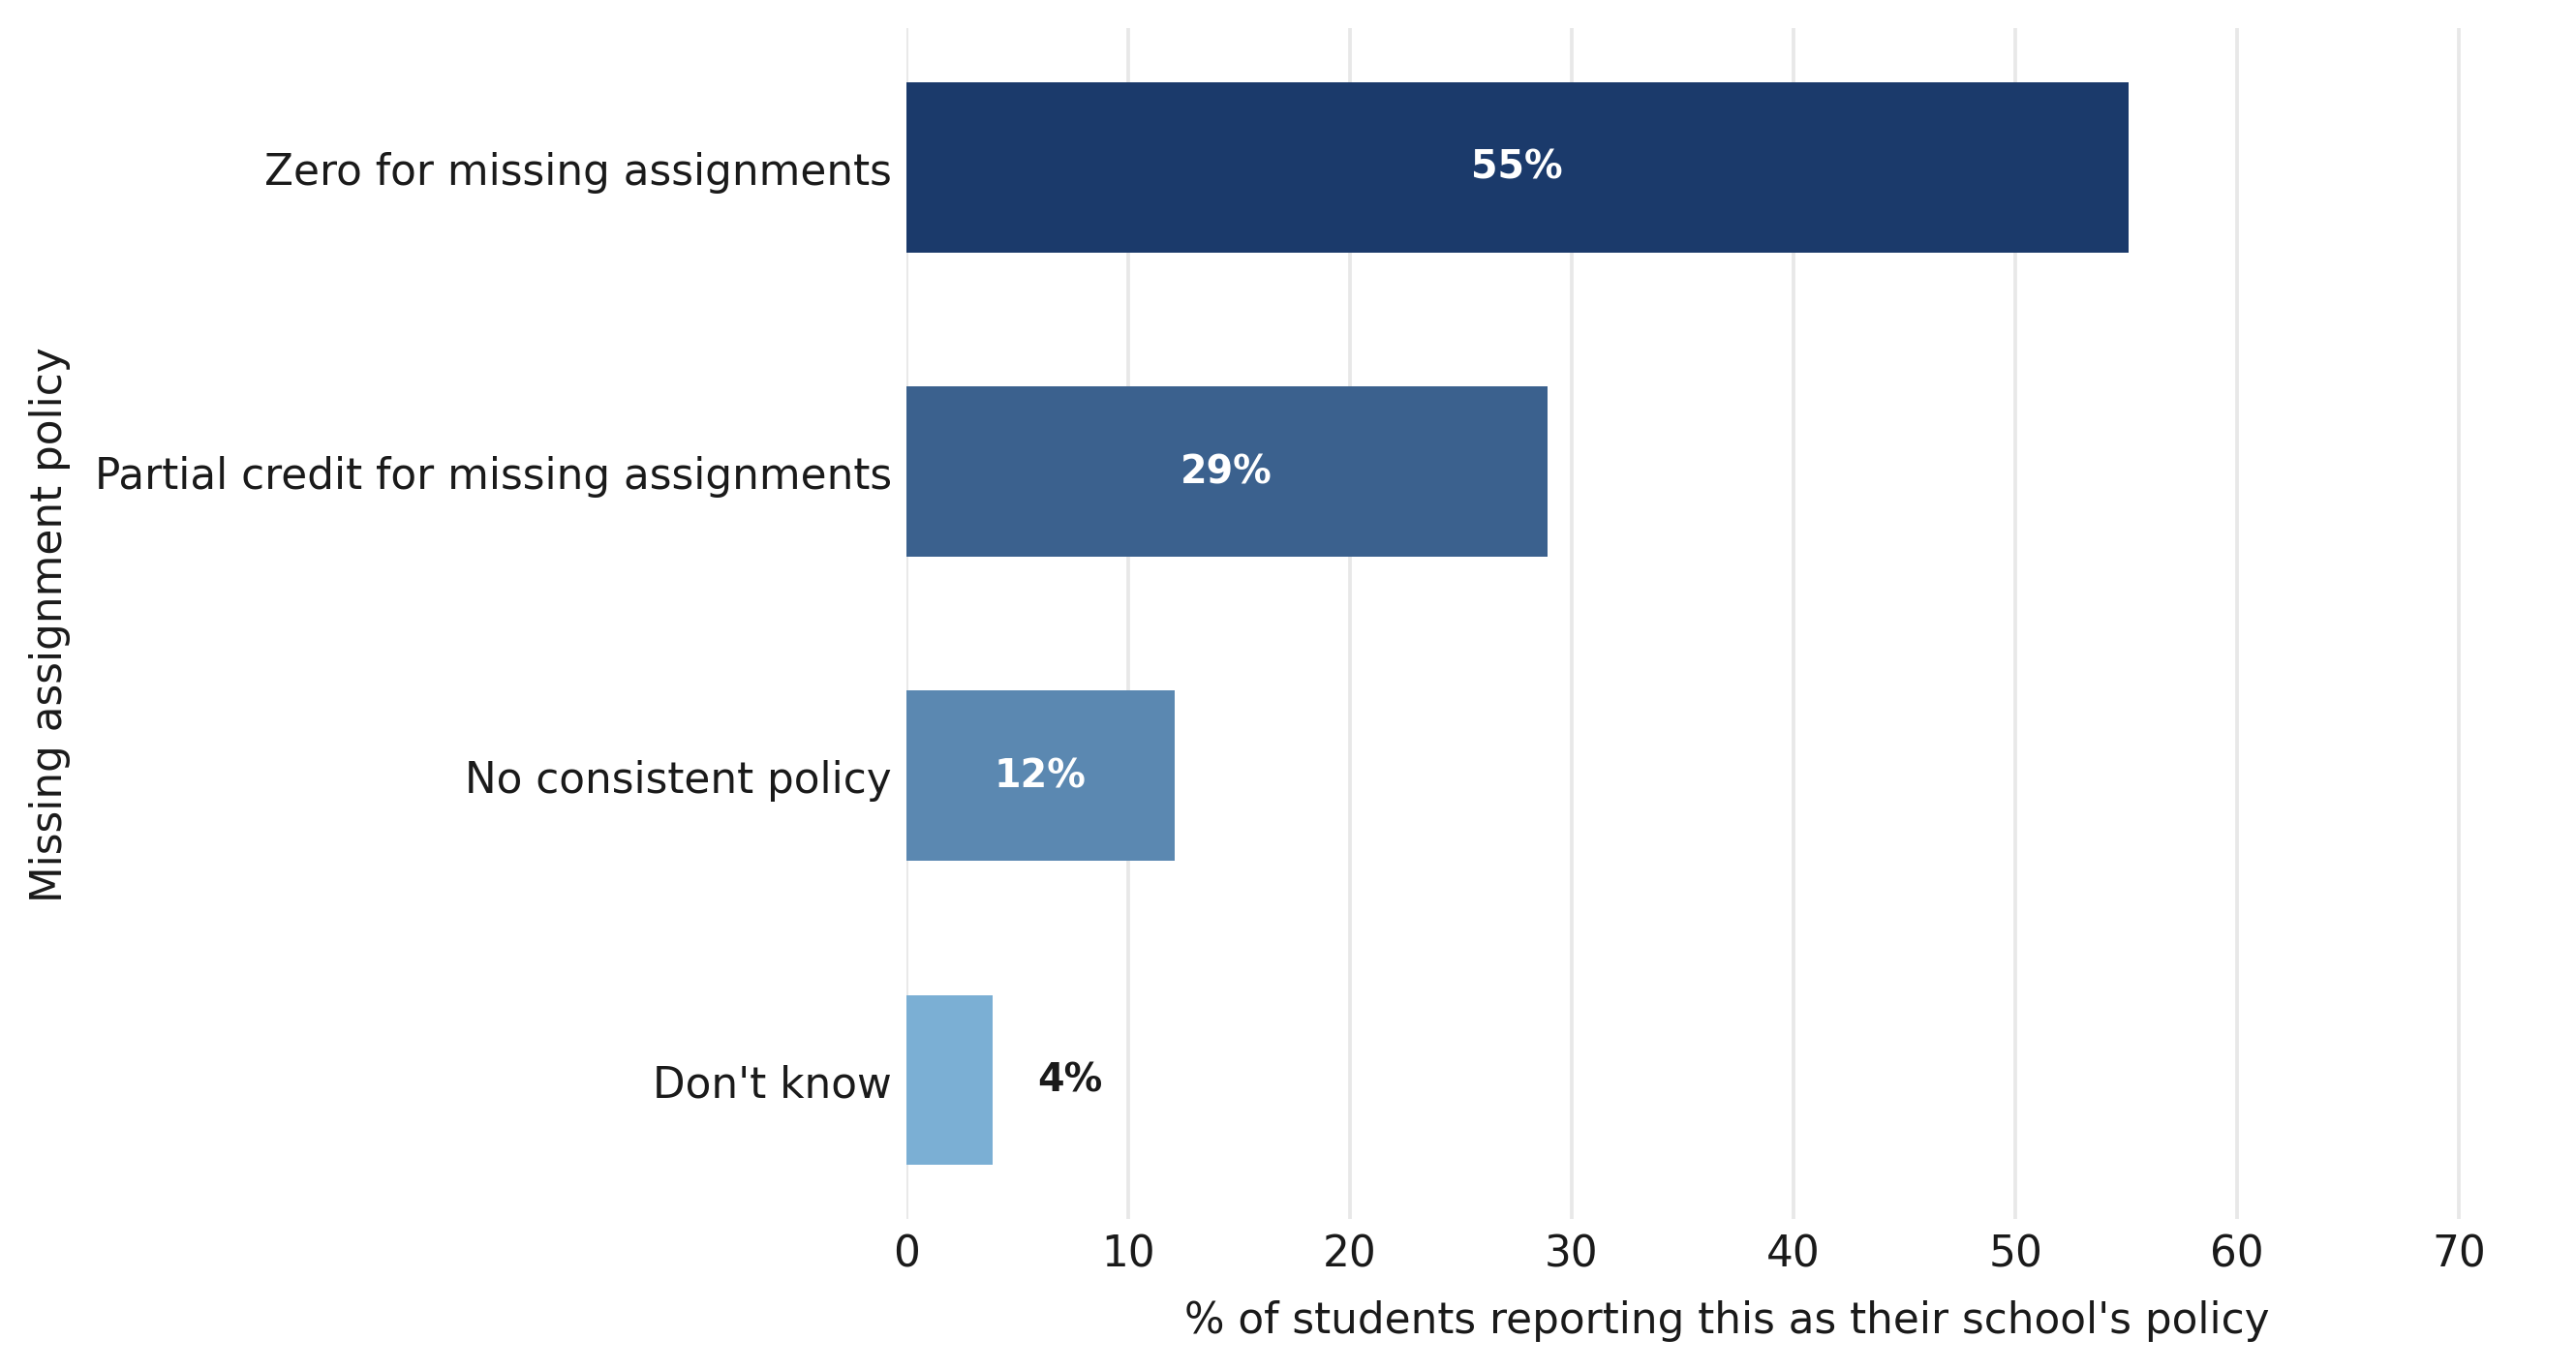
Note: Bars represent the percent of respondents who reported that their school employed each policy for addressing missing assignments.
Most high school respondents also report that they can retake tests or quizzes (Figure 12). An occasional retake for extenuating circumstances makes sense, but making retakes the default policy further erodes the consequences for falling behind.
The most common retake policy is a single retake with the higher score counting (46 percent), followed by a single retake averaged with the original score (23 percent). Nineteen percent say their teachers generally do not allow retakes at all, while seven percent say they can retake exams as many times as they wish.
Figure 12. The vast majority of survey respondents say that they can retake tests and quizzes at least once to improve their grade.
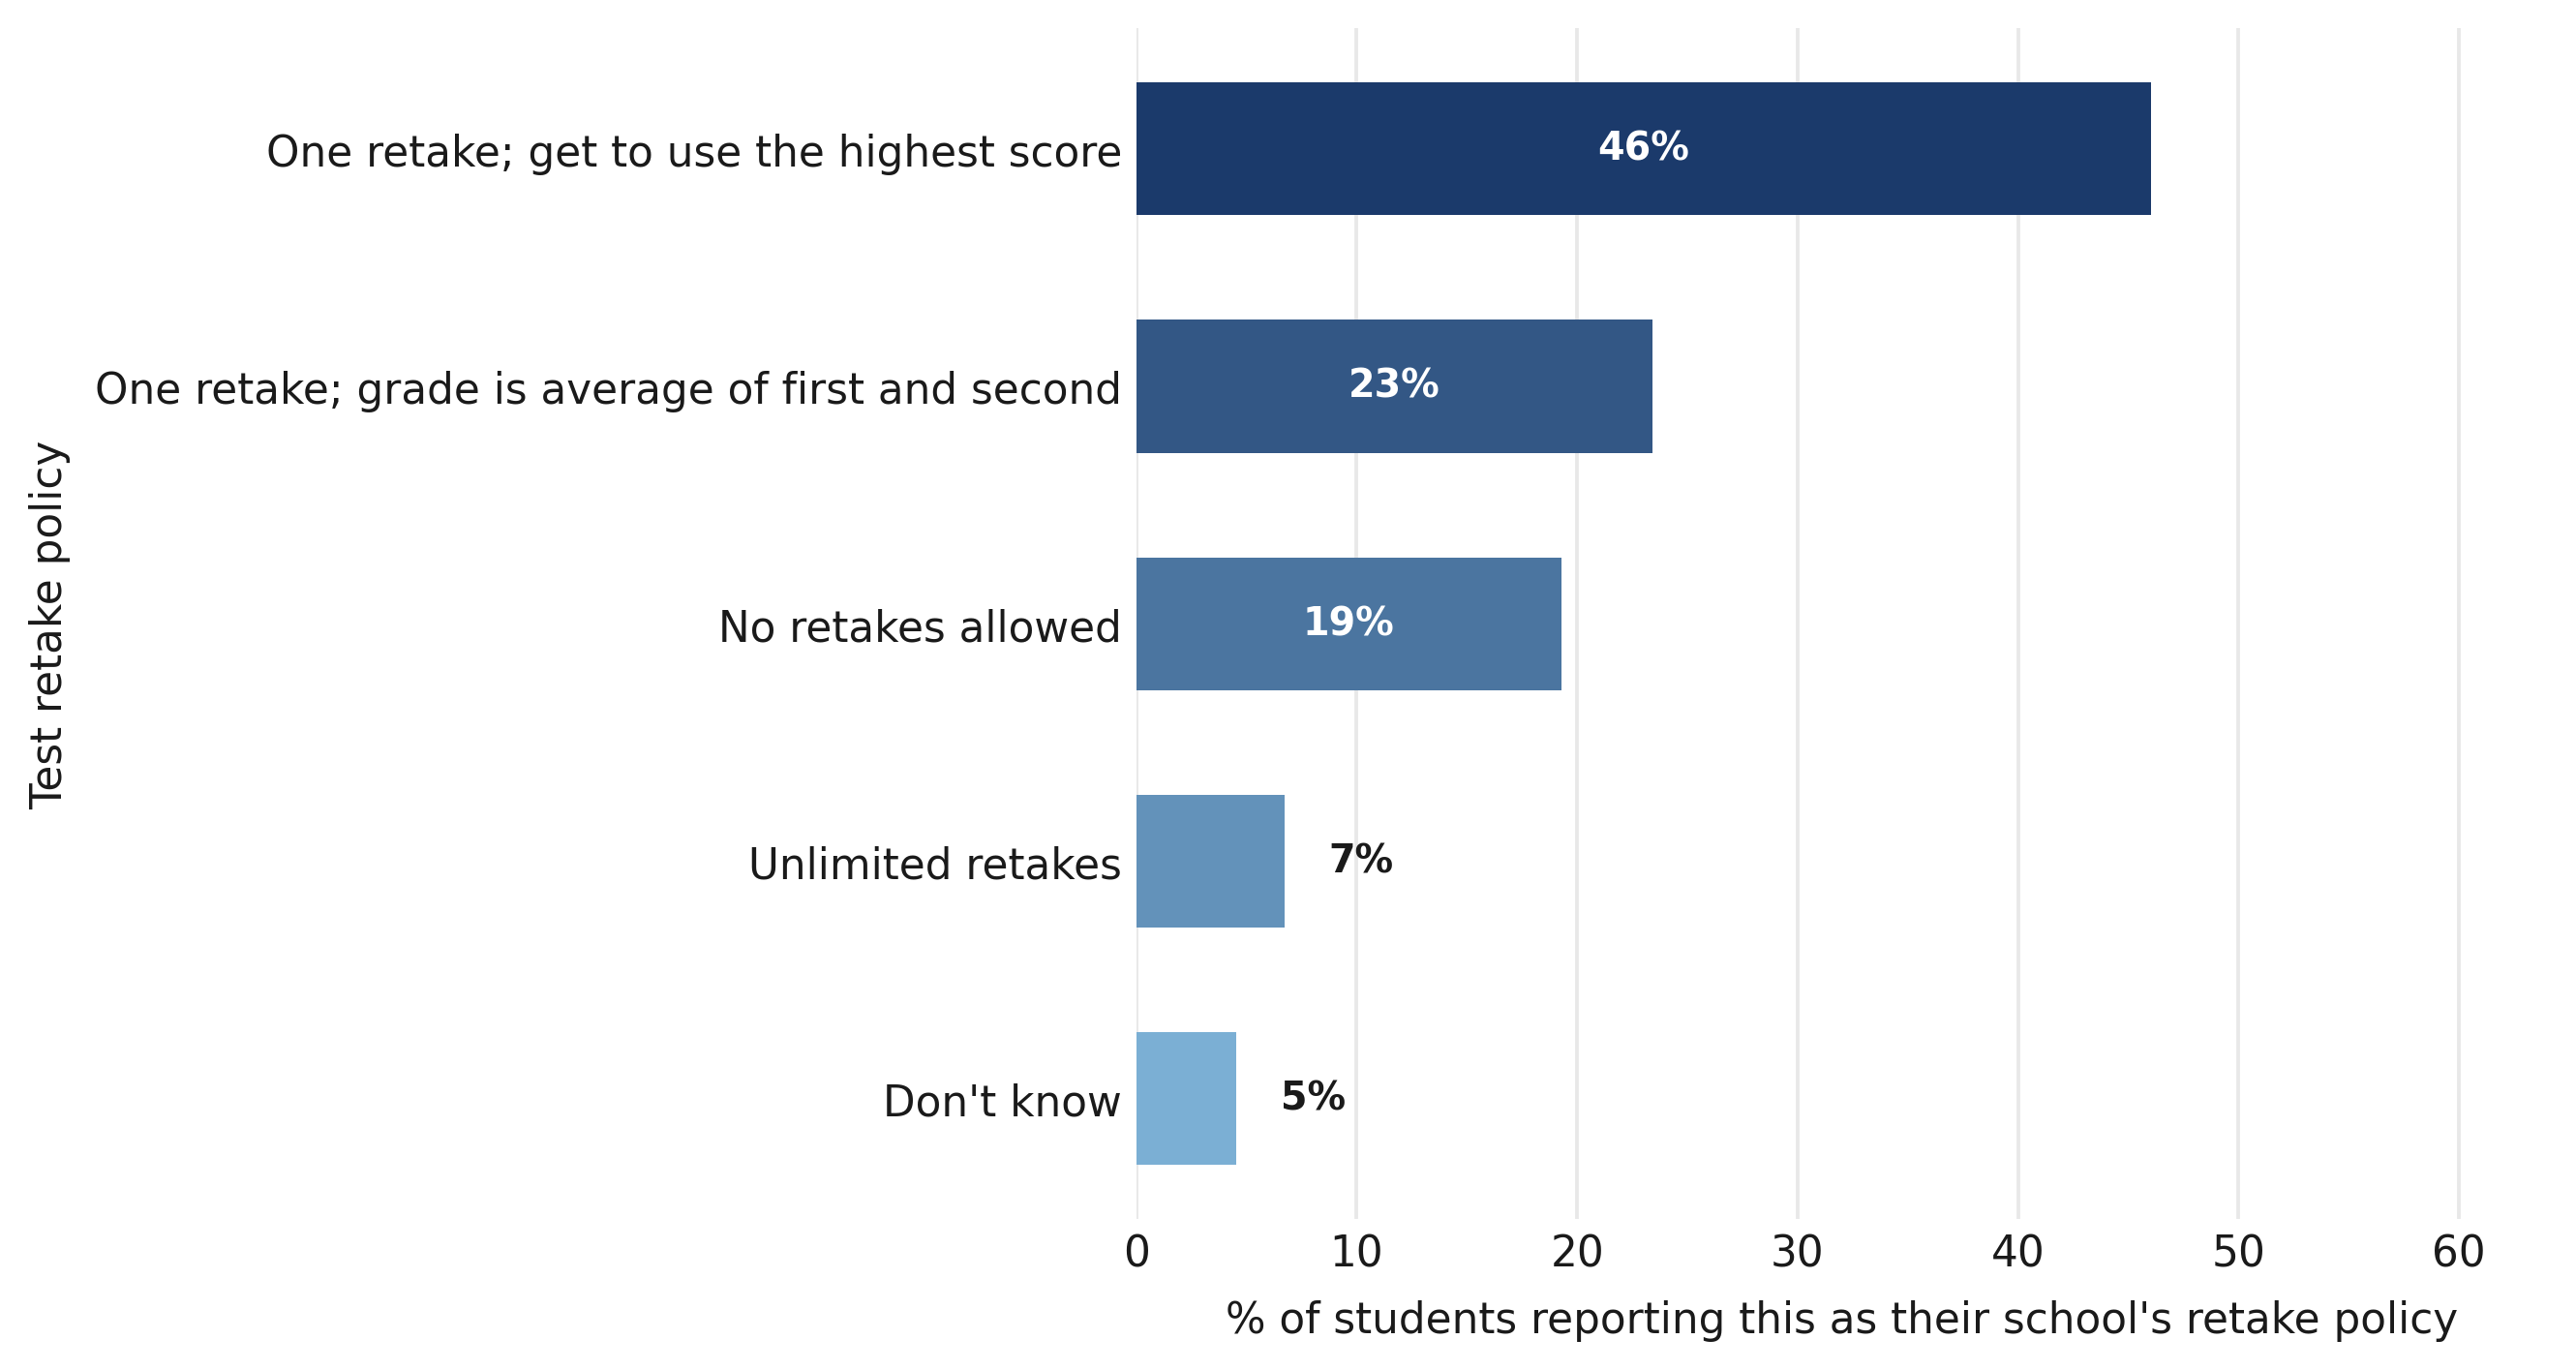
Note: Bars represent the percent of respondents who reported that their school employed each policy for retaking tests or quizzes.
Interestingly, recent graduates who attended high schools with stricter grading and retake policies are more likely to say that high school prepared them well for life after graduation (not shown).
Test Retake Policy by Context
There are stark differences between school sectors regarding retakes (Figure 13). Respondents in private religious schools are more than twice as likely as those in traditional public schools to report that test grades are final (43 percent versus 20 percent), while respondents in charter schools are almost half as likely to report the same (11 percent versus 20 percent).
This may reflect the demographics of students served by these sectors. In fact, retake bans are significantly less common for Black (15 percent) and Hispanic (15 percent) respondents and significantly more common for Asian respondents (33 percent) when compared to White respondents (23 percent). We lack data on school context or socioeconomic status that would allow us to dig into this dynamic further. It is troubling that grading standards appear to vary systematically by the racial composition of the students served, and future research with richer contextual data should examine why.
Figure 13. Respondents in private religious schools are more than twice as likely to report no retakes compared to traditional public-school respondents.
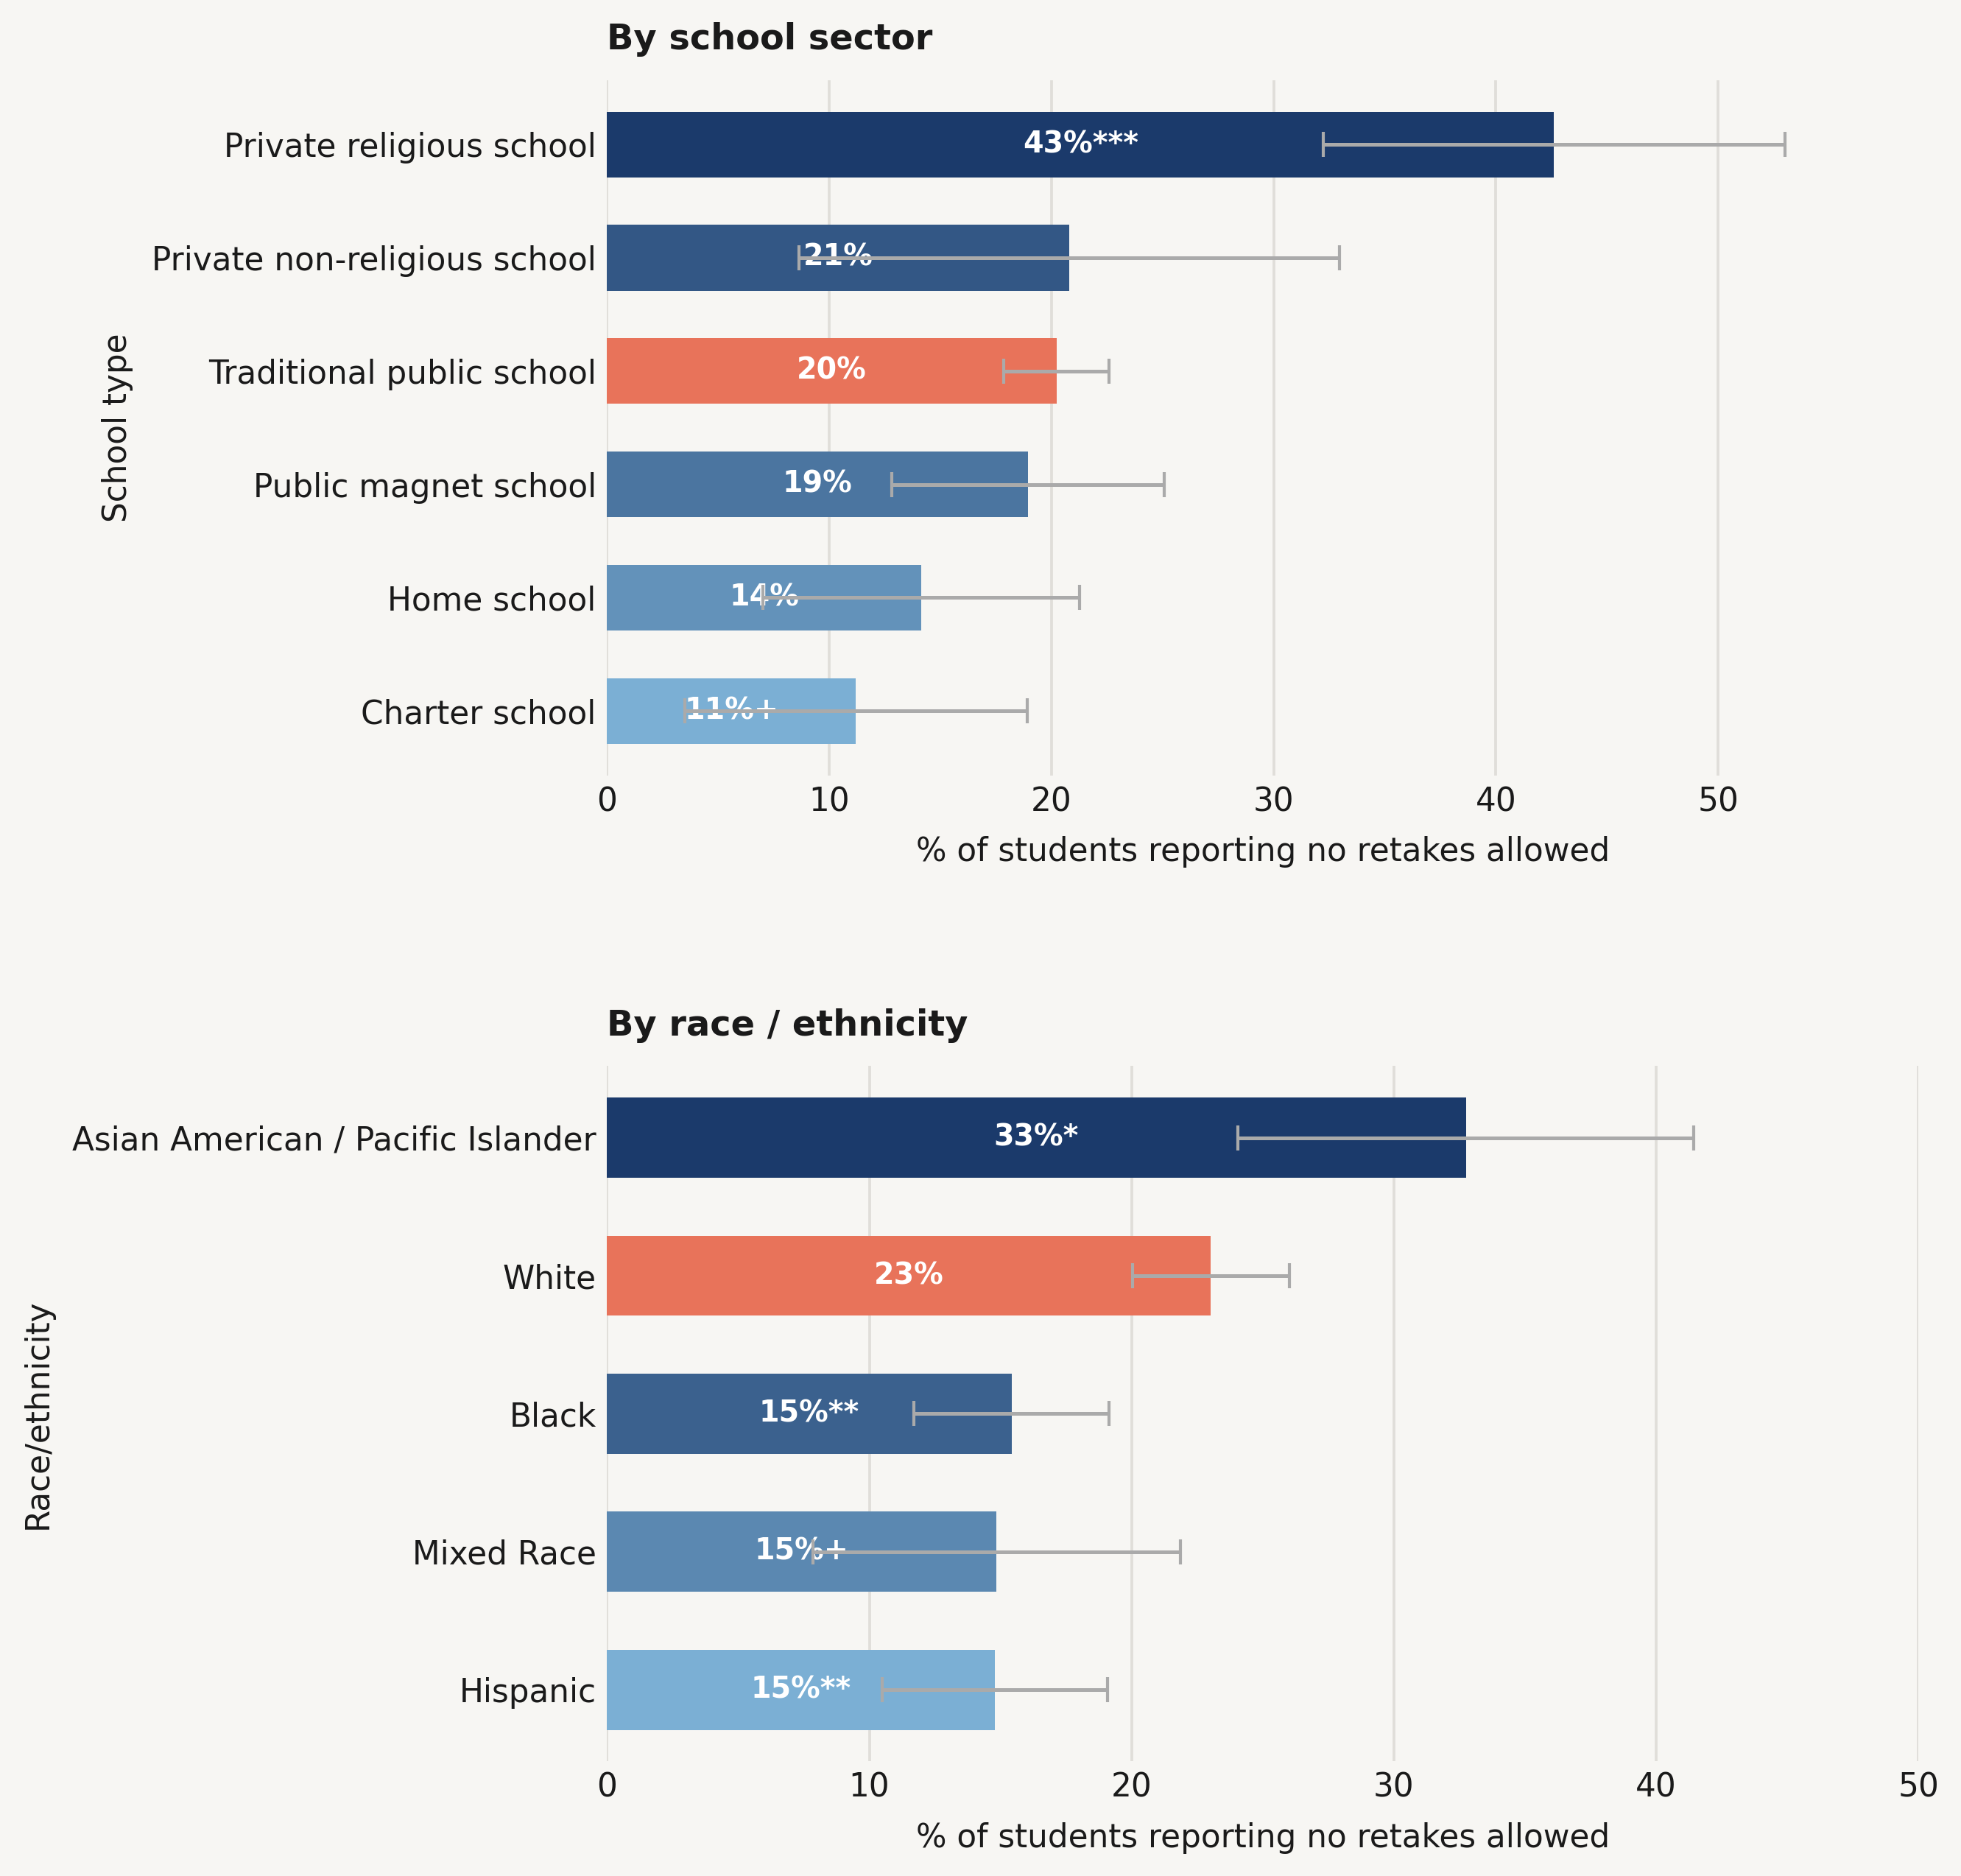
Note: Bars represent the percent of respondents who say that retaking tests or quizzes is not allowed by school sector and respondent race/ethnicity. The salmon-colored bar indicates the reference category; confidence intervals calculated at the 95% level; + = p<0.1, * = p<0.05, ** = p<0.01, & *** = p<0.001.
Finding 4b. Over half of respondents (57 percent) report getting “all A’s” or “mostly A’s,” including a sizable portion of students with low SAT and ACT scores.
Grade distributions in American high schools have become heavily compressed at the top. Fifty-seven percent of students report earning all A’s or mostly A’s; specifically, 17 percent report all A’s and 40 percent mostly A’s (Figure 14). Just 31 percent report mostly B’s, and fewer than 10 percent report mostly C’s or below. By comparison, the distribution of scores on national standardized assessments suggests that actual academic performance is distributed far more broadly—raising serious questions about whether today's high grades reflect genuine mastery of course content.
Figure 14. Most respondents report that they get all or mostly A’s.
Note: Bars represent the percent of respondents who placed themselves in each category, based on how they characterize the grades they earn/earned in high school.
The SAT and ACT score breakdowns illustrate the disconnect. Among students who scored under 1000 on the SAT, 44 percent report earning all or mostly As. On the ACT, 33 percent of respondents scoring between 16 and 19 report the same (Figure 15). These two cutoffs are roughly equivalent to the national average for these two tests, meaning that these respondents are in the bottom half of the achievement distribution, yet at least one in three are still earning all or mostly As.
Figure 15. A sizeable minority of respondents at the bottom of the SAT and ACT score distributions still report getting all or mostly A’s.
Panel A
Panel B
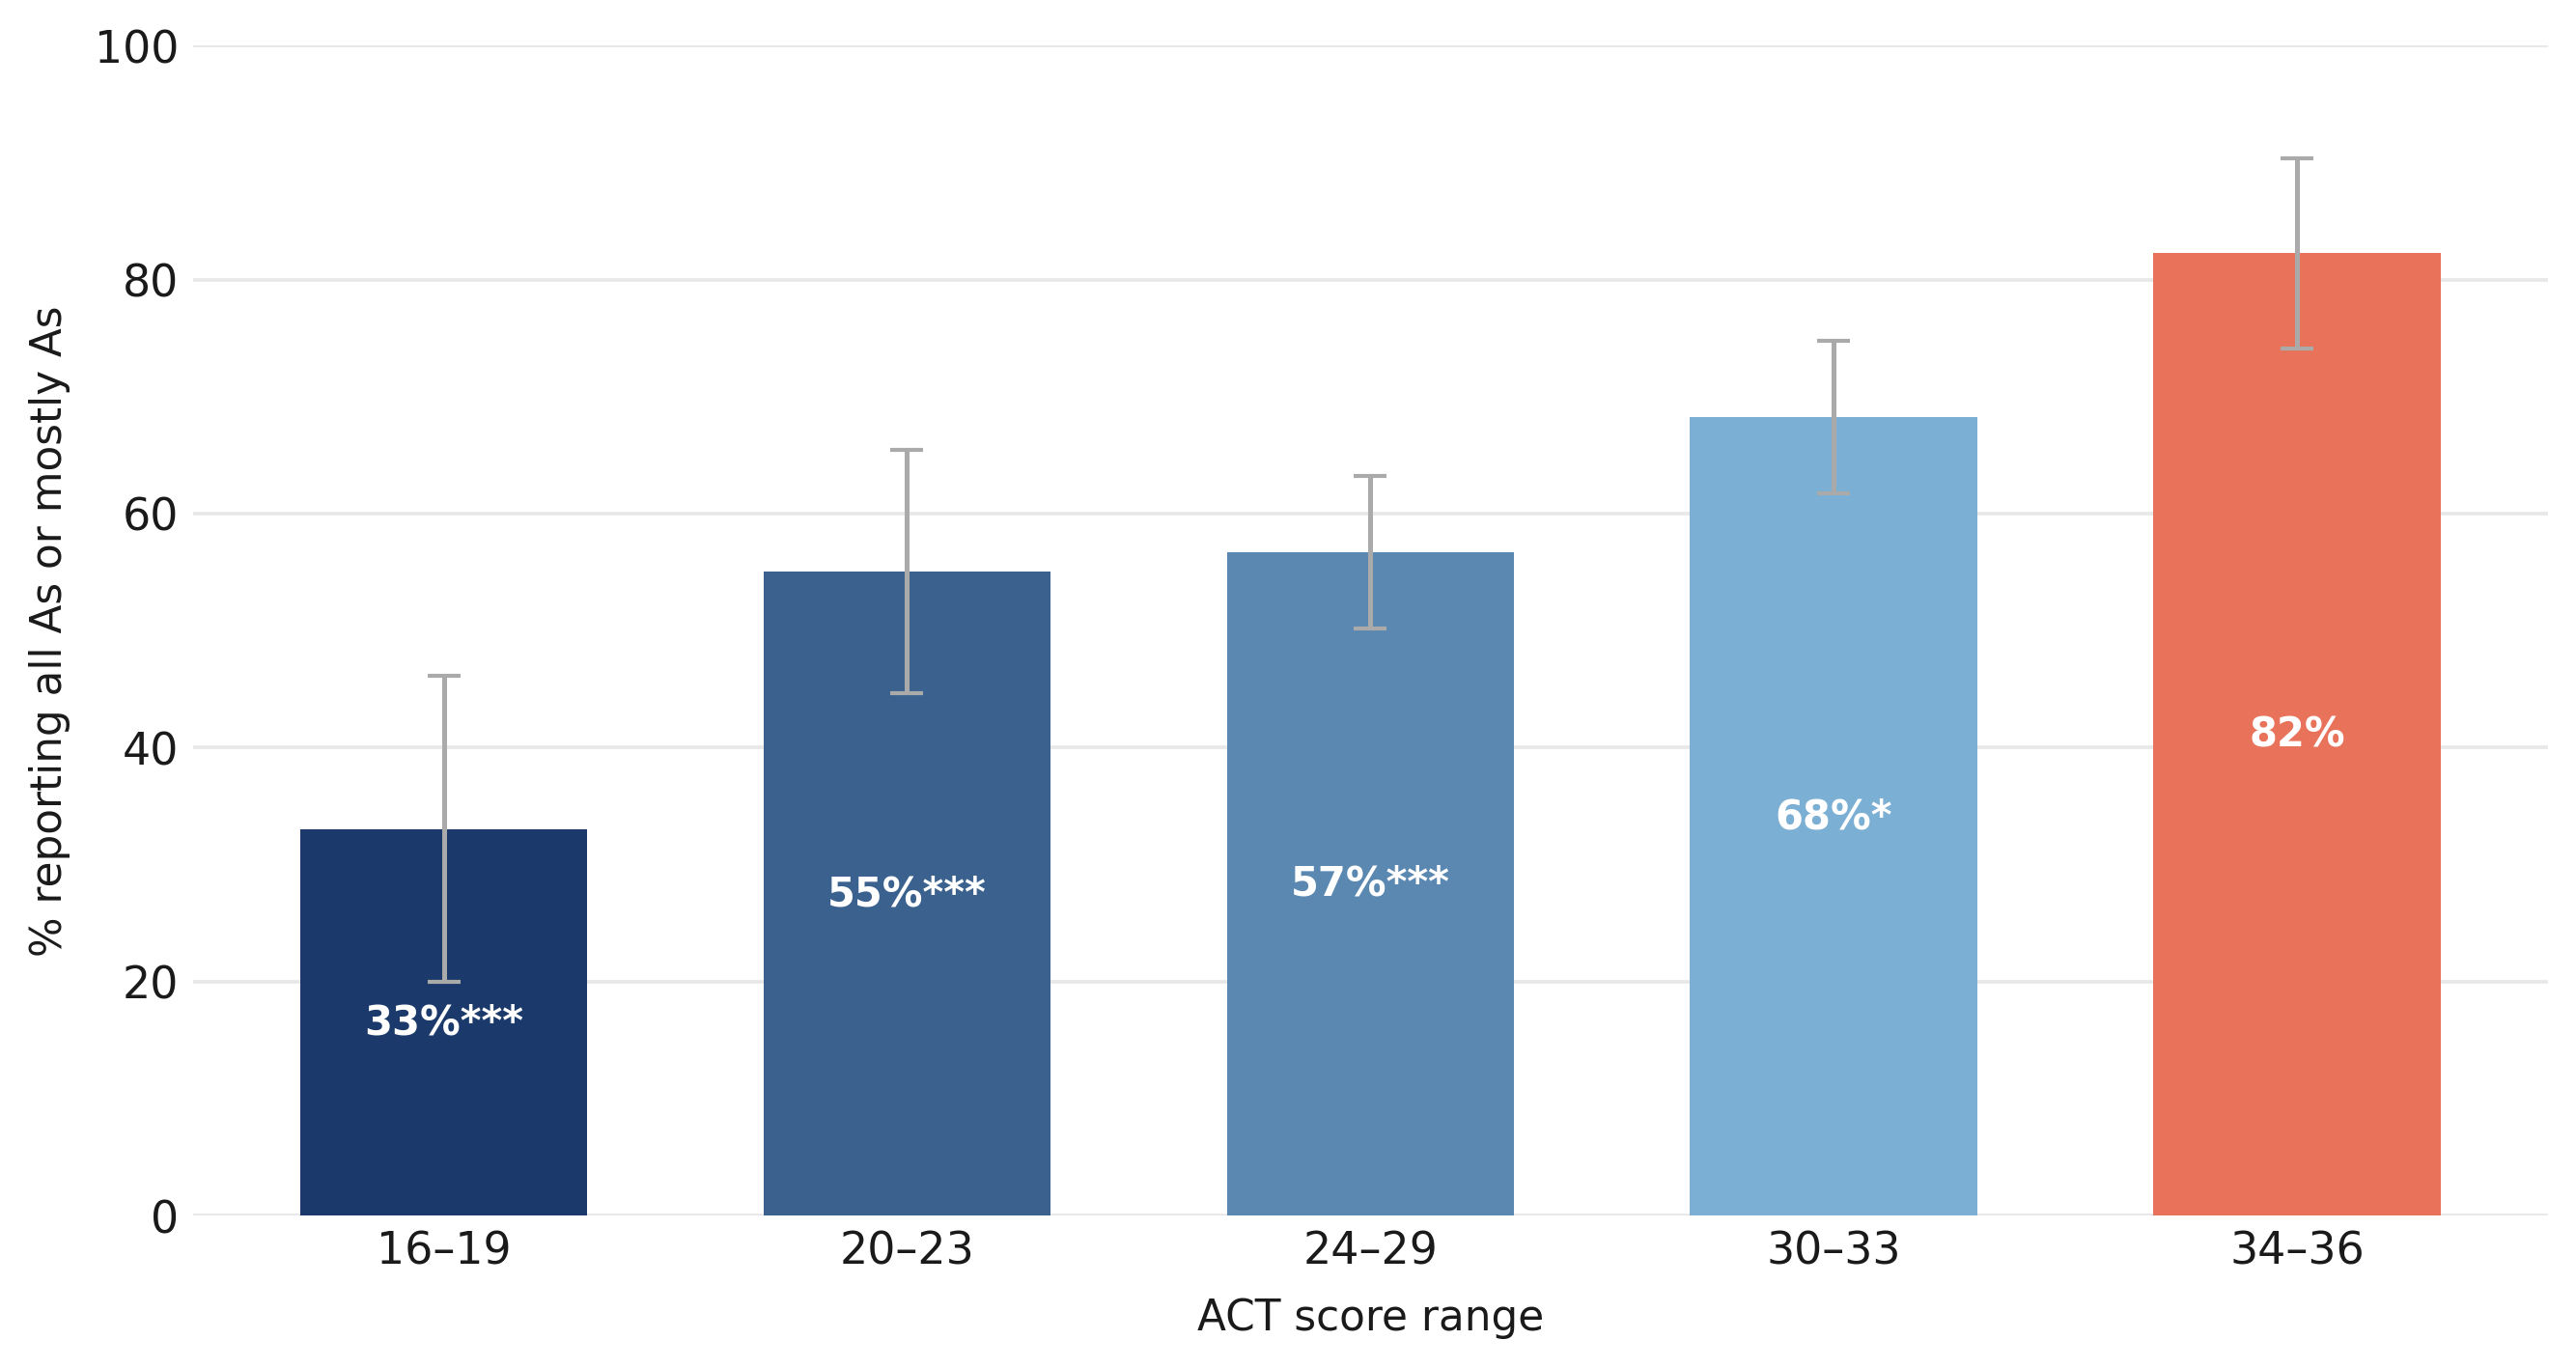
Note: Bars represent the percent of respondents by how they characterize the grades they earn/earned in high school depending on their self-reported SAT or ACT score. The salmon-colored bar indicates the reference category; confidence intervals calculated at the 95% level; + = p<0.1, * = p<0.05, ** = p<0.01, & *** = p<0.001.

Of course, grades reflect more than test performance (effort, participation, rigor, and so on), so a perfect correspondence between SAT/ACT scores and high school grades would be unrealistic. The concern is not that grades bear no relationship to achievement, but that they appear heavily compressed at the top, which makes high grades a less reliable signal of mastery. It also deprives students of the opportunity to be pushed to reach their greatest educational potential.
Recommendations
The report’s findings point toward a set of practical steps that states, districts, and schools can take to diminish device dependence and misuse, restore the integrity of academic work, and ensure that grades once again reflect what students know and can do.
1. Reduce the amount of time students spend on devices.
The survey data make clear that school-issued devices are a major vehicle for distraction and AI misuse—and that the more time students spend on them, the less inclined they are to show up and do their own work. When it comes to school-issued devices, all schools should decide on usage targets and should even consider strict limits enforced by software that locks students out of these devices once these limits are exceeded.
This is not an argument against technology in education, but the time has come to impose limits on tech use. The evidence here and elsewhere is clear: without such limits, technology tends to consume instructional time rather than supplement it. Fortunately, schools do not have to make these decisions blindly. Most education technology platforms already provide administrators with metadata on student device use, including when, how long, and for what purposes devices are being used.
2. Place greater reliance on in-class, paper-and-pencil and oral exams, and reorient outside-of-class work around preparing for these exams.
If AI tools can write essays, summarize readings, and assist during take-home tests, then any assignment or assessment that can be completed outside of direct teacher supervision is no longer a reliable measure of individual student ability. Schools should place substantially greater weight on in-class, paper-and-pencil and oral assessments, where AI assistance is not available and where what a student knows is directly observable. Whenever possible, those assessments should also be anchored in common or external standards—including statewide end-of-course exams, AP-style exams, or other assessments with fixed criteria—and graded by someone other than the student’s own teacher, ideally without the grader knowing whose work is being evaluated. Homework can retain a role in supporting preparation for such assessments, rather than being graded.
This approach has two advantages: it makes grades a better measure of what students know, and it creates a more appropriate role for AI in high school. If a student uses ChatGPT to prepare a study guide for an in-class exam on the Civil War, reviews it carefully, and then earns an A on the exam, that seems like a reasonable use of the tool. But if the same student uses AI during the exam to generate an essay or complete exam questions for them, the grade no longer reflects the student’s own understanding. In-class, paper-and-pencil assessments are therefore the best available tools for raising standards and limiting AI misuse.
3. Make grading expectations school-wide and explicit by eliminating routine exam retakes and enforcing meaningful consequences for late work.
This report does not provide ironclad evidence supporting a no-retake exam policy, but there was never any evidence supporting the choice to move away from such policies in the first place. Similarly, schools should adopt explicit policies that impose meaningful consequences for late assignments.
It is also high time to treat “grading for equity” policies, specifically unlimited exam retakes and no penalties for late assignments, for what they are—a trendy but risky experiment targeting disadvantaged students that has no serious evidence backing it up. Also, given how popular these policies have become and the continued support they draw in education, we recommend district-wide bans on both policies.
4. Ensure that the firewalls on school-issued devices work and proactively use settings that inhibit off-task technology use.
Two-thirds of students report that YouTube is accessible on school-issued devices. More than a third say the same about recreational games and online shopping. Whatever access controls are currently in place, the data suggest they are not doing what they were designed to do. Districts should use the tools that technology companies have already put at their disposal to limit what students can access on school-issued devices during the school day, close known gaps, and ensure that permitted platforms are limited to genuinely educational purposes.
Many of the tools already in wide use make this easier than it might seem. Google Classroom, for instance, allows administrators to restrict which websites students can visit on school-managed Chromebooks and to monitor activity in real time; YouTube offers a restricted mode that filters mature content, including limiting content to a playlist curated by a teacher. Still, technical controls are necessary but not sufficient. Firewalls can fail, filters can be circumvented, and platform-level settings work only when paired with clear expectations and consistent enforcement. Districts and schools should lead this work, but state education agencies, ed-tech entrepreneurs, and parents all share responsibility for ensuring that devices are used for the pursuit of learning, not distraction.
5. Adopt stricter bans on cell phones and other personal devices.
Students in schools with the tightest phone policies—requiring phones to be locked in pouches or left in a central office—report daily social media use at rates nearly half those of students in schools where phone policies are left to the discretion of individual teachers. The recent momentum behind stricter phone policies in many states and districts is well-placed. Schools that have not yet adopted clear, consistently enforced phone-free policies should do so—and those policies should encompass other personal devices like iPads and smartwatches too. Schools that have adopted such policies in name but not in practice should ensure consistent enforcement.
The five steps outlined here are not new. They would restore norms that governed American high schools until recently: high academic standards, clear consequences, and reasonable limits on activities that distract students from learning. Technology has changed; the underlying challenge has not. High schools exist in part to prepare students for the challenges of adult life, and the evidence in this report suggests that too many are failing at that task. The young people surveyed here know it. They are asking, in their own way, for adults to hold the line. We should do exactly that.
Endnotes
[1] LAUSD had already implemented a student cellphone ban during the school day. See here: L.A. Unified Becomes Largest School District Nationally to Approve Cell Phone Ban During School Day
[2] One international example: In Australia, 4 of 5 adolescents confess to circumventing a nation-wide ban on social media use for those under 16.
[3] That said, the survey did not ask whether this use occurred during class, between periods or during study hall, lunch, free time, and so on.
[4] More students report being able to access online activities (see Figure 2) than confess to using them regularly (see Figure 1). For instance, 39% of students say they could access online shopping at school using a personal device only and another 34% said they could access it via a school-issued device for a total of 73%. By contrast, only 16% said that they used online shopping (via any medium) daily.
[5] This runs counter to recent news reports that most young people have an easy time getting around such restrictions. Our finding may reflect the wording of the question—perhaps students think it is difficult to get around firewalls but manage to do so anyway.
[6] Specifically, religious private school students are 16 percentage points less likely to spend the majority of class time on school-issued devices compared to traditional public school students (48% versus 64%, p=0.011) and the difference is 11 percentage points for charter school students (53% versus 64%, p=0.056).
About this Study
This report was made possible through external philanthropic support, as well as from our sister organization, the Thomas B. Fordham Foundation.
We are grateful to author Brian Fitzpatrick, Fordham’s National Research Manager, for his thoughtful work and commitment to the project. External adviser Michael Horn provided helpful feedback on the draft report. Here at Fordham, we thank David Griffith, Chester E. Finn, Jr., Michael J. Petrilli, and Amber M. Northern for providing feedback on the draft; Stephanie Distler for managing report production and design; and Victoria McDougald for overseeing media dissemination. The views expressed are those of the authors alone and do not necessarily reflect those of the foundations that supported this work. The Thomas B. Fordham Institute retains sole discretion over the content of this report.