Earlier this summer, Ohio policymakers unveiled a revamped industry credentials framework that—if implemented well—will encourage students to attain credentials of value.
Earlier this summer, Ohio policymakers unveiled a revamped industry credentials framework that—if implemented well—will encourage students to attain credentials of value. The new system was created in response to data indicating that schools were pushing students to rack up questionable credentials as a workaround to the standard graduation requirement of passing state math and English exams. This was a blatant abuse of the state’s alternative pathway, and it robbed students of both essential academic skills and the rigorous technical training needed for living-wage professions.
We at the Fordham Institute supported the much-needed overhaul. It introduces an objective method to value industry credentials based on third-party data about employer demand and wages associated with the credential. Informed by the valuation results, a committee responsible[1] for approving graduation-eligible credentials culled the approved list from a whopping 738 to 126 credentials. The credentials making the cut are linked to good-paying jobs in manufacturing, construction, healthcare, information technology, and transportation.
The revamp’s long-term success, however, hinges on holding the line on quality. As we warned in an earlier piece, this work could quickly unravel if the committee falls prey to political pressure and low standards:
The list of credentials could balloon yet again if policymakers are not careful. … Vendors and industry groups with financial interests and schools looking to maintain sky-high graduation rates could urge the committee to approve their favored credential or pressure it to set a low bar.
Regrettably, this caution is proving prophetic. At the committee’s first post-overhaul meeting in September, it approved two eyebrow-raising “bundles” of retail-based certificates that open the floodgates to another round of gaming and abuse. Here’s what the committee did and why its actions raise such serious alarms.
As quick context, the original September meeting agenda made no mention that any credentials would be up for approval. In fact, in its meeting notice, the Ohio Department of Education and Workforce emphasized that the committee “will not be evaluating new credential applications.” Rather, the meeting was supposed to focus on standards setting—e.g., establishing minimum point values that allow a credential to be considered for approval—which was an unsettled policy question going into the meeting (draft rules are here).
But when the committee convened—according to the meeting minutes—it immediately shifted gears and handed the mic to a DC-based representative of the National Retail Federation, which creates and sells the RISE UP credentials (more on them later). He gave a presentation and, without question or discussion, the committee approved the credentials for graduation.
This political power play calls into question whether Ohio can maintain control over its credentials list. If the retail federation can get its credentials accepted through lobbying, why not others? And if interest-group politics ends up being how the list is developed, what does that mean for the state’s impressive data-driven valuation framework? Does it become irrelevant?
Perhaps the procedural mess could be forgiven if the retail certificates include rigorous training and yield significant economic benefits for students. But a closer look at these credentials casts doubt on both counts. Note also that schools have already used one of them (Customer Service) as a common workaround to graduation under the prior credential system.[2]
Table 1 displays the first of the two retail bundles approved by the committee. It consists of three credentials that, taken together, likely require around 35 to 40 hours online to complete—less than half of a standard year-long academic or technical course that amounts to roughly 110 hours.[3] There are also certification exams, but unlike state exams—where there is extensivereporting andtechnicaldocumentation—almost nothing is known about their content and rigor, test security, or passing rates. One might argue that certificates should not be judged against the standards of typical academic courses or state assessments. But remember, this bundle can substitute for high school math and English competency demonstrated on a state exam for graduation purposes.
As for economic outcomes, Ohio students who have earned the RISE UP certificates have median incomes three years after high school of roughly $25,000. That is barely above the annual income of a full-time worker in a minimum wage job ($23,000) and far below a living wage standard of $44,000 for a single adult. The composite scores from the state’s valuation framework for the retail credentials are also substantially below the average credential in the state’s valuation database (44.7). The Google Analytics certificate gives the bundle a slight boost, but even it yields relatively little in terms of wage potential.
Table 1. Summary of the first bundle recently approved by the credentials committee
The other credential bundle approved by the committee does not look much better. The programs in the bundle likely require no more than 40 hours of online coursework. The median income of an Ohio student with the RISE UP credential is below $25,000, and the credential has a weak composite valuation score. The Forklift Operation certificate bolsters the bundle, yet it still consists of just six online modules and an online exam.[4] Finally, the OSHA-10 certificate is added to the mix, but it is a basic job safety certificate that—while necessary for some jobs—does not signal the acquisition of specific technical skills.
Table 2. Summary of the second bundle recently approved by the credentials committee
Online exam with unlimited retakes (no sample questions found); passing score of 80%.
$35,684
68.5 to 75.1
OSHA – 10 Hour Training
Online, 10 hours
Online exam; passing score of 70%.
$33,088
58.5 to 73.5
* * *
The industry credentials committee plays a key role in maintaining the integrity of Ohio’s graduation standards. While it did fine work this summer in the overhaul, the committee slipped at the September meeting. Moving forward, members must keep the best interests of the students using the credential route to graduation at the forefront. Their long-term futures will be brighter if they earn rigorous credentials with enduring value (such as those tied to the skilled trades) than collecting certificates that—on their own—yield little economic benefit.
To be clear, credentials, including retail-oriented ones, are not inherently bad. If the state required students to pair credentials with academic competency, aligned technical coursework, and on-the-job experience, the committee could likely take a more expansive approach to approval. But that’s not the policy framework (established in statute) the committee is working within. Credentials can be used in isolation to meet graduation standards—and thus may be the principal “currency” that students take with them to pursue jobs after high school. As such, the committee must take a firmer stance on credential quality.
The committee can still reverse the September mistake. It should immediately rescind these bundles, and work instead to adopt high standards for credential approval. Once established, all potential credentials and bundles should go through the same rigorous and fair approval process.
[1] The director of the Ohio Department of Education and Workforce appoints the committee members. The current committee includes nine members, seven of whom are representatives of business groups as well as representatives from JobsOhio and the Governor’s Office of Workforce Transformation.
[2] In recent years, schools have paired the RISE UP Customer Service and Sales and RISE UP Retail Industry Fundamentals to push students to graduation. In the class of 2025, they were the second and fourth most-earned credentials statewide, with CPR First Aid and the OSHA-10 certificates rounding out the top four.
[3] 40-minute class period x 165 school days = 110 hours.
[4] The forklift certificate is currently the 14th most-earned credential in Ohio. The complete forklift certification process does require hands-on training. However, it’s unclear whether students must complete the hands-on training to be counted for the credential (by federal law, one cannot operate a forklift until they turn eighteen), or whether they are counted after passing the online exam, which generates a certificate.
Each year, the Ohio Department of Higher Education (ODHE) collects and publishes data from Ohio’s teacher preparation programs in accordance with state law. These Educator Performance Reports are available for the state and individual higher education institutions (both public and private). Current metrics include licensure test pass rates, value-added data, information on field and clinical experiences (like the number of weeks teacher candidates spend student teaching), and results from the Ohio Teacher Evaluation System (OTES).[1]
In Ohio, these reports are currently the only objective resource that annually measures the outcomes of teacher preparation programs.[2] They are not an accountability measure—there are no consequences or rewards directly tied to the results. But they are an important transparency feature, as they give policymakers, prospective teachers, district and school administrators, and the public a closer look at how well Ohio’s preparation programs are training future educators.
Given that teachers matter more to student achievement than any other schooling element, such transparency is crucial. But the usefulness of these reports has been blunted by their formatting, which isn’t very user-friendly. Consider the 2024 institution profile for The Ohio State University, Ohio’s largest higher education institution. The report contains plenty of important information. But if you’re a prospective teacher trying to decide between Ohio State and other schools, or a district administrator searching for where to find the best new teachers, rifling through dozens of pages of data and trying to identify comparison points is both difficult and time-consuming.
Fortunately, all that changed this year when ODHE revamped its reports. Now, all the primary metrics fit on a single page—a much more user-friendly format that will allow a broad range of stakeholders to easily access data and make simple, quick comparisons. Given Ohio’s statewide early literacy initiative, it’s especially noteworthy that the revamped reports clearly identify first-time pass rates and test takers’ highest score pass rates on the state’s Foundations of Reading exam. That’s useful information for district and school leaders who might be considering which preparation programs to collaborate with for teacher training opportunities, student teaching partnerships, and other initiatives.
If you’re someone who prefers in-depth analysis and charts over glossy one-pagers, never fear: ODHE offers links to both the brand-new resource and a historical version. It also provides detailed reports on the value-added progress dimension and OTES results. For most folks, though, the newly published one-pagers are a clear upgrade.
Prospective teachers, in particular, should benefit. Let’s say Jane is an aspiring teacher who believes in the value of hands-on learning and wants to get as much experience in the classroom as possible before she graduates. Jane lives in northeast Ohio and is deciding between Kent State University and the University of Akron. A quick glance at each institution’s most recent report tells her that at Kent State, teacher candidates clocked 620 field hours prior to student teaching and spent an average of 15 weeks in their student teaching placement. At Akron, meanwhile, students spent just 160 hours in the field prior to student teaching and just 12 weeks in their student teaching placement. For Jane, the choice is clear: If she wants lots of clinical hours, Kent State is the best fit.
Meanwhile, in southwest Ohio, James and his parents are trying to decide between three institutions: Miami University, the University of Cincinnati, and Wilmington College. James prefers smaller class sizes, while his parents prefer minimal student loan debt. ODHE’s reports offer data on both in the form of annual enrollment numbers for preparation programs and in-state tuition rates. Although Wilmington College will likely have the smallest class sizes (its teacher preparation programs have an annual enrollment of just 73), it also has the highest in-state tuition (more than $32,000)[3]. For James and his parents, the University of Cincinnati is a solid compromise—its annual enrollment is much smaller than that of Miami University, and Cincinnati boasts the lowest in-state tuition of all three options.
State officials deserve credit for taking the initiative to update these resources. Now that the hard part is done, there’s some room to tweak the reports and make them even more useful. In the spirit of continuous improvement, here are three additional data points ODHE should consider adding:
Job placement rates. Identifying the percentage of graduates from each institution who find a teaching job within one year could signal whether a program produces teacher candidates whom schools are eager to hire and could help aspiring teachers decide where to enroll based on job prospects.
First-time pass rates for licensure exams. ODHE’s reports identify overall pass rates on licensure exams. But there’s a difference between overall and first-time pass rates. Overall pass rates include candidates who pass the exam, regardless of how many attempts it takes them to do so. First-time pass rates, on the other hand, show the percentage who pass the test on their first try. Teacher candidates who need more than one attempt to pass state licensure tests can still go on to be excellent teachers. But first-time pass rates are an important marker of how rigorously preparation programs are training aspiring educators. They should be included on the state’s performance reports.
Retention numbers. Identifying the percentage of graduates from each institution who are still working in Ohio schools within five, ten, and 20 years could help pinpoint programs that do a particularly good job of preparing their students for the demands of teaching, as their graduates are more likely to remain in the classroom long term.
ODHE’s revamped reports are a big win for aspiring teachers, school leaders, and state policymakers. They are also an important complement to a forthcoming (fall 2027) report from the Department of Education and Workforce that will analyze statewide teacher supply and demand. Collectively, these resources should give policymakers a much clearer view of Ohio’s teacher pipeline—and how best to strengthen and expand it.
[2] Teacher preparation programs are audited for their alignment to the science of reading, but those audits are limited in scope.
[3] While in-state tuition rates provide a ballpark cost comparison, a fuller analysis would require considering the financial aid offers from each institution.
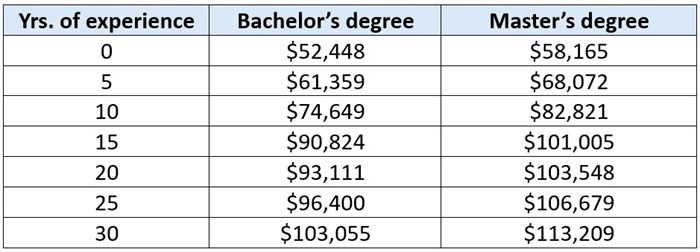
How are Ohio’s public school teachers paid? Not how much. But on what basis are their salaries determined? For decades, the answer has been seniority and degrees earned. Following requirements in state law, school districts simply plop teachers into a “step-and-lane” salary schedule to determine their pay for the year. The table below displays a simplified example based on Columbus City Schools’ salary schedule.
Table 1. Illustration of a step-and-lane salary schedule
Note: For display purposes, only selected “steps”—years of experience—are shown and several education “lanes” are omitted (e.g., bachelor’s with 150 credits).
This rigid pay model has many perverse incentives. It pushes younger teachers out of the profession, as they are locked into lower salaries no matter what they do. Because there is no pay differentiation based on school assignment, talented teachers have no incentive to teach at high-poverty schools, which leaves many of our neediest students with the least effective instructors. Schools are prone to losing teachers with high-demand skills, such as math and science or career-technical educators, because they can use their talents to earn more elsewhere. It discourages teachers from putting in extra effort, as there is no monetary reward for sharpening their practice or going above and beyond for students.
A pay model based on seniority and degrees earned also defies the evidence. Research indicates that teachers’ effectiveness plateaus after about a decade of experience, so there’s no reason to automatically pay a 30-year teacher more than a 20-year educator, as Columbus and others do. As for graduate coursework, this system heavily incentivizes teachers to spend time and money chasing master’s degrees that research indicates have negligible impacts on effectiveness.
A recent report from the National Council on Teacher Quality (NCTQ) reaffirms the absurdity of Ohio’s teacher pay system. In this study, the NCTQ analysts examine whether states implement pay structures that provide teachers with additional salary based on effectiveness, working in a hard-to-staff school, or being certified in a hard-to-staff content area. It also looks at whether states mandate pay increases based on a master’s degree, which NCTQ rightly considers bad policy.
The upshot: Ohio is one of just six states that received an embarrassing zero on the NCTQ teacher pay analysis.[1] The Buckeye State can’t claim to have any policy or initiative on the books that promotes strategic compensation for teachers. That’s a policy failure, folks.
Helpfully, NCTQ features several states moving toward more sensible approaches to teacher pay. A couple worth highlighting include:
Texas. In 2019, lawmakerscreated theTeacher Incentive Allotment (TIA), which increases teachers’ compensation based on their classroom performance and their schools’ demographics. Participation is voluntary, but about 80 percent of Texas districts opt in. Studies of TIA’s early impacts find increased teacher retention as well as improved student achievement. As also detailed by NCTQ, Utah has already replicated a teacher merit-pay program based on the impressive Texas model.
North Carolina. In 2013, lawmakers repealed automatic pay increases for master’s degrees. The legislation “grandfathered” teachers holding master’s degrees or pursuing the degree at that time, but moving forward, the state no longer awards automatic raises based on the degree.[2] Instead of subsidizing and incentivizing graduate coursework, North Carolina has invested in an Advanced Teaching Roles program that provides salary increases to effective teachers who take on instructional leadership roles or teach larger classes.
Ohio should take a page from the playbooks of Texas and North Carolina. A merit-pay program, which also includes heftier bonuses for teachers in high-need schools, would both reward instructional excellence and advance educational equity. Repealing the state mandate for districts to pay master’s degree supplements would free money to boost salaries for other purposes such as retaining promising junior teachers, compensating teacher-leaders, or recruiting advanced math and science instructors.
Lockstep salary schedules treat teachers like widgets rather than professionals who deserve to be rewarded for their productivity, talents, specialization, and willingness to work with the neediest students. They also hardwire complacency into public schools—teachers receive predetermined salaries no matter what—which does nothing to advance student learning. The clock is ticking for another generation of Ohio students who need an excellent education to succeed after high school. It’s time for Ohio policymakers to overhaul teacher pay.
[1] The other states receiving goose eggs are Illinois, Kentucky, Rhode Island, South Carolina, and Tennessee.
[2]North Carolina, unlike Ohio, does not permit collective bargaining between local unions and districts, so teacher pay is largely dictated by a statewide salary schedule (rather than a locally negotiated schedule).
In Ohio, where policymakers and educators are working to boost student outcomes, ensuring that kids show up to school is critical. Students who have never been chronically absent[1] are six times more likely to read on grade level by the end of third grade and nine times more likely to graduate from high school on time. Being chronically absent, meanwhile, can negatively impact both academic and social-emotional development.
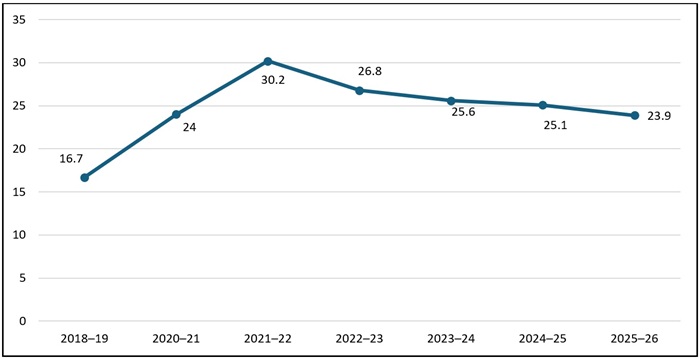
During the height of the pandemic, Ohio’s statewide chronic absenteeism rate skyrocketed to 30 percent. It has yet to return to pre-pandemic levels. Figure 1, which displays the statewide chronic absenteeism rate over time, shows that the biggest drop since the pandemic was just over 3 percentage points in 2022–23. Since then, Ohio has been stuck in the mud. Each year, the statewide rate ticks downward by roughly 1 percentage point. If progress doesn’t accelerate, Ohio won’t return to its pre-pandemic rate until 2033. That’s 11 years after the initial spike and nearly the entire length of a student’s K–12 career.
*2019–20 has been excluded due to pandemic-related disruptions that impacted the data.
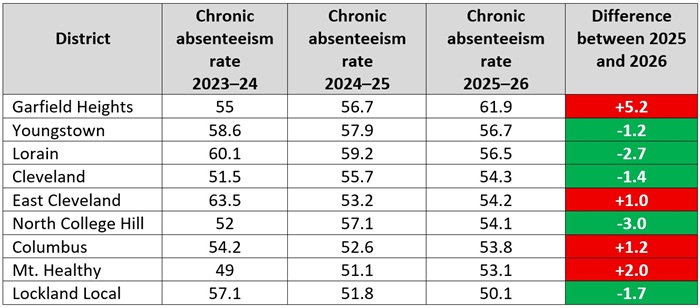
It’s deeply concerning that almost a fourth of Ohio students were chronically absent during the 2025–26 school year. But it’s especially worrisome that in some districts, absenteeism rates are even higher. Table 1 identifies nine locales that registered rates above 50 percent during the 2025–26 school year. These same districts also had rates above 50 percent during the two previous school years (with the exception of Mt. Healthy, which had a rate of 49 percent in 2023–24). That’s three straight years of more than half of the student population missing at least 10 percent of instructional time. Moreover, four of them actually got worse in 2025–26: Garfield Heights, East Cleveland, Columbus, and Mt. Healthy.
Table 1. Districts with chronic absenteeism rates above 50 percent in 2025–26
To their credit, state leaders have attempted to address Ohio’s sky-high numbers. In 2024, the Department of Education and Workforce (DEW) published the Ohio Attendance Guide, which outlined district and school practices for early intervention. That same year, Ohio joined more than a dozen other states in pledging to cut chronic absenteeism by half. In 2025, policymakers revamped state law and required districts to update their absence policies accordingly. And earlier this year, DEW launched a new statewide attendance dashboard that helps local leaders and the public track attendance trends and chronic absenteeism rates by district, school building, and grade level.
It will take some time to determine if the more recent efforts have an impact. (The 2026–27 school year is the first full year of implementation for both the revamped law and the dashboard). In the meantime, lawmakers might be tempted to put chronic absenteeism on the back burner. But that would be a mistake. Although attendance is largely a local issue, state policymakers play a critical role in creating an environment where schools can successfully boost attendance. With that in mind, here are three proposals lawmakers should implement as soon as possible.
1. Beef up accountability for attendance.
State report cards currently include chronic absenteeism as one of several indicators on the Gap Closing component. There are two ways schools receive credit for this indicator: meeting the statewide target rate, or reducing their chronic absenteeism rate from the previous year. Although it makes sense to give schools credit for reducing their rates, the current bar for reduction is far too low. Districts with rates above 36 percent—more than one-third of their students are chronically absent—need only reduce their rate by just 1.1 percentage points. Under this standard, several of the districts identified in Table 1 received full credit from the state for “closing the gap” on absenteeism even though they posted rates above 50 percent for a third consecutive year. To improve Ohio’s attendance numbers, DEW should increase the required absenteeism reduction rate to 5 percentage points for a school or district to receive credit on the state report card.
2. Meet families where they are.
In 2024, researchers at Brookings found that less than half of caretakers with a child at risk of being chronically absent reported being concerned about it. Remember, research is clear that chronic absenteeism can negatively impact both academic and social-emotional development. If families aren’t worried about absenteeism, it’s likely because they don’t realize why they should be.
One way to get that message across is to go out into the community and meet families where they are. In the spring of 2021, state leaders in Connecticut launched a home-visit initiative called the Learner Engagement and Attendance Program. As part of the program, 15 high-need districts were provided with funding to pay for school staff and community organizers to visit nearly 8,700 chronically absent students in their homes. A mixed-methods evaluation conducted by the Center for Connecticut Education Research Collaboration indicates that the program had a meaningful impact.
Connecticut’s initial investment cost roughly $10 million.[2] Ohio could mirror this try-it-and-see approach by establishing a pilot project for a small number of districts. Asking interested districts to apply would ensure local buy-in. And using the state’s attendance dashboard to closely track absenteeism rates among all applicants—districts that were accepted into the pilot, as well as those who applied but didn’t receive funding—would allow for a genuine evaluation of the program’s effectiveness.
3. Help schools do the heavy lifting.
Another innovative way state leaders could combat chronic absenteeism is by investing in attendance coaches. As with the home-visit initiative, state leaders could establish a pilot program that invites interested districts to apply for a state-funded attendance coach to work in their district. Coaches could collaborate with administrators to analyze real-time data provided by the state’s dashboard, evaluate current prevention and intervention efforts, identify ways to improve, and train staff on effective implementation. They could support teachers by managing communication with the families of chronically absent students. And they could support students by building relationships with those who are frequently absent and working alongside them and their families to dismantle barriers to attendance. As part of its early literacy initiative, Ohio has sent more than 100 literacy coaches into schools to support science of reading implementation. Why not try something similar to boost attendance?
***
It’s disheartening that Ohio has made so little progress on chronic absenteeism in recent years. But now isn’t the time to bury our heads in the sand and accept the much higher post-Covid absenteeism rates as the new normal. There are practical and innovative solutions available that could bolster efforts that are already underway. Now is the time for policymakers to act—Ohio kids and families deserve it.
[2] Initially, Connecticut designated just over $10 million in federal Covid-relief funding to support these 15 districts. State lawmakers went on to appropriate additional funds—$7 million in 2022 and another $7 million in 2023—to sustain operations through December 2026.
While four-year college degrees are largely viewed as a direct path into career-ladder jobs (AI fears notwithstanding), two-year degrees and shorter-term certificates are seen as less of a sure thing. A new report from Georgetown University’s Center on Education and the Workforce provides a better picture of the jobs that associate degree and certificate earners can access and what their career trajectories look like—essential information to help improve our understanding of non-bachelor’s pathways.
First up, some definitions: Jobs requiring a postsecondary certificate or an associate degree are here termed “middle-skills occupations.” Categories include installation and maintenance of equipment, office and administrative support, computer science, transportation and logistics, and so on. There are hundreds of such occupations across the categories. The Georgetown researchers use a combination of national and metro-area-level data from the U.S. Bureau of Labor Statisticsand the U.S. Census Bureau from 2018 through 2023 to estimate wages for workers across the 55 largest metro areas in the country. They identify what they term “springboard occupations”: 159 middle-skills jobs in 22 occupational categories that offer workers above-median earnings at the start of their careers (based on local data) and strong wage growth over time—ensuring that inflation won’t erode their economic security. They use those springboard occupations—some of which provide earnings comparable to some bachelor’s degree-specific jobs—as the basis for their analysis.
The researchers find that just 15 percent of early-to-mid-career middle-skills workers in the largest metro areas are employed in a springboard occupation. The rest are in lower-paid and low-salary-growth fields. Why so few springboarders? Largely because no metro area has jobs in even a majority of the springboard fields available. The highest percentage of springboard occupations in any area is 47 percent; the lowest is just 28 percent. The most common such jobs are electrician, firefighter, general and operations manager, and police officer, but each metro area has a unique combination of springboard jobs. Los Angeles, for example, has the largest number of discrete springboard occupations, while St. Louis has the largest share of middle-skills workers currently employed in springboard occupations. Overall, early-career workers in middle-skills springboard occupations (ages 20–24) have median annualized earnings of $42,500, an amount that increases by 59 percent to $67,500 by mid-career (ages 35–44). By contrast, median annualized earnings for workers in non-springboard middle-skills occupations are $35,600 in early career and just $47,000 in mid-career.
Adding to the low percentage of springboarders is a mismatch between credentials earned and jobs available. The researchers compute a ratio of each metro area’s annual number of middle-skills credential earners (those that align with springboard occupations) to the projected annual number of job openings available in all occupations (both springboard and non-springboard occupations). Their findings indicate a shortage of properly credentialed workers for springboard occupations in each of the 55 metro areas through at least 2034, although the exact nature of the shortages varies from place to place. Indianapolis, for example, overproduces associate degree and credential earners overall, but still faces shortages of properly credentialed workers in six different occupational categories, including architecture, computer science, and business operations. Nashville’s production of properly credentialed workers, on the other hand, is expected to meet a mere 9 percent of the projected annual springboard job openings. The biggest shortages are projected to occur in the construction and extraction; installation, maintenance, and repair; and production occupational groups. Similar shortages can be found in nearly all 55 metro areas.
Taken together, these findings indicate millions of good-paying, high-wage-growth jobs becoming available all across the country for workers with less than a four-year degree. But without changes, knowledge of those jobs and individuals’ access to them will continue to lag availability. The report’s recommendations start in middle school, with an expansion of career and technical education (CTE) programs that introduce students to career pathways requiring less than a four-year college degree. They also recommend partnerships among employers, high schools, and postsecondary institutions to better define—and publicize—the steps needed to earn credentials and to move directly from high school graduation to postsecondary certification to employment. Better alignment between workforce needs and credential programs being offered in a given metro area will also help direct students to credentials in high demand in their area. There’s nothing wrong with earning a credential that is in demand in some other city, but students should be aware of that before they start on a pathway. Data such as those collected in this report will be vital to students, educational institutions, and employers going forward.
Public charter schools are one of the most enduring—and successful—educational innovations over the past three decades. Freed from suffocating union contracts and distracting school board politics, charter schools can create distinctive programs, assemble teams of mission-aligned educators, and maintain a clear focus on student needs. Today, approximately 4 million U.S. students attend the nation’s 8,000-plus charter schools; in Ohio, roughly 120,000 students attend the state’s 340 charters.
In exchange for these freedoms, charters are expected to deliver stronger academic outcomes. When they fall short, accountability mechanisms come into play, measures rarely found in the traditional district sector. These include corrective actions required by state officials or their sponsor (a.k.a., “authorizer,” the entity that allows a charter school to operate), immediate funding reductions when dissatisfied parents disenroll their children, and permanent closure by their sponsor or directly by state action if they chronically underperform.
The autonomy-in-return-for-accountability model has effectively served millions of American youngsters. According to the most recent national study by Stanford University’s Center for Research on Education Outcomes, the average charter student makes greater academic progress each year than a similar student attending a district school.[1] In Boston, researchers estimate that its finest charters close the yawning black-white achievement gap by one-fifth to one-third each year. New York City’s famed Success Academy charter schools consistently register near-perfect proficiency rates on state exams.[2] Ohio also has success stories, including well-regarded charters such as Dayton Early College Academy, KIPP Columbus, and the United Schools (all proudly sponsored by our sister organization, the Thomas B. Fordham Foundation).
Other charter schools, however, have struggled and many have closed due to accountability pressures and often-related fiscal challenges. In the early days of Ohio’s charter movement, too many schools were hastily launched, and others suffered from weak accountability and severe underfunding. Urged by choice-friendly and quality-centered advocates, including the Fordham Institute, Ohio has undertaken a decade-long turnaround effort via two main policy levers—both aimed at driving higher student achievement, an outcome the present report evaluates.[3]
Stronger state oversight of charter sponsors. Ohio has long permitted various entities—e.g., local districts, educational service centers, and qualified nonprofits—to sponsor charter schools. A multi-sponsor system promotes competition and innovation, but without rigorous state oversight, it also allowed the growth of weak sponsors and lax accountability in Ohio’s charter sector. Enacted in 2015, House Bill 2 strengthened the state’s fledgling effort to hold sponsors more accountable for the performance of their schools. The legislation established consequences—including revocation—when sponsors turn a blind eye to quality. This tougher oversight had an immediate impact, with the number of sponsors falling from 66 in 2013 to just 19 by 2022 (18 are active today). The system also encouraged sponsors to shutter low-performing schools. Between 2016 and 2022, just over 100 Ohio charter schools closed (out of nearly 400 at baseline), largely done through sponsor action.
More equitable funding for high-performing charter schools. Charter schools in Ohio, as in most states, have long operated with far less funding per student than their district counterparts, making it far harder to maintain high-performing schools. With the accountability framework solidified, state leaders tackled this major challenge confronting the charter sector. First enacted through the biennial budget for fiscal 2020 and 2021, the Quality Community School Support Fund (QCSSF)[4] has provided much-needed supplemental aid to qualifying schools, ranging from approximately $1,000 to $3,000 per pupil, depending on year (see below for program details). The extra dollars have been a game-changer, narrowing the per-pupil funding gap between these high performers and their local district from an approximately 30 percent shortfall to 10 percent.[5] In 2025–26, 116 of Ohio’s 348 charters qualified for the program.
As noted above, the goal of these reforms is to deliver better learning outcomes for students. Conducted by Dr. Stéphane Lavertu, an Ohio State University professor and Fordham Institute research fellow, this study offers hard evidence that they have indeed moved the achievement needle. Two findings stand out.
First, the overall performance of Ohio charter schools—the brick-and-mortar variety—has markedly improved. In 2007, the average charter student was losing ground in math and reading compared to a similar student attending a district school. The reverse is true today. In 2025, the average brick-and-mortar charter student gained the equivalent of 25 to 35 additional days of learning in both math and reading versus her district-attending counterpart. While the quality of individual charter schools still varies, the average Ohio charter today provides a superior education compared to students’ typical district alternative.
Second, providing more equitable funding has bolstered achievement in the state’s high-quality charters. Consistent with an earlier report examining the program’s first four years,[6] this study continues to uncover positive impacts of the additional funds into fiscal 2024 and 2025. To better isolate the impact of the program funds, this analysis compares narrowly qualifying to nonqualifying charters, rather than charter to district students. When doing this, we find that the extra dollars received by charter schools are associated with student gains worth about 50 to 60 days of additional learning.
Thanks to a decade of reform led by policymakers keen to ensure that charter schools serve students well, Ohio’s charter pupils are reaping the benefits of a more responsible, more accountable, better-funded, and higher-performing charter sector. Although charter students make more progress than they would attending district schools, most charter students (largely from low-income families) still score below the statewide average: For instance, 45 percent of third-grade charter students achieved reading proficiency in 2024–25 versus 61 percent statewide. Given this still wide achievement gap, the work of helping every charter student reach their full potential remains unfinished.
What to do? On the policy side, state lawmakers must continue to insist on strong accountability measures even in the face of demands—sometimes, unfortunately, from the charter sector itself—to water them down. Lawmakers still have their work cut out to ensure that all charter students receive the benefits of fair and equitable funding—not just those fortunate enough to attend schools qualifying for the extra dollars. As we at the Fordham Institute have long contended, charter school students shouldn’t get shortchanged simply because of their choice in public school. Lastly, state leaders should continue to protect the autonomy of charter schools, while balancing such independence with expectations to implement high-quality curricula, achieve student attendance targets, and hire top-notch teachers knowledgeable in their content area.
State lawmakers, including the next governor, should build on Ohio’s legacy of school choice and local autonomy as well as its more recent moves toward charter accountability and equitable funding. A renewed push for excellent charter schools will further empower families and put a next generation of charter students on pathways to success.
Executive Summary
Charter schools (labeled “community schools” in Ohio law) are publicly funded but independently operated schools that serve students from kindergarten through grade 12. Since their authorization in 1997, Ohio policymakers have promoted charters as a way to expand educational opportunities for families—particularly those residing in underperforming school districts—while creating competition that incentivizes all schools to better meet students’ needs. But charters are not necessarily good schools, and lawmakers have enacted a series of reforms aimed at improving their quality by holding them accountable for results and increasing their funding.
This report examines the trajectory of Ohio’s charter school sector between 2007 and 2025 and considers the role that accountability and funding policies have played in shaping that trajectory. Using student-level administrative data and school-level spending information, the analysis compares the academic outcomes of charter students with those of similar students attending nearby district-operated schools. It also examines how recent funding initiatives—particularly the Quality Community School Support Fund (QCSSF)—have affected charter operations and student outcomes. To enable apples-to-apples comparisons, this analysis focuses on brick-and-mortar charter schools that serve a general student population, setting aside online “virtual” schools and those that focus on dropout prevention and recovery.[7]
The analysis indicates that Ohio’s charter sector has improved substantially. The average annual achievement gains of charter students initially lagged the gains of similar students in nearby district schools, but the average charter now produces substantially larger achievement gains. Recent funding reforms also appear to have strengthened the performance of the charter sector’s most effective schools. Here are the key findings:
Ohio charter schools now produce substantially larger academic gains than nearby district schools.
During the 2006–07 school year, the average charter student had annual achievement gains that were 0.05 standard deviations lower than those of similar district students. By the 2024–25 school year, the annual gains of the average charter student exceeded those of similar district students by approximately 0.06 standard deviations. This advantage equates to roughly 25–35 additional days of learning per school year—and the gains compound for students who attend charter schools for multiple years. Quality varies, however. During the 2024–25 school year, 26 percent of charters posted average achievement gains in English that were statistically significantly lower than those of nearby district-run schools, and 40 percent of charters posted lower average gains in math.
Accountability reforms likely contributed to the sector’s improvement.
Ohio’s automatic charter school closure law—enacted in 2006—requires persistently low-performing charter schools to shut down, removing schools with weak academic results from the sector. Additional reforms enacted in 2015 strengthened oversight of charter school sponsors and operators. Together, these policies toughened the consequences for poor performance and appear to have contributed significantly to the steady improvement in charter school outcomes over time. For example, during the 2023–24 school year, 96 of the 226 charter schools for which gains could be calculated demonstrated statistically significantly lower gains than nearby district schools in at least one subject—and 10 of these schools were no longer in operation during the 2024–25 school year. On the other hand, 130 of these 226 charters posted higher annual achievement gains than nearby district schools in at least one subject, and all were still in operation the following year.
Charter schools continue to operate with fewer resources than nearby district schools.
Charter schools generally spend far less per pupil than district schools serving students from the same communities, as they receive less public funding. Recent policy changes have narrowed this gap by directing additional funding to higher-performing charter schools via the Quality Community School Support Fund (QCSSF). Nevertheless, the average charter school still spends approximately $4,000 less per pupil than the district schools where they are located, and the average school receiving QCSSF funding spends approximately $2,500 less per pupil.
Charter schools bringing in additional revenue from the Quality Community School Support Fund produce exceptionally strong academic outcomes.
After one or two years in a QCSSF-funded school, students experience large test-score gains of approximately 0.3 standard deviations in math and 0.2 standard deviations in English, roughly equivalent to their getting an extra 100–130 days of instruction relative to their charter-school peers who did not attend a QCSSF school. These schools also employ teachers with higher salaries and lower turnover and absenteeism, and their students exhibit lower rates of chronic absenteeism. The above results do not speak to the effectiveness of providing QCSSF charters with more funding, however, since Ohio selects QCSSF schools because they are highly performing.
Additional funding accounts for a substantial share of these improvements.
To isolate the impact of additional funding from the impact of selection based on quality, the analysis compares charters that narrowly qualified for QCSSF funding with those that narrowly failed to do so. In other words, it compares schools of similar quality that did and did not receive the additional QCSSF funding. The results suggest that roughly half of the achievement advantage associated with QCSSF schools is attributable to the additional funding, whereas the reductions in chronic absenteeism are primarily driven by the additional resources. Finally, the results indicate that QCSSF funding led to higher teacher salaries, lower teacher turnover, and lower teacher absence rates, providing clues on how funding might translate to improved outcomes.
The average academic gains in Ohio’s brick-and-mortar charter schools are large relative to those typically observed in education policy research. Average student performance masks considerable variation, however, as approximately 40 percent of charters post significantly lower annual gains in at least one subject than nearby district schools. Moreover, charters disproportionately serve economically disadvantaged urban students with academic achievement and attendance rates well below Ohio averages. The charter school advantages documented in this report are not sufficient to overcome the substantial academic headwinds these students face.
Nevertheless, the annual academic gains of the average charter school student are comparable to those produced by some of the most effective—and often far more costly—educational interventions. The policy implications are straightforward. Accountability policies appear to play an important role in sustaining quality in the charter sector as a whole, and targeted investments in effective schools can amplify the impact of these high performers. Together, these policies should enable Ohio’s charter sector to continue expanding high-quality educational opportunities for students, particularly those in communities where strong public-school options are limited.
Background
A. Brick-and-Mortar Charter Schools
Ohio law authorized the establishment of charter schools in 1997 to provide additional public schooling options to families trapped in poorly performing school districts. These charter schools (called “community schools” in state law) are tuition-free, open to all Ohio students, and independent of school districts. This independence provides charters some freedom to innovate but, in exchange, they are held accountable for outcomes. School authorizers (or “sponsors”) and state law hold charters formally accountable for their performance. And, because public funding follows students, charters must satisfy the demands of parents to remain financially viable. By expanding educational options for parents, lawmakers created incentives for all public schools—both charter and district—to meet the educational needs of children.[8]
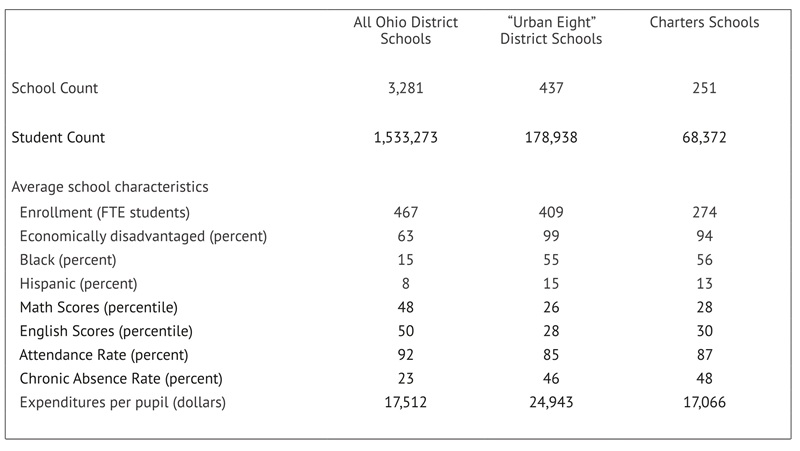
During the 2024–25 school year there were 340 charter schools serving 119,310 Ohio students in grades K–12, approximately 6.3 percent of Ohio’s school-age children and 7.3 percent of its public-school students.[9] This analysis focuses on the 251 site-based, brick-and-mortar charter schools (excluding schools focused on dropout prevention and recovery as well as “virtual” schools) as these schools are most comparable to traditional district schools and were those eligible for the QCSSF program that is the focus of this report.[10] Consistent with policymakers’ intent to provide options to families trapped in struggling districts, Ohio’s charter schools serve primarily low-income and low-achieving students who reside in densely populated urban school districts. As Table 1 indicates, during the 2024–25 school year, the average charter school had 274 students who were predominantly economically disadvantaged (94 percent), Black or Hispanic (69 percent), scored well below average on state tests (between the 28th and 30th percentiles), and struggled with attendance (48 percent missed 10 percent or more of instructional hours).
Table 1 provides a high-level comparison of charter and district schools statewide during the 2024–25 school year. However, because charter schools serve primarily economically disadvantaged children in urban areas, as well as a mix of students who reside outside of Ohio’s largest urban districts (the “Urban Eight”), the birds-eye view in Table 1 does not properly portray the relative funding and performance of charter and district schools. The subsections below provide a more nuanced account of how charters have performed over time and some factors that likely influenced their trajectory.
Table 1. Characteristics of charter schools that are the focus of this study in 2024–25
Note. The table presents descriptive statistics for brick-and-mortar charter schools that are the focus of this report and, to provide a benchmark for comparison, traditional district schools and “urban eight” district schools (Akron, Canton, Cincinnati, Cleveland, Columbus, Dayton, Toledo, and Youngstown). Calculations are based on student-level data for students in grades K–12 and, thus, may not match official statistics exactly. Note that the averages characterize the average school as opposed to the average student in each sector, which would require weighting the statistics by school enrollment.
B. Charter School Performance, 2007–2025
Assessing whether charter schools provide parents with quality educational options, relative to other public schools serving children in their area, requires a statistical methodology that adjusts for the differences in students across sectors. Researchers have converged on a statistical method that does so reliably: schools’ test-score value-added. It captures how much higher or lower student achievement is than one would have anticipated given students’ achievement trajectories in prior school years.[11] In other words, this method assesses the “gains” that schools provide relative to other schools. That’s what I did in this study: estimated statistical models that compare the annual test-score gains of charter schools to the gains of district schools serving similar students who reside in the same school districts.[12]
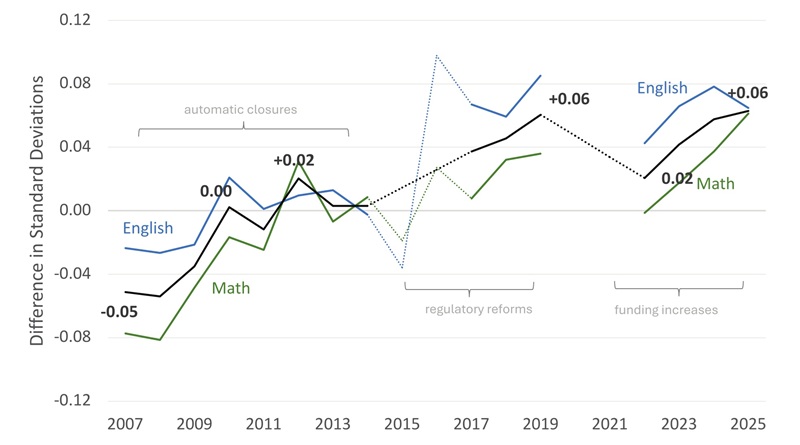
Figure 1 below provides relative gain estimates across charters (weighted by each school’s enrollment) for grades 4–8, as tests were administered most consistently in those grades.[13] It reveals a steep upward trajectory of charter school performance. Charter students’ average annual gains on English and math tests (the black line) were 0.05 standard deviations below that of nearby district schools during the 2006–07 school year (labeled “2007”). By the 2024–25 school year, however, charter school students outpaced those in district schools by 0.06 standard deviations, on average. These are annual achievement gains. They compound as students progress through school. The estimate for the 2024–25 school year implies that, if a student attended a charter school from grade 4 to grade 8, by grade 8 that student’s test scores would be 0.3 standard deviations higher than they would have been had they attended a nearby district school. This estimated difference is roughly equivalent to charter students getting an additional 75 percent of a school year (130 days of additional instruction) over those five years.[14]
Figure 1. Difference in annual test-score gains between charters and district schools
Note. The figure presents the estimated differences in annual test-score gains between charter schools and nearby district schools. Estimates are reported in standard deviation units, such that positive (negative) numbers indicate that students in charter schools increase their achievement more (less) than similar students in nearby district schools. Dashed portions of the average achievement trends (in black) capture imputed linear trends created by connecting with a line estimates from 2013–14 to 2016-17 (i.e., excluding the wild estimates due to PARCC, reported as dashed blue and green lines) and connecting estimates from 2018–19 and 2021–22 (because missing test score data from 2019–20 preclude the estimation of gains for two years).
Though few students attend a consistently high-performing school for five years, the cumulative effects are likely still large for the average student. Even if the cumulative effects were 0.2 standard deviations (two-thirds of the implied cumulative achievement advantage in charter schools today) such effects would be large compared to those of other education interventions.[15] With this benchmark in mind, the improvement of 0.11 standard deviations in average annual test-score gains between 2006–07 and 2024–25 is enormous. Quality varies by individual school, however. For example, during the 2024–25 school year, 26 percent of charters posted average achievement gains in English that were statistically significantly lower than those of nearby district-run schools, and 40 percent of charters posted lower average gains in math.[16]
Note that the historical estimates of charter school performance are like those found in other rigorous studies that assess Ohio’s charter sector, demonstrating steady improvement since 2006–07, a peak in performance in 2018–19, and a steep decline during the pandemic.[17] This analysis is the most recent and, thus, the first to document a complete rebound from 2021–22 to 2024–25. The average charter school is, once again, performing at its 2018–19 peak. Interestingly, achievement gains in math are now at their highest ever.
C. Charter School Accountability, 2007–2025
Notable changes in charter school accountability have contributed to the steep improvements in their performance over time. First, Ohio’s automatic charter school closure law, enacted in 2006, requires poorly performing charter schools—determined in large part based on students’ annual test-score gains—to shut down. This law eliminated schools with low achievement gains (which mechanically contributes to the positive trend in Figure 1) and significantly improved the achievement of students who were displaced by school closure between 2008–09 and 2012–13.[18]
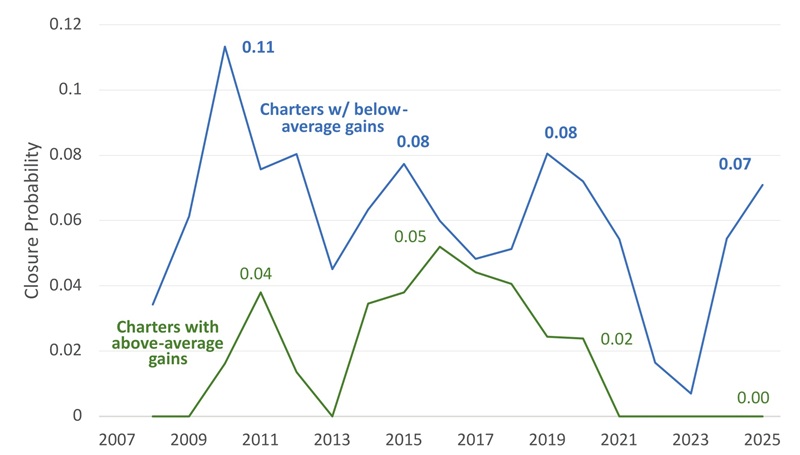
Figure 2 (below) illustrates the force of the closure law by comparing the closure rates of charter schools that had below-average test-score gains in the prior school year (blue line) and those that had above-average value-added estimates in the prior school year (green line).[19] The rate of school closure (for any reason, not just the closure law) for below-average schools quickly climbed to 11 percent by 2010, significantly outpacing the closure rate for schools with above-average test-score gains, which peaked at 4 percent during the 2007–2013 period. This gap in closure rates is remarkable when one considers that the identification of schools as being below- or above-average is a rough approximation.[20] The gap is often higher if this comparison is limited to only those schools whose performance we can categorize with high statistical certainty—those that are well above or well below average. The above/below distinction used in Figure 2 is rough, yet the law’s effects are so pronounced that they nonetheless shine through.[21]
Figure 2. Closure probability of charter schools with above-average and below-average annual test-score gains as compared to all public schools in students’ districts of residence
Note. The figure presents the annual closure probabilities of charter schools with above- and below-average test-score gains. Specifically, it presents the proportion of charter schools that were in operation the previous year but were no longer in operation each year. Closure statistics for 2019–20 and 2020–21 are based on 2018–19 test-score gains, as test-score gains were not available in those years. From 2007–08 through 2024–25, the average closure rate for the 250 charter schools in operation in the average year was approximately 6 percent (15 schools). Among schools with value-added scores (approximately 221 in the average year), approximately 7 percent of below-average schools close (approximately 10 schools per year) and 2 percent of above-average schools close (approximately 2 schools per year).
In addition to the school closure law, other charter school regulations increased steadily from 2007 through 2025. Most notably, the Ohio General Assembly enacted a package of reforms in 2015 that instituted a more rigorous accountability system for charter school sponsors—nonprofit and government organizations that authorize and oversee Ohio charter schools—and imposed a variety of other rules on their financial management and operators. The improvements in charter performance between 2014–15 and 2018–19—despite the diminished link between closure and school performance in that period—were likely at least partly attributable to the 2015 regulatory reforms.
By 2025, after a reduction in closures following the pandemic, the differential closure rates reemerged between charter schools with above-average gains and those with below-average gains. Seven percent of schools (10 schools) with gains below the district average in 2023–24 were no longer in operation during the 2024–25 school year, whereas none of the charters with above-average gains shut down. Switching the comparison to charters with gains above or below the average for nearby district-run schools (as in Figure 1), during the 2023–24 school year 96 of the 226 charter schools for which gains could be calculated demonstrated statistically significantly lower gains than nearby district schools in at least one subject, and 10 of these schools were no longer in operation during the 2024–25 school year. On the other hand, 130 of the 226 charters posted higher annual achievement gains than nearby district schools in at least one subject in 2023–24, and all were still in operation the following year.
D. Charter School Funding, 2020–2025
Recent funding reforms may also help explain the dramatic post-pandemic turnaround, particularly in terms of math achievement. Ohio charter schools have always spent less per pupil, on average, than district schools, but the resource disparity between charter and district schools has been difficult to quantify due to data limitations and differences in how charter and district schools operate. The analysis in this report employs fine-grained school-level spending data and student-level attendance data to more precisely characterize the spending gap.
Since the 2018–19 school year, Ohio’s school-level spending data have included estimates of district schools’ share of central-office expenditures, in addition to their direct operating expenses, making school-level spending data more comparable between charters and district schools.[22] Comparing charter and district spending remains challenging, however, as school-level spending depends on the characteristics of the students a school serves (such as their grade level and special-education and English-language status, as well as the income and property values of district households[23]) as well as the financial cost of operating a school in a particular locale (such as the cost of human and physical capital). To partially address these challenges, this analysis links school-level funding to student-level data, comparing the average expenditures of the charter and district schools attended by students who reside in the same district and who are in the same grade.[24] These spending comparisons are also restricted to students in grades 4–10, so that they correspond to the analysis of student outcomes later in this report.
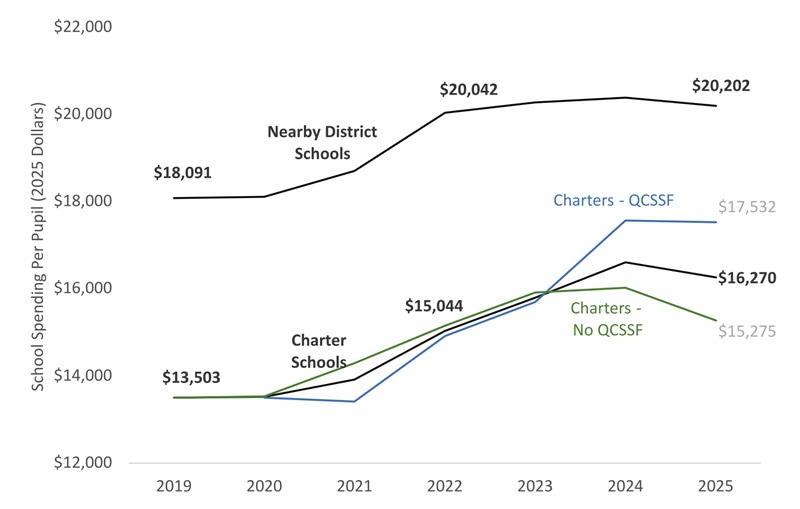
Figure 3. Spending per pupil among charter schools and nearby district schools serving students in the same district of residence
Note. The figure presents the estimated difference in school spending between charter schools and corresponding district schools serving students from the same residential district. The estimates are weighted by school enrollment and focus on students in grades 4–10.
Figure 3 presents the estimated differences in overall spending per pupil. It reveals that for the average charter student in the sample, nearby district schools outspent their charter school by approximately $4,500 during the 2018–19 school year ($18,091 to $13,503 in 2025 dollars). This difference increased to approximately $5,000 by the 2021–22 school year ($20,042 to $15,044 in 2025 dollars). But the gap subsequently narrowed as the state increased support, primarily via the Quality Community School Support Fund (QCSSF) program. The subset of charter schools that received this funding were able to cut the expenditure gap in half—from $5,000 to $2,500—by the end of the 2024–25 school year, whereas charters that did not receive the funding still had a gap of $5,000 relative to nearby district schools (district schools spent $20,202 per pupil whereas non-QCSSF charters spent $15,275). The QCSSF program is the focus of the remainder of this report.
Quality Community School Support Fund
Governor DeWine and the Ohio General Assembly enacted the Quality Community School Support Fund in 2019.[25] Starting in January 2020, high-quality schools that served primarily low-income students could receive up to $1,750 per economically disadvantaged student and up to $1,000 per non-economically disadvantaged student.[26] Lawmakers increased maximum payment amounts significantly beginning in the 2023–24 school year, to $3,000 per economically disadvantaged student and $2,250 for others. Approximately 25 percent of charter schools qualified and, because over 94 percent of students in these schools were economically disadvantaged, the average QCSSF payment more than doubled to $2,957 per pupil.
Prior work examined the impact of QCSSF between 2019–20 and 2022–23, showing that the program benefited students.[27] Here, the analysis focuses on the substantial change in funding starting in the 2023–24 school year. Because the QCSSF program selects schools based on educational quality, it may improve the performance of Ohio’s charter sector by 1) lowering the risk that high-quality schools close for financial reasons and 2) boosting further the performance of these schools by enabling investment in operations and capital. In that sense, it combines the accountability and funding dynamics described above. The analysis below estimates just how much more effective QCSSF schools are, describes how their operations differ in terms of spending and staffing, and, finally, assesses the extent to which higher funding (as opposed to the selection of schools based on quality) caused these differences in performance and operations between QCSSF and non-QCSSF schools.
A. Causal Impact of Attending a Charter School Receiving QCSSF Funding
Ninety-two percent of charter schools (58 of 63) that qualified for the increased funding during the 2023–24 school year did so because they were deemed highly performing according to the QCSSF program’s Criterion 1 (see Table B1 in Appendix B). This criterion requires that a school primarily serve economically disadvantaged students, that its sponsor’s rating is “exemplary” or “effective,” that it have a performance index score (average student achievement on state tests) higher than the district in which it is located in each of the two most recent state report cards, and that it have a “progress” rating of four or five stars on the most recent state report card. This last requirement means that a school’s students need to post annual test-score gains significantly above the Ohio average for similar students.
The analysis below estimates the overall academic benefits for students attending schools that received QCSSF funding during the 2023–24 and 2024–25 school years. Specifically, it estimates the causal impact of attending these schools on students’ achievement and attendance by comparing the academic trajectories of charter school students who did and did not attend schools that received payments. To increase the similarity of students who did and did not attend schools receiving QCSSF funding, the analysis effectively compares charter students who attended the same school at baseline but only some of whom would go on to attend a charter school that received QCSSF funding.[28]
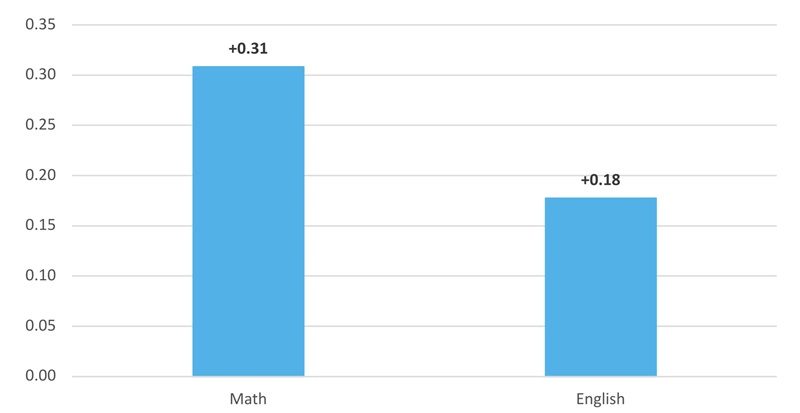
Figure 4. Improvements in student achievement at QCSSF schools
Note. The figure presents the estimated impact of a student attending a school receiving QCSSF payments on their achievement during the 2023–24 and 2024–25 school years. Positive numbers indicate that students in QCSSF schools experienced larger achievement growth than students who did not attend QCSSF schools. For example, an estimate of 0.3 indicates that attending a QCSSF school led to achievement growth that is 0.3 (30 percent) of a standard deviation greater. Solid bars indicate that the estimates are statistically significant at the 5 percent level.
Figure 4 presents the estimated impact of a student attending a school receiving QCSSF payments in 2023–24 and 2024–25 on their achievement in math and English in grades 4–8 and high school (primarily grade 9 for math and grade 10 for English). It indicates that students attending QCSSF schools in those years experienced an immediate increase in math and English achievement of 0.31 of a standard deviation and 0.18 of a standard deviation, respectively. Again, effect sizes of 0.2 or above can reasonably be characterized as “large” compared to other education interventions.[29] These effects occur in the first year or two and are roughly equivalent to students getting an extra 60–75 percent of a school year (100 to 130 days) of additional instruction relative to their charter-school peers who did not attend a QCSSF school.[30]
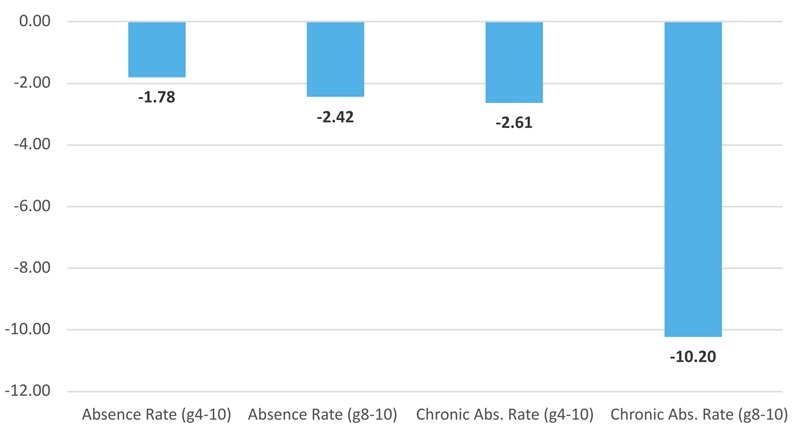
Figure 5. Reductions in student absences at QCSSF schools
Note. The figure presents the estimated impact of a student attending a school receiving QCSSF payments on their absence rates during the 2023–24 and 2024–25 school years. Positive (negative) numbers indicate that students in QCSSF schools experienced higher (lower) absence rates than students who did not attend QCSSF schools. For example, an estimate of -1.78 indicates that attending a QCSSF school led to absence rates that are 1.78 percentage points lower. Solid bars indicate that the estimates are statistically significant at the 5 percent level.
Figure 5 presents the estimated impact of attending a QCSSF school on absence rates (the percent of instructional hours that students missed during the school year) and on rates of chronic absenteeism (the proportion of students who missed 10 percent or more of instructional hours). The results indicate that QCSSF students’ absence rates in grades 4–10 declined by 1.78 percentage points relative to the absence rates of peers who did not attend QCSSF schools. Consistent with this result, rates of chronic absenteeism went down 2.61 percentage points. These effects appear modest given the baseline rates of overall absence (12 percent) and chronic absence (46 percent), but these overall results mask pronounced effects for students in later grades. Focusing on students in grades 8–10 reveals somewhat greater reductions in absence rates (a reduction of 2.42 percentage points) and a large reduction in rates of chronic absence (by 10.20 percentage points). Thus, when it comes to attendance, the primary benefit of attending a QCSSF charter school is a reduction in chronic absenteeism among high school students.[31]
B. Operational Differences between QCSSF and non-QCSSF Schools
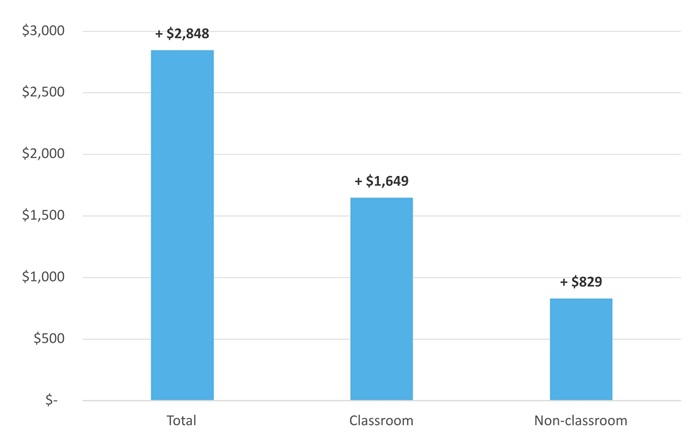
Using the same research design and student sample used in the analysis of academic outcomes, one can assess how school operations differed for students who did and did not attend QCSSF schools. Figure 6 (below) reveals that, predictably, the QCSSF schools that students attended reported spending $2,848 more per pupil (in 2025 dollars) than the non-QCSSF charters that their peers attended. The figure also reveals that 58 percent of this spending was directed toward the classroom (such as teachers, aides, counselors, and instructional support staff) and 29 percent was spent on non-classroom administration and operations. The remainder was spent on nonoperating items such as capital outlays, equipment, and interest on debt.
Figure 6. Spending differences students experienced in QCSSF schools
Note. The figure presents the differences in school-level expenditures per pupil experienced by students attending QCSSF schools as compared to those not attending QCSSF schools during the 2023–24 and 2024–25 school years. Positive numbers indicate that QCSSF schools spent more on that function relative to non-QCSSF schools. For example, the figure indicates that charter schools receiving QCSSF funding spent a total of $2,848 more per pupil (in 2025 dollars) than schools not receiving QCSSF funding. Solid bars indicate that the estimates are statistically significant at the 5 percent level.
Figure 7. Spending differences students experienced in QCSSF schools, in more detail
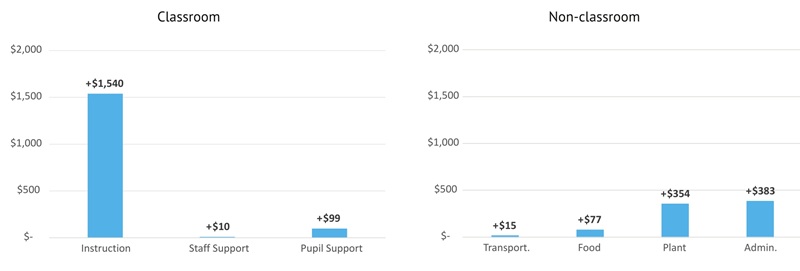
Note. The figure presents the differences in school-level expenditures per pupil experienced by students attending QCSSF schools as compared to those not attending QCSSF schools during the 2023–24 and 2024–25 school years. Positive numbers indicate that QCSSF schools spent more on that function relative to non-QCSSF schools. For example, the figure indicates that charter schools receiving QCSSF funding spent $1,540 more per pupil (in 2025 dollars) on classroom instruction than schools not receiving QCSSF funding. Solid bars indicate that the estimates are statistically significant at the 5 percent level.
The Ohio Department of Education and Workforce further disaggregates classroom and non-classroom expenditures into the categories in Figure 7. Ninety percent of additional classroom expenditures ($1,540 per student) were directed toward instruction (activities involving the interaction of students and teachers or instructional aides and materials like textbooks), but there were also increases of $99 per student in pupil support services, such as counseling, health and psychological services, and social work, and $10 per student in instructional staff support services such as professional development. For a school with 400 students (roughly the baseline average for the subset of charters used in this portion of the analysis), the totals are approximately an extra $615,000 spent on instruction, $40,000 on pupil support, and $4,000 on staff support. The additional nonclassroom expenditures primarily went toward school administration ($383 per pupil) and school maintenance ($354 per pupil)—approximately $150,000 and $140,000, respectively, for a school with 400 students.[32]
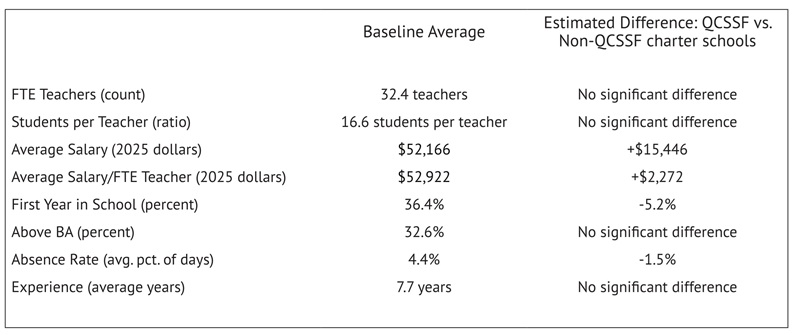
If a QCSSF school were to direct all additional instructional dollars toward teachers, as opposed to aides or instructional materials, the increases in instructional expenditures are enough to hire an additional dozen teachers or, instead, give all teachers in the average school a raise of approximately $20,000. The analysis of staffing data—reported in Table 2—indicates that QCSSF schools direct money toward salaries, as opposed to more teachers. Unfortunately, the salary data are messy (e.g., they contain missing and implausible values) and it is unclear how much of the extra instructional spending went toward salaries, as opposed to instructional aides or materials. The analysis indicates that students in QCSSF schools were exposed to teachers who make an additional $15,446 annually. However, ODEW recommends that teacher salaries be divided by teacher full-time-equivalent (FTE) assignments, to account for how much a teacher’s time is spent in a school. Doing so reduces the salary difference from $15,446 to $2,272.
Table 2. Teacher staffing differences in QCSSF schools (2023–24 and 2024–25)
Note. The table presents the estimated differences in teacher counts, salary, turnover, educational attainment, absence rate, and experience experienced by students attending QCSSF schools as compared to those not attending QCSSF schools during the 2023–24 and 2024–25 school years. Positive (negative) numbers indicate that QCSSF schools had more (less) of the relevant quantity. For example, the table indicates that students attending charter schools receiving QCSSF funding were in schools that paid their teachers $15,446 more annually. Estimated differences are presented if they are statistically significant at the 5 percent level. As a reference point, the table also provides the baseline average (before students experienced QCSSF funding) for students who did not end up in a school that received QCSSF funding.
Another challenge with the staffing analysis reported in Table 2 is that the QCSSF schools students attend are much smaller than those of their peers in the sample. Indeed, there are approximately 300 fewer students in the average QCSSF school than in the non-QCSSF schools that comparison students attend (see Table D3 in Appendix D). This may contribute to volatility in statistics scaled by teachers and student counts and, in turn, makes it more difficult to identify precise differences in staffing. That may partially explain the lack of statistically significant differences in student-teacher ratios, for example.[33]
There are some clear takeaways from the staffing analysis in Table 2, however. Students who ended up in QCSSF schools—those who experienced the large academic gains detailed above—were exposed to teachers with higher salaries (between $2,272 and $15,446 more), who turn over less (by 5.2 percentage points, a 14 percent reduction in first-year teachers relative to the baseline of 36.4 percent), and who miss less school (by 1.5 percentage points—a 34 percent reduction in missed school days relative to the baseline of 4.4 percent).[34] But students in QCSSF schools did not have teachers with more advanced degrees or who were more experienced, and the evidence suggests comparable student-teacher ratios.
C. Causal Impact of QCSSF Charter School Funding
The analysis above reveals that charter students who attended QCSSF schools experienced large academic gains compared to their charter-school peers who did not attend QCSSF schools. As anticipated, they also experienced differences in overall expenditures per pupil ($2,848), which their schools spent on instruction and, to a lesser extent, administration and plant maintenance. What the analysis above cannot say, however, is whether the differences in operations and academic effectiveness were because of the extra funding or merely reflect preexisting differences between QCSSF and non-QCSSF charter schools. After all, the QCSSF program provides additional funds to schools that posted student achievement gains above the Ohio average, perhaps because they have more effective curriculum and leadership or stronger school cultures.
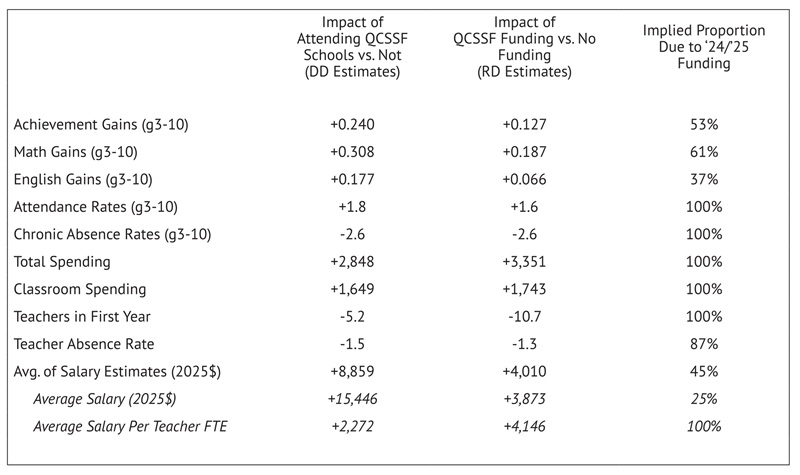
To get a sense for how much one can attribute to the extra funding, Table 3 (below) reports the results of a regression discontinuity (RD) analysis that compares the operations and academic outcomes of charter schools that narrowly qualified for up to $3,000 per pupil in extra funding during the 2023–24 year to those of nearly identical charter schools that narrowly failed to qualify for the extra funding in that year.[35] A strength of this design is that it can identify the causal impact of funding on schools near the performance cutoff for the QCSSF program—which were of average to above-average quality. A weakness of the design is that the results may not be generalizable to more poorly or highly performing charter schools. Additionally, the design yields less precise estimates than the difference-in-differences design presented above. Thus, the results should be considered rough estimates of the causal impact of receiving greater state funding on the operations and academic effectiveness of charter schools.
The results in Table 3 suggest that approximately 50 percent of the achievement effects of attending QCSSF schools were due to their having greater funding, and that 100 percent of the reductions in absence rates were due to the extra funding. They also suggest that the overall differences in spending, as well as differences in classroom and non-classroom spending, were fully attributable to additional funding provided by the QCSSF program.[36] Finally, the estimated effects of QCSSF on teacher turnover and absences are largely similar, but the estimated impacts on teacher salaries ($3,873 and $4,146, depending on the measure) are on the lower end of the range presented above ($2,272 and $15,446, respectively). Given these results, it seems reasonable to state that QCSSF funding is responsible for approximately a $4,146 increase in annual teacher salaries.
Table 3. Percent of impacts plausibly due to QCSSF funding in 2023–24 and 2024–25
Note. The table presents the estimated effects of students attending QCSSF schools (based on the difference-in-differences (DD) analysis featured in this report) to the estimated impact on a school of receiving QCSSF funding, which is based on a regression-discontinuity analysis comparing charter schools that narrowly qualified for the funds to schools that narrowly failed to qualify for the funds. Some of the estimated RD estimates are statistically insignificant—and several of the estimates are from underpowered models—so the estimates are rough approximations.
The RD analysis makes clear that much of the effectiveness of QCSSF schools is due to the increase in funding and not merely because the program selects schools based on their performance. The RD analysis has some important limitations, however. The design does not perfectly distinguish between schools that did and did not get funding and, thus, the magnitudes of the estimated coefficients are likely somewhat muted.[37] The RD analysis also focuses on the impact among schools that were above average (or nearly above average) in terms of their annual student achievement gains. Thus, one cannot be sure that the estimated effects would have been the same for the very best and very worst charter schools. Finally, we cannot completely rule out that the academic outcomes are driven by motivated students selecting into these schools when the QCSSF award occurred. Although the analysis examines student-level gains in achievement—thus holding fixed student achievement at baseline—the students who experienced academic gains in schools that received QCSSF funding were more mobile than comparison students in schools that did not receive QCSSF funding. These dynamics present the possibility that something other than instructional inputs drove improvements in schools that received QCSSF funding.
Summary and Implications
The performance of Ohio’s charter schools has improved dramatically over the past two decades. In the 2006–07 school year, charters on average produced lower academic gains than nearby district schools serving similar students. Today, the typical charter school generates significantly larger achievement gains than district schools serving the same student populations—despite operating with substantially less funding. This analysis links the remarkable turnaround to public policy.
Ohio’s automatic charter school closure law, sponsor evaluation system, and other quality-control efforts have increased the consequences for persistently weak performance, while state initiatives that provide additional funding to effective charter schools have rewarded strong results. The above analysis suggests that these forces have gradually reshaped the sector by allowing more effective schools to expand while removing those that consistently underperform. Recent increases in charter school funding have also further enhanced the performance of high-quality schools serving economically disadvantaged students, who stand to benefit most from additional resources. Although these charter schools still spend approximately $2,500 less per pupil than nearby district schools and did not begin receiving the larger payments until January 2024, student achievement and attendance nonetheless increased significantly during the 2023–24 and 2024–25 school years—far beyond the academic gains in neighboring district schools and non-qualifying charter schools. It is possible that the academic benefits of these investments will grow even larger in subsequent years as schools have greater opportunity to deploy the resources strategically.
Some observers may question whether the improvements documented in this report simply reflect changes in the students who charter schools serve rather than genuine improvements in school performance. The analysis addresses this concern directly. The estimates compare the academic growth of charter school students with that of district school students who live in the same communities and have similar prior achievement levels. As a result, they capture differences in the gains students make after enrolling in charter schools rather than differences in the characteristics of students who choose them. The findings are also consistent with prior research documenting steady improvements in Ohio’s charter sector over time. Taken together, the evidence suggests that the sector’s rising performance reflects real improvements in school quality rather than shifts in student composition or other statistical artifacts.
The results carry important implications for policymakers. Ohio’s experience suggests that strong accountability policies can play a central role in improving the quality of charter schools over time. By imposing consequences for persistently weak performance, the state’s closure law and sponsor evaluation system have helped remove ineffective schools while allowing stronger schools to expand. At the same time, targeted funding increases for high-performing charter schools have further improved outcomes. In combination, these policies create a system that both rewards effectiveness and provides successful schools with the resources needed to serve students well. The results of this report suggest that maintaining this balance—rigorous accountability paired with strategic investment in effective schools—is a promising strategy if Ohio hopes to build upon charter schools’ considerable progress.
Acknowledgments
We wish to thank Dr. Stéphane Lavertu for his fine work conducting the analysis and authoring this report. Special thanks to the Ohio Department of Education and Workforce for providing the data necessary for the analysis. On the Fordham team, we appreciate the thoughtful feedback from our colleagues Michael J. Petrilli and Chester E. Finn, Jr., as well as assistance from Jeff Murray. Thanks also to Andy Kittles for laying out the publication.
—Aaron Churchill and Chad L. Aldis
Thomas B. Fordham Institute
[7] The analysis includes all site-based, brick-and-mortar charter schools, including “special education” charters in which a majority of students have independent education plans.
[8] Ohio lawmakers have also expanded school options by providing families vouchers to send their children to private schools. This study, however, focuses on charter schools, which are public school options and do not require a voucher.
[9] These statistics are unlikely to match official statistics perfectly, as they are based on the author’s calculations using student-level data and include students in K–12 only.
[10] There are also seven online “virtual” schools and 82 schools that focus on dropout prevention and recovery that are legally charter schools, but they are not comparable to traditional public schools.
[11] For an accessible review, see Cory Koedel, “Value-Added and Growth Models in Education,” in Live Handbook of Education Policy Research, ed. Douglas Harris (Association for Education Finance and Policy, 2025), accessed December 2, 2025. For a technical review, see Andrew Bacher-Hicks and Cory Koedel, “Estimation and Interpretation of Teacher Value Added in Research Applications,” in Handbook of the Economics of Education, vol. 6, ed. Eric A. Hanushek, Stephen Machin, and Ludger Woessmann (Amsterdam: Elsevier, 2023), 93–134.
[12] See Appendix C, section titled School Value-added #1, for details of the statistical procedure.
[13] These estimates are distinct from but comparable to Ohio’s official school value-added estimates.
[14] Research indicates that students typically experience annual test-score growth of 0.314 of a standard deviation in reading and 0.422 of a standard deviation in math in grades 4–8. Dividing these gain estimates by the typical growth rates yields a fraction of a school year, which can be multiplied by 180 (the typical number of instructional days in a school year) to estimate additional days of learning. See Carolyn J. Hill, Howard S. Bloom, Alison R. Black, and Mark W. Lipsey, “Empirical Benchmarks for Interpreting Effect Sizes in Research,” Child Development Perspectives 2, no. 3 (2008): 172–77.
[16] Specifically, the difference between a charter school’s gain estimate and the gain estimate among nearby district schools was negative and statistically significant at the 5 percent level.
[19] These value-added estimates once again capture the achievement gains of a school’s average student relative to gains for similar students in the residential district, but without differencing out the estimated value-added of nearby district schools. The procedure for generating these estimates is described in Appendix C, in the section titled School Value-added #2. The results are similar when the difference in gains is used to identify high and low performers.
[20] Schools are categorized based on a single year of achievement gains and many schools categorized as above or below are very close to the average gain of zero. Consequently, the differences between above- and below-average schools often fail to reach statistical significance.
[21] The law identified schools for closure based on multiple prior years of performance data, starting with 2006–07 and 2007–08 gains estimates. Thus, increases in closure should occur beginning in 2009, which is consistent with the trend in Figure 2. The figure also reveals a temporary narrowing of the gap in closure rates between 2013–14 and 2017–18 and between 2021–22 and 2022–23. These periods line up with the increased noisiness of the gains estimates and, most importantly, the temporary provision of “safe harbor” from the consequences of the closure law, due to the introduction of PARCC assessments in 2015 (lasting between 2014–15 and 2016–17) and, later, the onset of the COVID-19 pandemic in 2020 (lasting from 2019–20 to 2021–22). Note that as of 2024–25, the gap in closure rates between schools with above-average test-score gains (0 probability of closure) and below-average gains (0.07 probability of closure) has reemerged and is the highest since the 2008–09 school year. The closure law is back in full force and high-performing charters now benefit from significantly greater funding that should help them withstand financial shocks and remain open (more on that below). None of the 2023–2025 closures are formally attributed to the closure law, but the law being in force creates incentives and might lead to anticipatory effects such that schools close on their own before the law forces them.
[22] Districts’ central offices provide services to their schools but, until 2018–19, the financial cost of these services was reflected only in district-level expenditure data. Data for the funding analysis were obtained from the Ohio Department of Education and Workforce’s Report Portal: https://reports.education.ohio.gov/overview (accessed December 20, 2025).
[23] Property values affect local district tax revenues, and charter schools do not have access to that revenue (except for a limited number of charters in Cleveland). State funding serves as a partial counterweight to disparities in local tax revenues, allocating more funds to both charter and district schools that serve students who are more expensive to educate.
[24] Specifically, average differences in school spending were calculated by estimating a regression model that estimates, for each charter school, the difference between their spending and the spending of district schools while holding constant student grade and district of residence. The sample of students used in the analysis is the grade 4-10 sample of students used in the calculation of value-added for the 2018–19 through 2024–25 school years. The estimated differences were then combined with average spending in those schools to generate a prediction of average spending per pupil (weighted by charter enrollments) in charter students’ “nearby district schools.”
[26] Due to an appropriation cap, the maximum per-pupil amounts were not awarded through to the 2022–23 school year. In that year, for instance, 45 percent of charter schools qualified and received an average payment of $1,367 ($1,442 in 2025 dollars). Figure 3 seems to indicate that charters getting payments between 2019–20 and 2022–23 did not in fact spend that money, but that is not the case. Schools that narrowly qualified for payments in those years did indeed spend more than those that narrowly failed to qualify (see Lavertu, 2024). But, between 2018–19 and 2022–23, the average charter school that did not qualify for the program spent just as much per pupil as the average school that qualified. It may be that, in the absence of the program, non-qualifying schools would have spent approximately $1,500 more per pupil, on average, than qualifying schools. Indeed, non-qualifying schools were more likely to be in relatively affluent and highly performing districts. And non-qualifying schools include some with exceptionally high spending levels, such as schools that focus on students with autism. Finally, it could also be that non-qualifying schools were more likely to spend pandemic funds or raise other revenue during this period.
[28]Appendix D describes this “difference-in-differences” design and demonstrates that the students suddenly exposed to QCSSF funding had prior trends in achievement and school characteristics that were similar to comparison students who would not go on to attend schools that received QCSSF payments. It also describes the statistical approach used to isolate the impact of the program during the 2023–24 and 2024–25 school years, as schools that received funding in those years sometimes did so by qualifying for the lower payment amounts
[30] Research indicates that students typically experience annual test-score growth of 0.314 of a standard deviation in reading and 0.422 of a standard deviation in math in grades 4–8. Dividing these gain estimates by the typical growth rates yields a fraction of a school year, which can be multiplied by 180 (the typical number of instructional days in a school year) to estimate additional days of learning. See Carolyn J. Hill, Howard S. Bloom, Alison R. Black, and Mark W. Lipsey, “Empirical Benchmarks for Interpreting Effect Sizes in Research,” Child Development Perspectives 2, no. 3 (2008): 172–77.
[31] There are no attendance benefits in elementary and middle-school grades (see Table D3 of Appendix D).
[32] For a school with 300 students (approximately the average for Ohio charters) the totals equate to an extra $460,000 spent on instruction, $30,000 on pupil support, and $3,000 on staff support. The additional non-classroom expenditures for school administration and maintenance were approximately $115,000 and $106,000, respectively.
[33] This difference in enrollments is large and reflects the unique sample of schools that enable the difference-in-differences analysis. Fortunately, the regression-discontinuity analysis below focuses on schools with similar enrollments and yields comparable estimated effects.
[34] The reduction in the percent of teachers in their last year is nearly identical to the reduction in teachers in their first year, but that measure is available for one fewer year so only the percentage of teachers in their first year is reported.
[35] See Appendix E for a description and empirical validation of the research design, as well as tabular results across all school-level outcomes.
[36] Estimates for sub-categories of spending are typically too imprecise to yield statistically significant results, but the estimated coefficients for these sub-categories are generally similar. The main difference is that the regression-discontinuity analysis suggests larger increases in transportation spending (approximately $368 per pupil). See Table E3 in Appendix E.
[37] For example, some schools that narrowly missed out on funding in 2023–24 qualified for funding in 2024–25, and as Appendix E describes, the “running variable” is based on the academic criteria of Criterion 1 and does not account for the few schools that may or may not have qualified based on other factors (e.g., the proportion of students who are economically disadvantaged).