Ohio has a lot to be proud of when it comes to the post-pandemic academic recovery—but also much work left to do. That’s the message that comes out of my recent analysis of spring 2024 state assessment data released earlier this month.
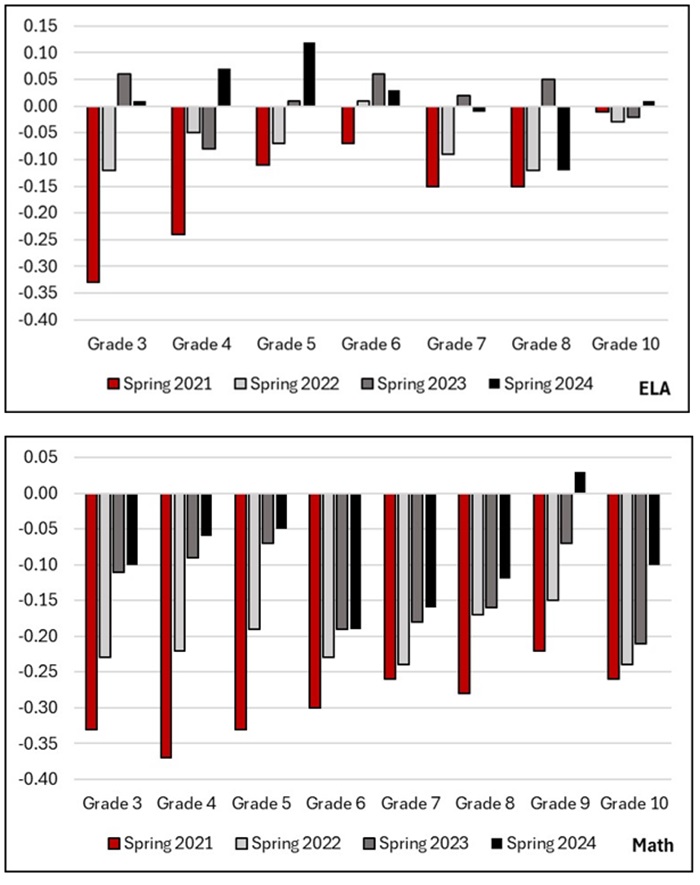
Given our natural inclination to focus on the negative, it is important to start with the good news. In English language arts (ELA), our state has demonstrated tremendous success remediating the learning disruptions we saw emerge in the first year of the pandemic. Indeed, with the exception of eighth graders, Ohio students appear to have completely reversed the large initial achievement declines. And in a number of grades, students performed better last spring than their counterparts before the pandemic. The recovery has been broad-based, benefiting every type of school district and every student subgroup, helping reverse some of the worrying racial- and economically-based achievement gaps we saw grow in the immediate aftermath of the pandemic learning disruptions.
Ohio’s progress on ELA is particularly noteworthy when compared to the broader national landscape. Recently released reports from private assessment companies have painted a bleak picture of stagnation, and on some assessments, students falling further behind. Although it’s not clear why Ohio has bucked this depressing national trend, our state’s concerted focus on improving reading instruction and professional development focused on the latest scientific insights on how students learn how to read may have helped.
Unfortunately, when it comes to math, Ohio’s recovery remains incomplete. Part of this is because the initial achievement declines in math were just much larger, in absolute terms, than in ELA. Even given the same learning gains, it would have taken Ohio students more time to climb back to pre-pandemic levels. And indeed, we did see considerable progress several years ago, with accelerated achievement growth beginning to offset a meaningful share of the pandemic-era losses.
But this progress appears to have stalled out last year, with little evidence of continued math recovery between spring 2023 and 2024 in most grades. As a result, elementary school students remain about a month behind pre-pandemic cohorts in math, with the gap rising to between one-third and one-half of a school year in middle school grades.
Figure 1: Post-pandemic academic recovery by grade in ELA (top) and math (bottom)
The latest numbers point to several important lessons for Ohio policymakers, particularly as they continue to focus on addressing the math achievement shortfall. One is the importance—and limitations—of funding and the other relates to timely data.
On the funding side, the federal government provided school districts across the country more than $200 billion in pandemic-era aid, an unprecedented investment with the stated intent of helping support learning recovery. Ohio schools received more than $6 billion of this funding, and my analyses suggest the money played a role in the partial math rebound: Districts that received more aid, a function of a fixed federal allocation formula, saw their math achievement recover faster in recent years. The magnitude of this effect, however, was fairly modest, with a $1,000 increase in per-student funding raising math achievement by about 0.02 standard deviations. To put that number in context, it would take at least an additional $5,000 for every student in the state to close the remaining math gap at this rate—more than the total amount of federal pandemic aid in Ohio. It seems highly unlikely such a level of investment will be available, especially since the deadline for spending down the remaining federal aid is this year.
Fortunately, the recent improvements in ELA suggests that further progress is possible even in the absence of significant new resources. Unlike in math, where district-level growth depended on the available federal funding, differences in ELA gains across districts were not related to the amount of federal aid that local communities received. The statewide success in addressing the ELA shortfalls show what can be accomplished with sustained focus and attention.
The second lesson is about the importance of timely, accurate data to guide policy. After the cancellation of state tests in spring 2020 at the height of the pandemic, some school employee interest groups saw an opportunity and tried to rally lawmakers to permanently eliminate state testing and accountability linked to it. Wisely, our state leaders resisted these efforts. To the credit of Governor DeWine and top leaders at the Ohio Department of Education and Workforce, Ohio has been a national leader in working with independent researchers like myself to evaluate state and local recovery efforts and making these results public, even when they didn’t always paint a flattering picture.
This has not been the case in some other states. California, for example, threatened to sue a Stanford researcher whose data portrayed the state’s ham-fisted school reopening and recovery efforts in a negative light. But here in Ohio, we’ve had quality data that have allowed policymakers to clearly understand the magnitude of the academic setbacks, identify school districts and student subgroups most affected, and track progress over time.
Ohio continues to show the country what can be accomplished when we make student achievement a priority. We have made tremendous progress, but it is also clear that the job is not yet complete. It is essential that that academic considerations—as opposed to various education culture wars—remain at the top of our agenda.
Last week, the Ohio Department of Education and Workforce (DEW) released updated school report cards that offer a plethora of data from the 2023–24 school year. My colleague Aaron Churchill did a deep dive into achievement and growth indicators. But state report cards also present data on “non-academic indicators,” including chronic absenteeism, which is defined as missing at least 10 percent of instructional time for any reason.
Chronic absenteeism has been a hot topic over the last few years. That’s largely because, during the pandemic, the number of students who were chronically absent nationwide shot through the roof—and then stayed there. But it’s also because we have a lot of data indicating that regular school attendance is good for kids and chronic absenteeism is not. Students who have never been chronically absent are six times more likely to read on grade level by the end of third grade and nine times more likely to graduate from high school on time. On the flip side, being chronically absent can negatively impact both academic and social-emotional development.
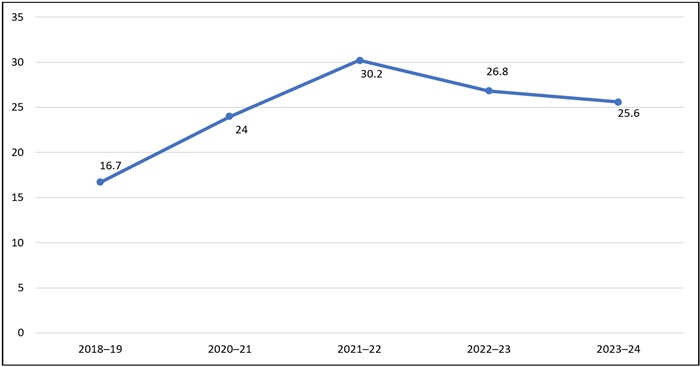
Given these data, many hoped that Ohio’s latest round of school report cards would show a big drop in chronic absenteeism rates. Unfortunately, that’s not the case. Figure 1 below displays Ohio’s statewide chronic absenteeism rate for the most recent years. In 2018–19, the rate was just under 17 percent. By 2021–22, that number had jumped to 30 percent, meaning nearly a third of Ohio students were missing significant class time. Though still too high, the statewide rate ticked down to 26 percent the following year and seemed to promise the start of a downward trend. But the 2023–24 school year produced a rather disappointing rate of 25 percent. The trend is still technically downward. But a decline of 1 percentage point isn’t nearly enough.
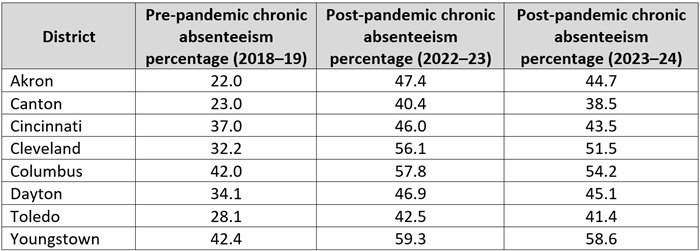
There hasn’t been much improvement in high-poverty districts, either. The table below provides the pre- and post-pandemic chronic absenteeism rates in the Ohio Eight, the state’s major urban districts. On the one hand, their progress in cutting chronic absenteeism outpaces the state. But no district registered a drop of more than 5 percentage points. And in at least three districts—Cleveland, Columbus, and Youngstown—the chronic absenteeism rate remains above 50 percent. That’s a full-blown attendance crisis, as a majority of students enrolled in these districts are missing significant amounts of school. Given that most students in the Ohio Eight are already behind academically, all that lost instructional time is particularly worrisome.
Table 1. Pre- and post-pandemic chronic absenteeism percentages in the Ohio Eight districts
The good news is that state leaders have already signaled that addressing chronic absenteeism is a top priority. Ohio recently joined more than a dozen other states in pledging to cut chronic absenteeism by half over a five-year period. Most of this work will occur at the local level, where it will take a team effort from teachers, principals, community members, and families to move the needle. But there are some things that state policymakers can do to support them.
First, leaders must use their platform to emphasize the importance of attendance. One way to do so would be to launch a statewide public relations campaign that communicates the importance of consistent attendance. A recent report from the Ad Council Research Institute found that successful messaging must have a positive tone and “communicate the opportunities associated with in-person learning” rather than the consequences of absenteeism. That kind of messaging is exactly what schools in northeast and central Ohio (and a few other places, as well) have already experienced via the Stay In The Game! Attendance Network. Ohio leaders could build on those efforts with a statewide campaign that reaches every community. The Ad Council report also found that teachers are the messengers whom parents trust the most when it comes to attendance. A positive statewide messaging campaign (or something like this effort in Massachusetts) that reinforces what families are hearing from their students’ teachers could help immensely.
Second, state lawmakers should commit to maintaining accurate attendance data tracking. Over the last year, there have been attempts to water down data accuracy and transparency by making it easier for students to miss school for “legitimate” absences. While there are plenty of valid reasons for students to miss school, Ohio can’t afford to alter how it tracks those absences. Doing so would only make it look like chronic absenteeism rates have improved when they actually haven’t.
Third, policymakers should use the upcoming budget to direct DEW to take data transparency a step further. Rhode Island is an excellent model, as leaders there have created several publicly available, interactive tools. The state’s real-time attendance dashboards update daily, and show daily, weekly, and monthly attendance trends in individual schools, along with data on early dismissals and tardies (both of which can have a sneakily big impact on chronic absenteeism). The daily chronic absenteeism update allows users to track the percentage of students, by district and grade span, who are already chronically absent, as well as how many of those students reached that threshold during the previous year. The historical absences dashboard does exactly what its name suggests and provides historical data going back to 2017. And the chronic absenteeism and achievement dashboard outlines the importance of attendance by tracking its impact on state assessments. Ohio should create its own version of these dashboards, so that local officials, district and school leaders, and families have detailed and timely data that emphasize the importance of regular attendance and pinpoint where intervention efforts are most needed.
Last fall, the Ohio Attendance Taskforce emphasized that effectively addressing chronic absenteeism would take a team effort. One year later, in the wake of report card data showing minimal progress, the need for urgent action remains. Much of the heavy lifting will fall on the shoulders of local schools and community leaders, as they’re the ones who are most trusted by parents and regularly interact with kids. But state leaders play an important role, too, and implementing the ideas outlined above would be a great place for them to start.
Last Friday, the Ohio Department of Education and Workforce released the state’s annual school report cards for the 2023–24 school year. As usual, they reveal areas of progress and challenges requiring attention. This year, we see encouraging upticks in statewide proficiency in third grade reading and high school algebra. But math achievement overall remains a sore spot—still well below pre-pandemic levels—and chronic absenteeism continues to be widespread.
Beyond these high-level results, we at Fordham have regularly taken deeper dives into the report cards from the Ohio Eight cities (listed below in table 1). The quality of these schools matters greatly, as they are more likely to serve disadvantaged students who most need an excellent education to reach their potential. Their districts and charter schools serve disproportionate numbers of low-income[1] and Black students (57 percent in the Ohio Eight versus 10 percent in non-Ohio Eight districts). Highly effective schools can and do help students make up significant ground, while low-performing schools allow students to fall even further behind. It’s also true that most of Ohio’s public charter schools are located in these cities, and given our commitment to quality charters, we’ve long sought to gauge their performance by comparing their results to nearby district schools.
What does this year’s report card tell us about the Ohio Eight? In a nutshell, we continue to find troubling achievement gaps that require urgent attention and a strong focus on academics. But there’s positive news, too: Urban charter schools are posting stronger pupil academic growth numbers than their district counterparts, suggesting that charter quality continues to improve.
Student achievement
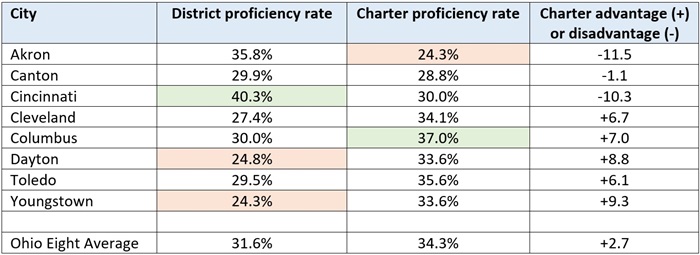
Reflecting persistent achievement gaps, table 1 shows that just one in three Ohio Eight students achieve proficiency on all state exams[2]—a rate that lags far behind the statewide proficiency rate of 58 percent. Relative to the Ohio Eight districts, charters have a slight edge in terms of proficiency (34 to 32 percent), with Columbus charters registering the highest proficiency rates on the charter school side. Among the Ohio Eight districts, proficiency rates are highest in Cincinnati but fall below 30 percent in five other districts. Less than a quarter of students are proficient in Dayton and Youngstown school districts, as well as in Akron’s charter schools.
Table 1: Proficiency rates (all tests) in the Ohio Eight cities, district and charter, 2023–24
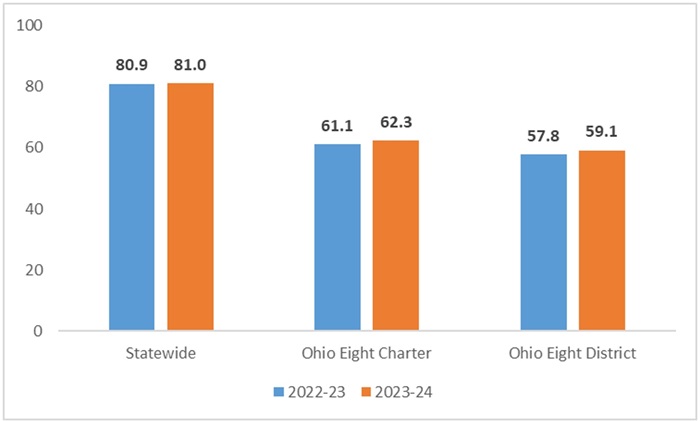
Another way of looking at achievement is through the performance index, a measure that awards additional credit to schools when students score at higher levels on state exams. In contrast to proficiency rates, which focus more narrowly on clearing the proficiency bar, the performance index provides a broader picture of pupil achievement across the entire spectrum. Consistent with the proficiency data, we see that Ohio Eight districts and charters lag significantly behind the state average on the performance index, yet charters again outperform their urban district counterparts (with a weighted average index score of 62.3 versus 59.1). As for changes in scores year over year, both Ohio Eight charters and districts register improvements of similar magnitudes (+1.2 and +1.3 points, respectively).
Figure 1: Performance index scores in the Ohio Eight cities, district and charter, 2022–23 and 2023–24
Value-added progress ratings
Proficiency rates and performance index scores shine much-needed light on achievement gaps and help the public understand where students currently stand academically. But out-of-school factors also influence these results. To provide a clearer picture of schools’ contributions to student learning separate from demographics, Ohio and other states have implemented growth measures that track learning trajectories over time. Ohio relies on a value-addedmethodology that controls for students’ prior achievement on state exams. This allows for a more poverty-neutral look at performance and serves as evidence about the educational effectiveness of districts and schools. District- and school-wide value-added results are the basis of Ohio’s Progress ratings, one of five rated components of the report card.[3]
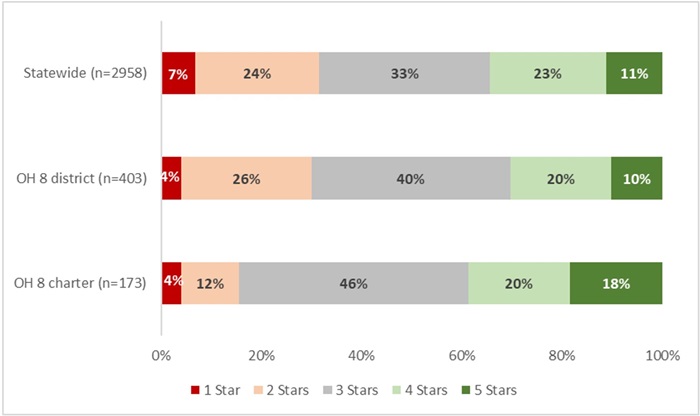
Figure 2 shows the distribution of Progress ratings both statewide and in the Ohio Eight. On this measure, Ohio Eight charter schools outperform their Ohio Eight district counterparts: 38 percent of urban charters receive four- or five-star ratings, while just 30 percent of urban district schools do so. Conversely, fewer urban charters receive poor ratings compared to their district counterparts.[4] Ohio Eight charters also perform favorably compared to public schools statewide (38 versus 34 percent rated four or five stars on Progress).
Figure 2: Progress ratings of Ohio Eight district and charter schools, 2023–24
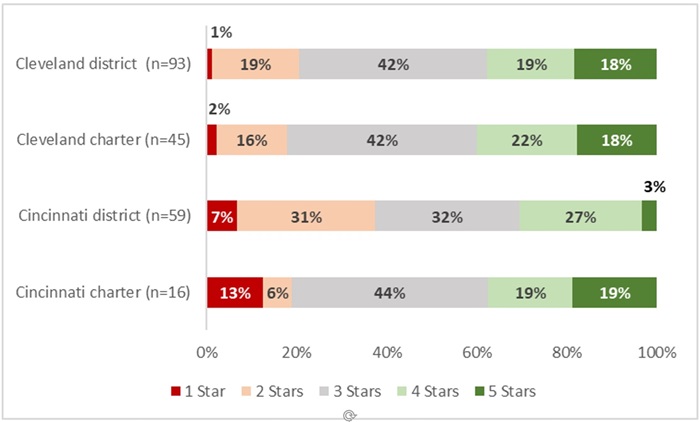
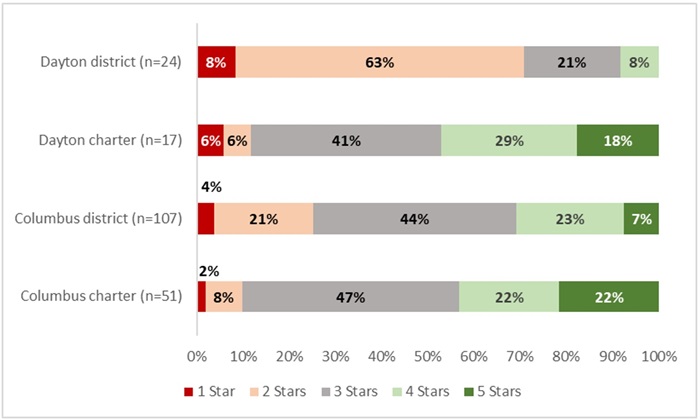
Figure 3 displays a breakdown of Progress ratings in four of the Ohio Eight cities where charters have a larger presence. In Cleveland, charter and district school ratings are nearly identical, but in the other three cities, a higher percentage of charters receive four- and five-star Progress ratings. Dayton charters are noticeably ahead of the city’s district schools, while Cincinnati and Columbus charters hold a more modest edge over district schools. Charters shine particularly brightly when it comes to the proportion of schools receiving five stars for Progress.
Figure 3: Progress ratings of district and charter schools in four of the Ohio Eight cities, 2023–24
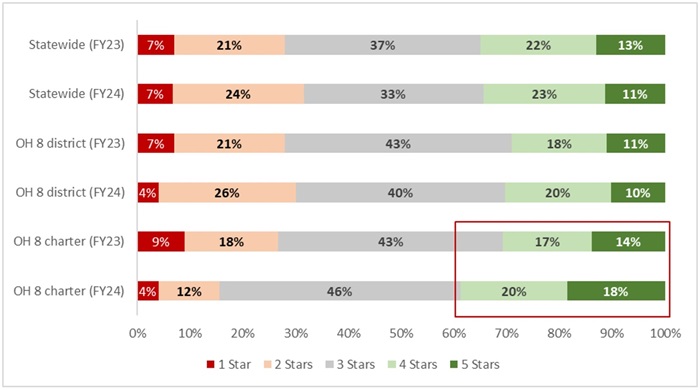
We last present the Progress ratings from the past two years. The rating distributions are consistent statewide and for the Ohio Eight district schools. But—as indicated by the red box—Ohio Eight charters improved on this rating, moving from 31 to 38 percent of schools rated four or five stars on Progress between 2022–23 and 2023–24. Conversely, a smaller percentage of Ohio Eight charters received low ratings last year compared to the year prior.
Figure 4: Progress ratings of Ohio Eight district and charter schools, 2022–23 and 2023–24
* * *
Urban education in Ohio and elsewhere continues to be a complicated and oftentimes discouraging story. With this year’s report cards, we are once again reminded of the urgent work needed to prepare more of Ohio’s urban students for success. No one should be satisfied when two in three students from these communities fall short of grade-level standards.
Yet we also see promising signs of quality, particularly in the charter sector. Report card results suggest that charter performance is on the rise—just as it was prior to Covid—after slumping during and right after the pandemic. Though more analysis is needed, these results may also be an early indication that recent funding improvements are helping to boost charter performance across the board. Of course, more needs to be done to improve charters, and two years of data do not make for a long-term trend. But if Ohio can continue to make headway toward equitable charter funding and maintain strong charter accountability, more students from our urban communities will finally get the education they need to succeed in school and life.
[1] Due to the Community Eligibility Provision, Ohio no longer reports accurate “economically disadvantaged” enrollments and valid numbers cannot be reported. We can infer from Census data and pre-CEP economically disadvantaged enrollments that more low-income students attend Ohio Eight schools than an average Ohio school.
[2] Ohio administers state exams in grades 3–8 in math and reading; grades five and eight in science; and five high school end-of-course exams (algebra I, geometry, English, biology, U.S. government, and U.S. history).
[3] Value-added results of specific student groups (e.g., students with disabilities) are also used in the Gap Closing component.
[4] While not the focus of these charts, the underlying value-added data also point to a charter school advantage. In 2023–24, the average value-added “effect size” of Ohio Eight charter schools was +0.07 versus +0.01 for Ohio Eight district schools.
Ohioans now have access to a brand-new set of school report cards based on results from the 2023–24 school year. The data they contain provide policymakers, advocates, and families with an updated look on how students are progressing academically in the wake of the pandemic. They also offer a closer look at some important non-academic measures—like chronic absenteeism, which skyrocketed during the pandemic and has remained persistently high.
For policymakers and advocates, report cards offer a wealth of information. But for parents and families, it might feel like too much of a good thing and, thus, overwhelming. The big takeaways—like overall ratings for districts and schools, graduation rates, and the percentage of students who are proficient on state exams—are typically front and center in media coverage. That’s understandable, given that they’re traditional and easily understood metrics. But there are also several other measures that, while not on the radar of major media, are exactly the kind of information that families want and need when making schooling decisions. Let’s take a look at three.
Improving K–3 literacy
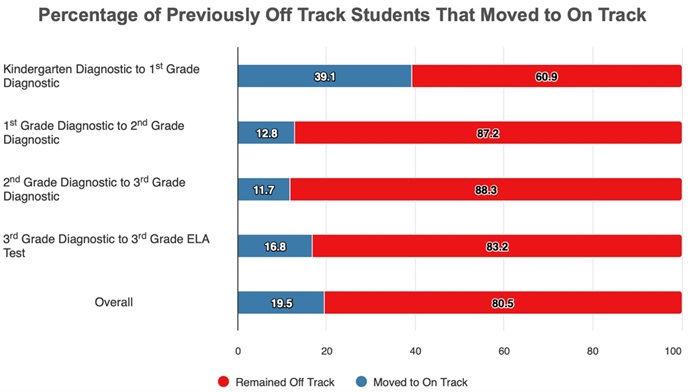
Last year, Ohio policymakers established a statewide initiative aimed at ensuring that schools align their instruction with the science of reading, an evidence-based instructional approach that focuses on phonics andknowledge-building. Going forward, the early literacy component on state report cards will be a crucial part of monitoring the progress of this initiative. And of the component’s three graded measures, student proficiency—how many kids are reading proficiently by the end of third grade—will draw the lion’s share of attention. That makes sense, as proficiency numbers allow us to gauge where students stand at the end of third grade. But for families, the “improving K–3 literacy” measure is, arguably, far more important.
For this indicator, the Department of Education and Workforce (DEW) uses the results of fall diagnostic assessments to determine the percentage of students who move from “not on track” to “on track” in reading from one year to the next. These results indicate how well schools are improving K–3 literacy throughout all the early grades, not just third. And for the parents of young children, knowing whether their child’s school excels or lags behind empowers them to proactively make enrollment decisions or to hold schools accountable for a troubling lack of progress. Here’s what that looks like for Columbus—a picture that indicates plenty of cause for concern.
Image 1: 2023–24 Columbus City Schools results for the improving K–3 literacy measure
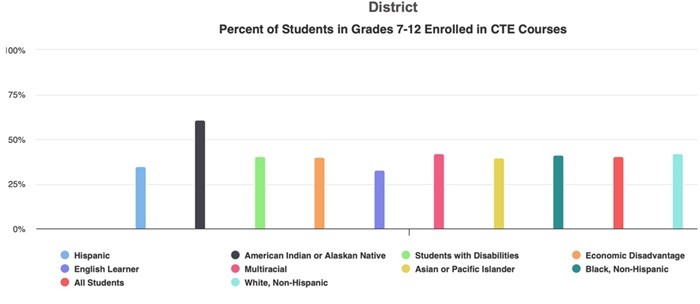
The student-level metrics capture a broad range of activities that “support and enhance” students’ educational and social-emotional development. They are disaggregated by student demographics and grade level and include indicators such as the percentage of students enrolled in CTE, AP, IB, College Credit Plus, or honors courses; how many students participate in co-curricular activities; and how many participate in enrichment or support programs offered by the district outside of the normal school day. Meanwhile, staff metrics offer a look at student-to-staff ratios—not just teachers, but also professionals like nurses, counselors, and social workers—as well as educator experience. Let’s again illustrate how this looks for Columbus.
Image 2: 2023–24 CTE course enrollment according to Columbus City Schools student opportunity profile
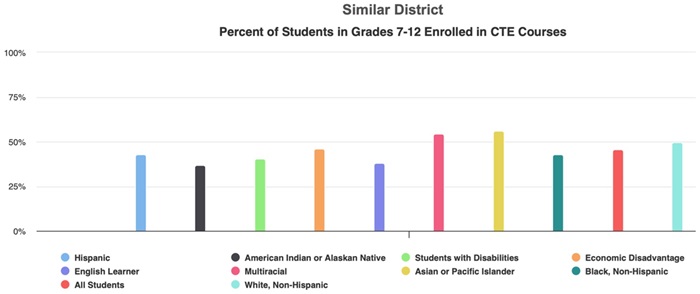
What makes these profiles particularly unique is that, in addition to reporting the data, they also provide comparisons to similar districts and the state. For example, according to the student opportunity profile for Columbus City Schools, the district has a higher percentage of students participating in co-curricular activities (91.3 percent) than similar districts (82.6 percent) and the state (83.3 percent), but a lower percentage of students participating in enrichment offered by the district outside school hours (5.9 percent) compared to similar districts (13.1 percent) and the state (18.2 percent). A larger percentage of teachers and principals in Columbus have fewer than three years of experience compared to peer districts and Ohio as a whole. But Columbus has smaller staff-to-student ratios in a variety of non-teaching areas, including school nurses, counselors, and librarians. By offering these comparisons, the profiles provide important context to families and taxpayers that could shape enrollment decisions (for families) and voting choices (for taxpayers considering school board elections or levies).
Image 3: 2023–24 CTE course enrollment in similar districts according to Columbus City Schools student opportunity profile
Special education profiles
The Individuals with Disabilities Education Act (IDEA) is a federal law that provides civil rights protections to students with disabilities, including the right to a free appropriate public education tailored to their individual needs. IDEA includes a series of indicators that measure services and outcomes. Each year, DEW uses these indicators to create special education profiles for districts that show their progress over time in meeting state goals for students with disabilities. As is the case with student opportunity profiles, links to special education profiles are available on the report card homepage for every district and charter school.
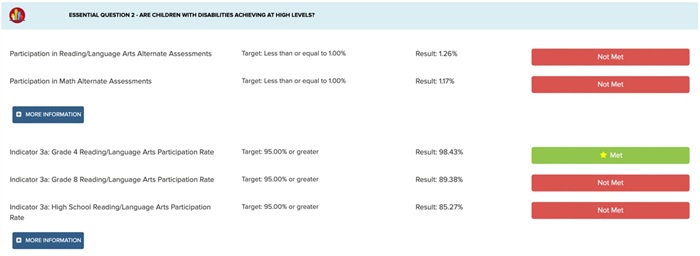
Image 4: 2023–24* special education profile for Columbus City Schools
The profiles organize IDEA indicators into categories based on six essential questions, which are listed below. For each indicator, the profile identifies the district’s target goal, its result, and whether the indicator is considered met, not met, or not counted. The “more information” button provides an in-depth description of each indicator, as well as targets and results for the last five school years, which can be used to identify trends.
Are young children with disabilities entering kindergarten ready to learn?
Are children with disabilities achieving at high levels?
To what extent do students with disabilities have access to the general education environment?
Are youth with disabilities prepared for life, work, and postsecondary education?
Does the district implement IDEA to improve services and results for children with disabilities?
Are children receiving equitable services and support?
***
State report cards are a crucial resource. In some states, report card frameworks do the bare minimum required by federal law, which limits their usefulness. But Ohioans have access to detailed data that go above and beyond federal requirements. The state’s “improving K–3 literacy” measure, as well as its district-specific profiles for student opportunity and special education, offer families and taxpayers invaluable information that can help them make important decisions for their children.
Teachers are the most important in-school factor driving student achievement, and how schools compensate them matters immensely. Entry-level teacher pay is particularly important, as it affects recruitment efforts. Starting salaries influence high school and college students’ decision to pursue teaching (or not), as well as early- or mid-career professionals considering a jump into the classroom. More locally, what individual school districts pay first-year teachers impacts their ability to compete for talent with other districts. Lower starting pay will make a district less attractive to job-seekers and vice versa. High-poverty districts and schools, where working conditions tend to be tougher, need to offer higher salaries to attract talented individuals to their campus.
Conventional wisdom holds that starting teacher pay is mediocre and remains a significant barrier to developing a high-quality workforce. This perception may reflectgloomymediacoverage—often influencedby the unions—that casts teachers in general as underpaid and overworked, despite evidence that the teacher “pay gap” is more myth than reality. More specific to starting salaries, state policy may also add fuel to the low-pay narrative. Under Ohio law, districts must pay a minimum first-year teacher salary of just $35,000. This amount—akin to a minimum wage—is routinely discussed by state legislators and featured in newsarticles, and could easily be understood as the starting salary that districts actually pay.
But what do first-year teachers in Ohio earn? Are their salaries as meager as they are often portrayed? What about high-poverty districts: Are they more prone to paying low starting salaries?
There is no system-wide reporting on districts’ starting teacher salaries. Average salaries are readily available, but first-year-only salaries are not. To locate this information, Fordham intern Heena Kuwayama and I dug up the salary schedules of school districts in Franklin and Cuyahoga counties, the two largest in Ohio. These schedules disclose the salaries that a district’s teachers make based on their years of experience and college degrees/credits-earned, and are included in collective bargaining agreements posted by the State Employment Relations Board. We focus on salaries for first-year teachers with a bachelor’s degree as their highest credential.
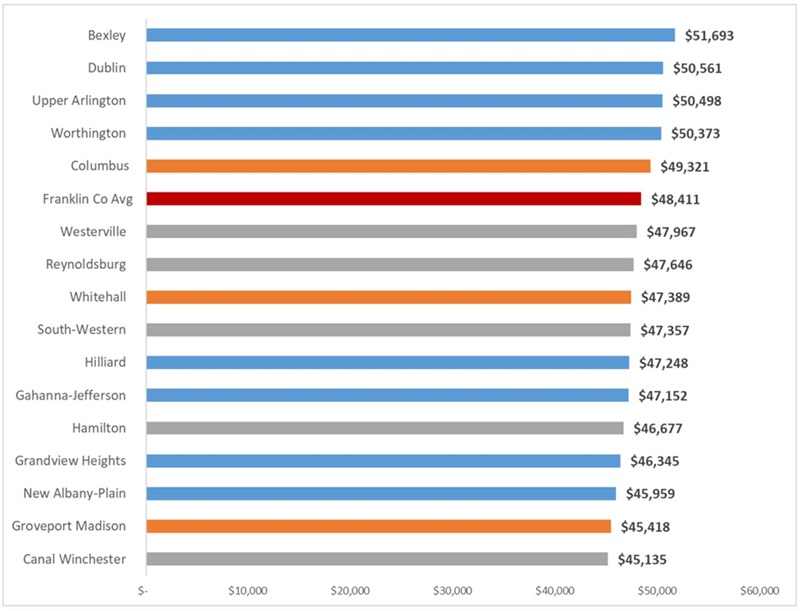
We begin in Franklin County, which includes Columbus and its suburbs. The figure below shows that the average starting salary in the county is $48,411—a healthy 38 percent above the minimum starting pay required in statute. Franklin County districts’ starting pay falls within a relatively narrow range of roughly $45,000 to $50,000, with Columbus paying a reasonably competitive wage that is slightly above the county average and about 10 percent higher than wealthy districts such as Grandview Heights and New Albany-Plain, though below other wealthy districts, including Bexley and Dublin. The maps below, created by my Fordham colleague Adam Tyner, show where the highest-paying school districts are located in the county.
Figure 1: Starting teacher salaries (BA) in Franklin County school districts (FY 2024)
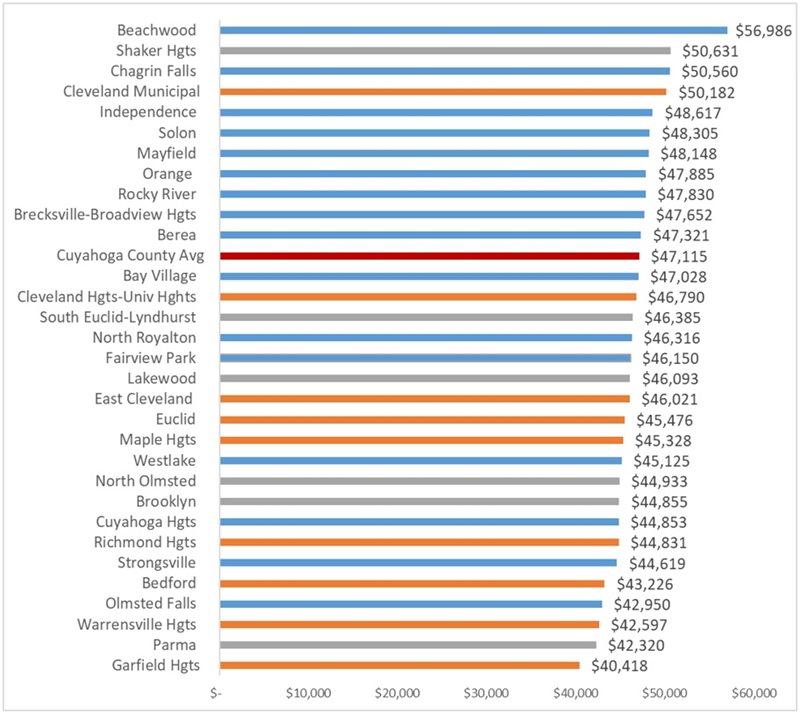
Turning to Cuyahoga County (Cleveland and its suburbs), we notice that districts tend to pay slightly lower starting salaries than Franklin County. Here, average starting teacher pay is $47,115, or 35 percent above the state minimum of $35,000. There is somewhat more variation in starting salaries across Cuyahoga County districts, as pay ranges from approximately $40,000 to $50,000. And we also see a stronger link between districts’ starting salaries and economically disadvantaged rates. Eight of the ten highest-paying districts are wealthy, while the lower-paying districts tend to be mid- and high-poverty. That said, Cleveland boasts one of the highest starting salaries in county at just above $50,000.
Figure 2: Starting teacher salaries (BA) in Cuyahoga County school districts (FY 2024)
As noted earlier, higher-poverty districts likely need to offer more generous starting salaries to attract top-notch teachers. But do they have the funding necessary to do so?
To explore this, Figure 3 looks at the correlation between per-pupil funding and starting pay in Franklin County. We see that mid-poverty districts such as Canal Winchester, Groveport Madison, and Reynoldsburg pay slightly lower entry-level wages, perhaps because they are more budget constrained (receiving less funding to begin with). But it’s not an especially strong correlation, as Reynoldsburg, for example, provides higher starting salaries than Groveport Madison, which receives more funding. Columbus receives relatively high levels of funding and pays better starting salaries than most Franklin County districts.
Figure 3: Total revenue (state and local, FY23) versus starting teacher pay, Franklin County districts
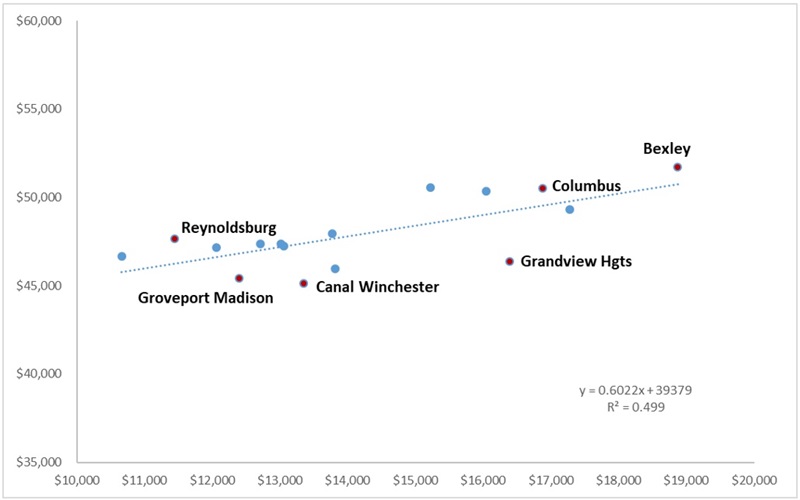
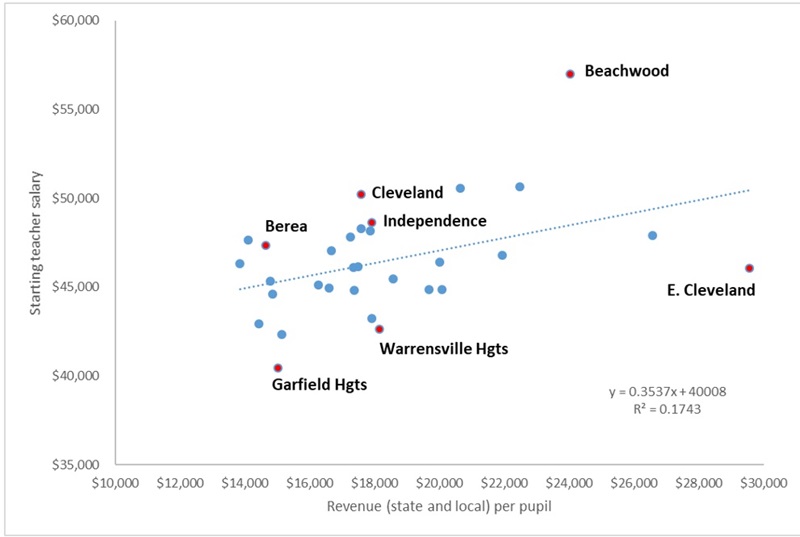
Figure 4 reveals a weaker correlation between Cuyahoga County districts’ revenues and starting teacher pay. Here, the lowest-paying districts in the county often receive comparable funding to districts that provide more generous starting pay. Garfield Heights, for example, pays first-year teachers $40,418, but similarly-funded Berea pays $47,321. Warrensville Heights’s starting salary is $42,597, yet similarly-funded Independence pays $6,000 more to first-year teachers, while Cleveland pays about $8,000 more. East Cleveland is the highest-funded district in the county, spending almost $30,000 per pupil, yet manages to pay new teachers just $46,021 a year. Taken together, these data suggest that funding levels are not the primary barrier to higher starting salaries, but more so a low prioritization of entry-level salaries in the district budget.
Figure 4: Total revenue (state and local, FY23) versus starting teacher pay, Cuyahoga County districts
* * *
Three concluding thoughts on these data:
1. Starting teacher pay is reasonably good in Ohio’s largest metro areas—and that should be more widely known. Most first-year teachers in the Columbus and Cleveland areas are paid $45,000 to $50,000 per year (not including benefits). That’s not half bad, especially for twenty-two-year-olds in their first professional jobs. Of course, these salaries aren’t as large as what some students make out of college, including those who enter more lucrative STEM fields. But starting teacher pay is not that far off from the median statewide salary for all Ohio working adults of about $60,000. And it’s far superior to what a large portion of college students earn early in their careers (one study this year found that a quarter of graduates earn less than $32,000).
Making actual starting salaries better known might persuade more young people to consider teaching. Remember also that, even in its largest cities, Ohio remains a relatively affordable place to live and work, allowing these salaries to go further than other parts of the country.
2.High-poverty districts have room to improve starting teacher pay, but they need to make it a strategic priority. If lower-salary, higher-poverty districts like Groveport Madison and Garfield Heights seek to more aggressively compete for talent, they need to consider ways to prioritize starting (and early career) teacher pay. One possible strategy is to “compress” the salary schedule—i.e., reduce the number of “steps,” or the incremental pay raises tied to experience—to free-up money to raise entry-level pay. They could also rigorously review spending on administrative and non-teaching staff to make sure that as much funding as possible is dedicated to teacher pay. Finally, while it may require changes in state law, districts should be looking to experiment with more flexible compensation structures that allow for higher pay at the front end of teachers’ careers.
3. State policymakers could make it easier for high-poverty districts to raise starting pay by loosening spending restrictions. Ohio puts restrictions on how districts can spend on a couple pots of state funds: Student Wellness and Success Funding—a specific element within the core “base amount” that districts receive—as well as Disadvantaged Pupil Impact Aid, a categorical “add-on” that drives additional dollars to high-poverty districts. The limits make some sense, but they also compel districts to spend dollars on certain activities and programs—e.g., mental health services, tutoring, and other supports—and not teacher salaries. Lawmakers could relax these constraints and allow districts to use these funds to raise teacher pay. This could enable high-poverty districts, especially, to boost starting salaries, as they receive more through these elements than their wealthier counterparts.
Entry-level pay is just the beginning. How quickly pay increases is also key in districts’ ability to retain effective teachers. Stay tuned for a follow-up post that looks at how districts compensate their early-career teachers.
As school systems around the world continue trying to recover from learning losses caused by the pandemic, a new paper out of Germany gives us some historic context on what to look for and what to be wary of.
Researcher Kamila Cygan-Rehm from the Dresden University of Technology exploits a natural experiment that occurred when two school years were shortened in several West German states in the late 1960s. These were the result of a realignment of school start dates following several previous shifts during and immediately after World War II. Specifically, the two school years that ran from April to November 1966 and from December 1966 to July 1967 were each truncated by about one-third in order to ultimately move all schools’ starting dates from spring to fall. This shortened the amount of schooling received by all children attending school in ten states—excluding Bavaria, Hamburg, and Lower Saxony, which made the switch in other ways.
Although accommodations for the decreased instructional time varied from state to state, Cygan-Rehm notes important similarities. Emphasis was placed on maintaining the core curriculum, with priority given to mathematics, German, and modern foreign languages (mainly English). The weekly hours of instruction in these subjects increased when compared to a typical school year, as did the homework load. Consequently, instructional hours in non-core subjects like music, arts, and physical education were reduced. Extracurricular activities were not traditionally part of the school day, but certain annual school-based events like Christmas pageants and school trips—all of which took time away from instruction—were canceled until the new start dates were achieved. Many states also reduced the number of in-class tests and the requirements for final examinations to make up for the loss of instructional time. This effort, we are told, resulted at the time in massive outpourings of concern from academics, families, government, and media over the potential loss of student learning. However, short-term outcomes for students were not seen to be substantially negative, and thus no other remediation was taken when school years returned to the normal length. Yet students who graduated in either of those years did so having lost up to two-thirds of a year of instructional time.
This recent analysis, like those conducted in the 1960s, sees minimal short-term impact. Graduation and university enrollment did not change significantly in affected states from pre-1966/67 rates. Long-term outcomes, however, are a different story. Cygan-Rehm uses data from the Sample of Integrated Labor Market Biographies, a rich database of German employment data, as well as pension records, to identify over 278,000 individuals who were of compulsory school age during the 1966–1967 timeframe in the various states and whose work and earnings history are complete through 2017. While she cannot definitively state that her sample includes only workers who experienced shortened school years, she uses the same data from two of the unaffected states as a comparison and robustness check. As a result, she is satisfied that she has captured a large swath of impacted former students.
Her analysis finds that exposure to the shortened school years led to adverse labor market effects over almost the entirety of an individual’s working life. She estimates that one year of lost classroom instruction reduced lifetime earnings by almost 3 percent on average. The earnings losses were partly driven by higher rates of unemployment among affected individuals during the prime working ages (a 2 percent reduction in days worked) and partly by lower intelligence levels (yes, cognitive test scores were included in the data!) for individuals who ultimately received less instruction than their peers before and after the calendar changes. All this despite the fact that many students who experienced the shortened school years ended up graduating earlier in the year than they would have normally and actually experienced an initial earnings bump based on early entry into the workforce. The negative impacts of lost learning on lifetime income took hold shortly after that bump and persisted until retirement. The youngest and oldest students were impacted more strongly than those in the middle of the grade-level distribution. The largest earnings losses occurred at the bottom of the earnings distribution, suggesting that academically-disadvantaged students, already struggling while receiving a full year’s worth of instruction, fell even further behind in the shortened years.
What should we take from these historical data? Despite clear differences in context and setting, the West German example shares some obvious similarities to our current Covid-disrupted era: closed schools being replaced with a form of “remote learning” (extra homework), loss of instructional time being compensated for by narrowing the curriculum, and impacted students being given dispensation on work completion and assessment. All of these combined to lower the academic bar for students who moved on through the system with no accountability beyond the dates on the calendar. However, it is important to note one vital distinction: No remediation was provided for West German students in the 1960s. We know better now—and these new data show the dangers clearly—and we should expect better results. For those impacted students who remain in school today, we know what needs to be done to help avoid a repeat of history. And our schools still have time to do it.
Thanks to the leadership of Governor DeWine, Lieutenant Governor Husted, and the Ohio General Assembly, high-performing public charter schools have in recent years received additional dollars through the Quality Community School Support Fund. These funds were designed to help narrow longstanding charter funding gaps that have made it difficult for quality charters to recruit and retain talented teachers and have stymied their ability to expand and serve more students.
Now in its sixth year, we at Fordham sought to examine whether the program has made a difference. Have the funding enhancements worked as intended—helping to strengthen charter schools’ instructional staff and improving student learning? Or has the program fallen short?
Join us at the Columbus Athletic Club to hear research findings from Stéphane Lavertu, Senior Research Fellow for the Thomas B. Fordham Institute and professor at The Ohio State University. In conjunction with the release of a forthcoming report, Dr. Lavertu will present his analysis about the impacts of the Quality Community School Support Fund. A panel discussion—panelists to be announced soon--and audience Q&A will follow the presentation.
Presenter
Dr. Stéphane Lavertu
Senior Research Fellow, Thomas B. Fordham Institute
Moderator
Chad L. Aldis
Vice President for Ohio Policy, Thomas B. Fordham Institute
Panelists
Anthony Gatto
Executive Director, Arts and College Preparatory Academy (ACPA)
Ciji Pittman
Superintendent, KIPP:Columbus
Charles Bull
Deputy Superintendent, Dayton Early College Academy (DECA)