Ohioans now have access to a brand-new set of school report cards based on results from the 2023–24 school year. The data they contain provide policymakers, advocates, and families with an updated look on how students are progressing academically in the wake of the pandemic. They also offer a closer look at some important non-academic measures—like chronic absenteeism, which skyrocketed during the pandemic and has remained persistently high.
For policymakers and advocates, report cards offer a wealth of information. But for parents and families, it might feel like too much of a good thing and, thus, overwhelming. The big takeaways—like overall ratings for districts and schools, graduation rates, and the percentage of students who are proficient on state exams—are typically front and center in media coverage. That’s understandable, given that they’re traditional and easily understood metrics. But there are also several other measures that, while not on the radar of major media, are exactly the kind of information that families want and need when making schooling decisions. Let’s take a look at three.
Improving K–3 literacy
Last year, Ohio policymakers established a statewide initiative aimed at ensuring that schools align their instruction with the science of reading, an evidence-based instructional approach that focuses on phonics and knowledge-building. Going forward, the early literacy component on state report cards will be a crucial part of monitoring the progress of this initiative. And of the component’s three graded measures, student proficiency—how many kids are reading proficiently by the end of third grade—will draw the lion’s share of attention. That makes sense, as proficiency numbers allow us to gauge where students stand at the end of third grade. But for families, the “improving K–3 literacy” measure is, arguably, far more important.
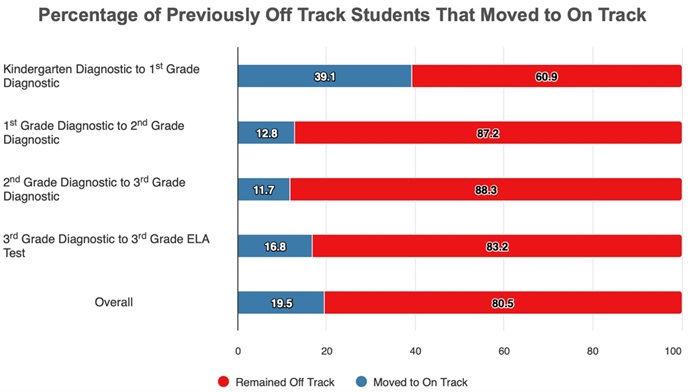
For this indicator, the Department of Education and Workforce (DEW) uses the results of fall diagnostic assessments to determine the percentage of students who move from “not on track” to “on track” in reading from one year to the next. These results indicate how well schools are improving K–3 literacy throughout all the early grades, not just third. And for the parents of young children, knowing whether their child’s school excels or lags behind empowers them to proactively make enrollment decisions or to hold schools accountable for a troubling lack of progress. Here’s what that looks like for Columbus—a picture that indicates plenty of cause for concern.
Image 1: 2023–24 Columbus City Schools results for the improving K–3 literacy measure

Student opportunity profiles
Most families likely haven’t heard of Ohio’s student opportunity profiles, as they weren’t included on report cards until 2023. Available via a district’s or school’s report card homepage, they include metrics in two categories: one for students and one for staff.
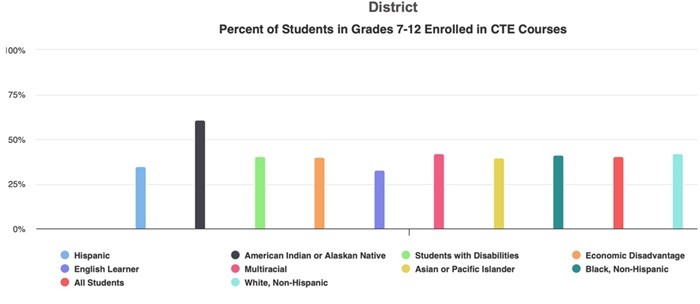
The student-level metrics capture a broad range of activities that “support and enhance” students’ educational and social-emotional development. They are disaggregated by student demographics and grade level and include indicators such as the percentage of students enrolled in CTE, AP, IB, College Credit Plus, or honors courses; how many students participate in co-curricular activities; and how many participate in enrichment or support programs offered by the district outside of the normal school day. Meanwhile, staff metrics offer a look at student-to-staff ratios—not just teachers, but also professionals like nurses, counselors, and social workers—as well as educator experience. Let’s again illustrate how this looks for Columbus.
Image 2: 2023–24 CTE course enrollment according to Columbus City Schools student opportunity profile

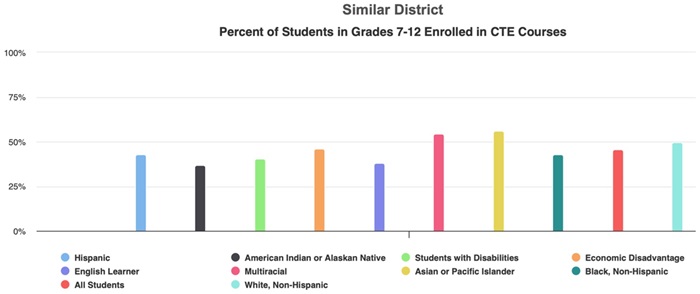
What makes these profiles particularly unique is that, in addition to reporting the data, they also provide comparisons to similar districts and the state. For example, according to the student opportunity profile for Columbus City Schools, the district has a higher percentage of students participating in co-curricular activities (91.3 percent) than similar districts (82.6 percent) and the state (83.3 percent), but a lower percentage of students participating in enrichment offered by the district outside school hours (5.9 percent) compared to similar districts (13.1 percent) and the state (18.2 percent). A larger percentage of teachers and principals in Columbus have fewer than three years of experience compared to peer districts and Ohio as a whole. But Columbus has smaller staff-to-student ratios in a variety of non-teaching areas, including school nurses, counselors, and librarians. By offering these comparisons, the profiles provide important context to families and taxpayers that could shape enrollment decisions (for families) and voting choices (for taxpayers considering school board elections or levies).
Image 3: 2023–24 CTE course enrollment in similar districts according to Columbus City Schools student opportunity profile

Special education profiles
The Individuals with Disabilities Education Act (IDEA) is a federal law that provides civil rights protections to students with disabilities, including the right to a free appropriate public education tailored to their individual needs. IDEA includes a series of indicators that measure services and outcomes. Each year, DEW uses these indicators to create special education profiles for districts that show their progress over time in meeting state goals for students with disabilities. As is the case with student opportunity profiles, links to special education profiles are available on the report card homepage for every district and charter school.
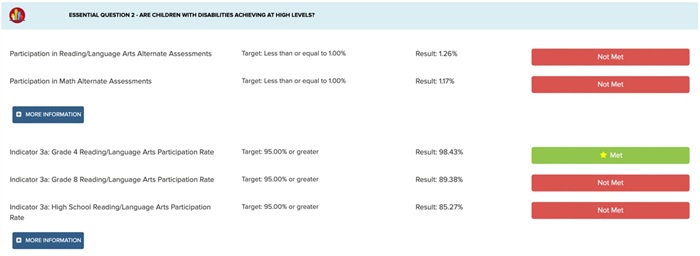
Image 4: 2023–24* special education profile for Columbus City Schools

The profiles organize IDEA indicators into categories based on six essential questions, which are listed below. For each indicator, the profile identifies the district’s target goal, its result, and whether the indicator is considered met, not met, or not counted. The “more information” button provides an in-depth description of each indicator, as well as targets and results for the last five school years, which can be used to identify trends.
- Are young children with disabilities entering kindergarten ready to learn?
- Are children with disabilities achieving at high levels?
- To what extent do students with disabilities have access to the general education environment?
- Are youth with disabilities prepared for life, work, and postsecondary education?
- Does the district implement IDEA to improve services and results for children with disabilities?
- Are children receiving equitable services and support?
***
State report cards are a crucial resource. In some states, report card frameworks do the bare minimum required by federal law, which limits their usefulness. But Ohioans have access to detailed data that go above and beyond federal requirements. The state’s “improving K–3 literacy” measure, as well as its district-specific profiles for student opportunity and special education, offer families and taxpayers invaluable information that can help them make important decisions for their children.


