Mobile Navigation

  • National
    • Policy
      • High Expectations
      • Quality Choices
      • Personalized Pathways
    • Research
    • Commentary
      • Gadfly Newsletter
      • Flypaper Blog
    • Events
    • Scholars Program
  • Ohio
    • Policy
      • Priorities
      • Media & Testimony
    • Research
    • Commentary
      • Ohio Education Gadfly Biweekly
      • Ohio Gadfly Daily
  • Charter Authorizing
    • Application
    • Sponsored Schools
    • Resources
  • About
    • Mission
    • Board
    • Staff
    • Career
Home
Home
Advancing Educational Excellence

Main Navigation

  • National
  • Ohio
  • Charter Authorizing
  • About

Ohio Menu

  • Topics
    • Accountability & Testing
    • Advanced Education
    • Career & Technical Education
    • Charter Schools
    • Curriculum & Instruction
    • ESSA
    • Evidence-Based Learning
    • Governance
    • Personalized Learning
    • Private School Choice
    • School Finance
    • Standards
    • Teachers & School Leaders
  • Research
  • Policy
  • Commentary
    • Ohio Gadfly Newsletter
    • Ohio Gadfly Blog
    • Events

The Education Gadfly Weekly

Sign Up to Receive Fordham Updates

We'll send you quality research, commentary, analysis, and news on the education issues you care about.
Thank you for signing up!
Please check your email to confirm the subscription.

Ohio Gadfly—State report cards offer good news and bad news

Volume 20, Number 19
9.21.2026
9.21.2026

Ohio Gadfly—State report cards offer good news and bad news

Volume 20, Number 19
view
Early literacy progress on report cards blog image
Standards & Accountability

State report cards offer good news and bad news in reading

Consistent, rigorous implementation of the science of reading should produce literacy achievement gains. State report cards for the 2025–26 school year, which were released last week, reveal both good news and bad news on this front for Ohio.

Jessica Poiner 9.21.2026
OhioOhio Gadfly Daily

State report cards offer good news and bad news in reading

Jessica Poiner
9.21.2026
Ohio Gadfly Daily

Will Ohio ever make a full academic recovery?

Aaron Churchill
9.22.2026
Ohio Gadfly Daily

Ohio takes a big step forward in tracking students’ workforce outcomes

Jessica Poiner
9.16.2026
Ohio Gadfly Daily

Examining charter school contract renewal length decisions by authorizers

Jeff Murray
9.22.2026
Ohio Gadfly Daily

The false Columbus promise

Vladimir Kogan
6.9.2026
Ohio Gadfly Daily
view
Ohio academic recovery blog image

Will Ohio ever make a full academic recovery?

Aaron Churchill 9.22.2026
Ohio Gadfly Daily
view
Ohio's outcomes dashboards blog image

Ohio takes a big step forward in tracking students’ workforce outcomes

Jessica Poiner 9.16.2026
Ohio Gadfly Daily
view
Charter renewal term length report SR image

Examining charter school contract renewal length decisions by authorizers

Jeff Murray 9.22.2026
Ohio Gadfly Daily
view
Kogan Columbus Promise blog image

The false Columbus promise

Vladimir Kogan 6.9.2026
Ohio Gadfly Daily
view
Early literacy progress on report cards blog image

State report cards offer good news and bad news in reading

Jessica Poiner
9.21.2026
Ohio Gadfly Daily

Three years ago, Ohio policymakers established a statewide science of reading initiative aimed at boosting reading achievement. The sweeping effort requires public schools to use state-approved high-quality instructional materials (HQIM), expects teachers and administrators to complete professional development, provides reading coaches for school-based support, and audits educator preparation programs to ensure future teachers are well-trained. To bolster implementation, regionally based instructional implementation teams will soon conduct mandatory reviews of low-performing schools and offer their services to any school seeking an independent review.

Consistent, rigorous implementation of these policies should produce reading achievement gains. State report cards for the 2025–26 school year, which were released last week, offer the latest look at Ohio’s progress. The results reveal both good and bad news.

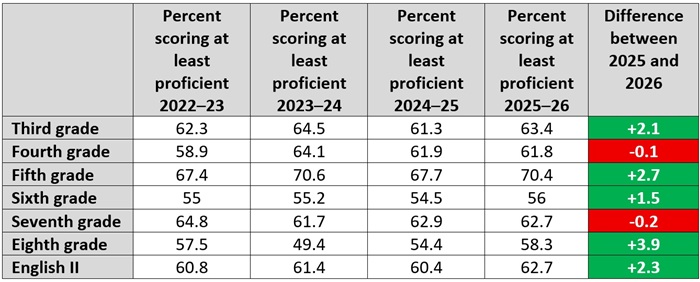
First, the good news: Statewide proficiency numbers are creeping upward. Table 1 shows the number of students who scored proficient or above on the state’s English language arts (ELA) exams during the last four school years. The final column identifies the difference between 2025 and 2026 results, with green shading indicating improvement and red indicating a decline. In most grade levels, proficiency rose by roughly 2 percentage points. The improvement in third grade is noteworthy, as those students have been at the center of Ohio’s science of reading effort. Eighth grade saw the highest jump, with an increase of almost 4 percentage points. Meanwhile, although fourth and seventh grade results both inched backward, the decline was small.  

Table 1. Percentage of students scoring at least proficient on English language arts state tests

Early literacy progress on report cards blog Table 1

The overall state report card trumpets similar progress. Proficiency numbers in ELA were up in every single demographic, including economically disadvantaged students (+2.7), students with disabilities (+1.2), English learners (+1.2), Black students (+3.4), and Hispanic students (+3.5). These aren’t monstrous gains, but they do reflect improvement. Remember, Rome wasn’t built in a day. Two years into full implementation of a complex statewide effort, these scores are a positive sign. If Ohio schools continue faithfully implementing the science of reading, we should continue to see higher achievement.

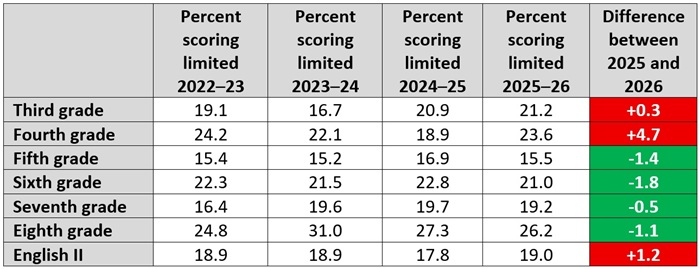
Unfortunately, there’s also some bad news. Although more students reached proficiency in 2026, at least one-fifth of students in nearly every grade level scored in the lowest category, or “limited.” Moreover, in three grades, the percentage of students who scored limited actually went up from last year. 

Table 2 identifies the percentage of students in grades 3–8 and high school who scored limited during the last four school years. The final column identifies the difference between 2025 and 2026 results, with green shading indicating improvement (fewer students scoring limited) and red shading indicating a regression (more students scoring limited).

Table 2. Percentage of students scoring limited on English language arts state tests

Early literacy progress on report cards blog Table 2

An increase in the number of “limited” students is never good, as scoring in the lowest category is a clear sign that students are falling behind. But it’s worrisome that two of the three grades that saw increases are third and fourth—students at the tail end of elementary school, where most of Ohio’s reading improvement efforts are focused. It’s especially worrisome that the jump in fourth grade is nearly 5 percentage points. That increase brings the number of Ohio fourth graders scoring limited to nearly 24 percent, or one-fourth. In raw numbers, that’s over 29,000 fourth graders who scored at the lowest level.

What makes these results particularly disheartening is the fact that they could have been avoided. Under the Third Grade Reading Guarantee, Ohio schools were required (with limited exceptions) to hold back third graders who fell short of a state-defined “promotional score” on the state’s reading exam or an alternative test. Students who were retained under this provision were required to receive intensive intervention from their schools to help them catch up to their peers. Between 2016 and 2019, when the retention provision of the Guarantee was in place, the percentage of students who scored “limited” declined from 27 percent to 14 percent. According to my colleague Aaron Churchill, this “substantial decline in struggling readers suggests that retention—and the accountability it provided—increased schools’ sense of urgency and obligation to help children meet state reading targets to avoid holding them back.” Moreover, a rigorous analysis from the Ohio Education Research Center showed that retained students scored significantly higher on state exams into middle school than their peers who narrowly met the state’s promotional threshold in third grade.

The upshot? Retention decreased the percentage of students who scored limited and benefited retained students in the long run. However, despite this evidence—and additional proof showing that retention worked in other states, too—Ohio lawmakers gutted the policy in 2023. Three years later, despite concentrated efforts to boost early literacy outcomes, the share of students scoring limited among third and fourth graders is rising.   

The latest round of state report cards indicates that Ohio is making progress with the science of reading. But there are also warning signs that must be heeded if we’re going to move the needle. We have clear evidence that students performed better when Ohio had a retention policy in place. If state leaders truly believe that boosting reading achievement is imperative, then it’s time to bring back retention.

view
Ohio academic recovery blog image

Will Ohio ever make a full academic recovery?

Aaron Churchill
9.22.2026
Ohio Gadfly Daily

In 2023, we at Fordham released a publication titled Will Ohio’s Covid Generation Get Back on Track? The report documented the pandemic-era plunge in academic performance reflected in the 2021–22 state test scores and urged an all-hands-on-deck recovery effort. With four Covid-free years now on the books and billions upon billions spent, one might think that Ohio has surely recovered from the pandemic wreckage.

But has it recovered? Based on the just-released assessment results from 2025–26, the answer regrettably remains “no” (it was “nein” last year, too). It’s true: Ohio students still have not caught up to the achievement marks of their pre-pandemic peers.

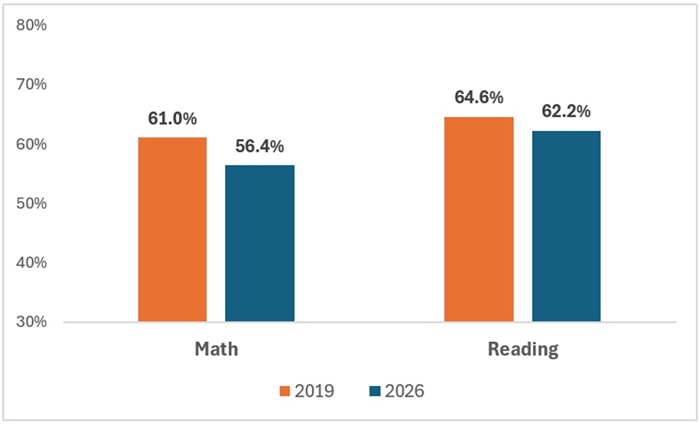
Here are the unsettling data. Figure 1 begins with a basic comparison of statewide math and reading proficiency rates in 2018–19—the pre-pandemic baseline—and 2025–26. Just prior to the pandemic, 61 and 65 percent of Ohio students achieved proficiency in math and reading, respectively. Last year’s proficiency rates fell short of that benchmark, in math by a sizable margin of 4.6 percentage points and 2.4 percentage points in reading.

Figure 1. Statewide math and reading proficiency rates (all tested grades), 2018–19 versus 2025–26

Ohio academic recovery blog figure 1

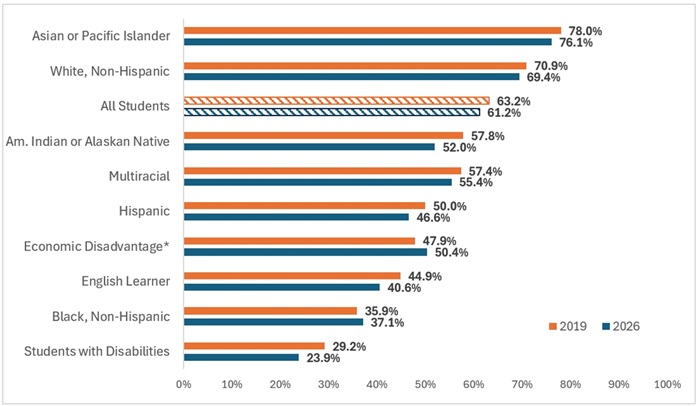
One major concern in the wake of the pandemic was that disadvantaged students would have the hardest time catching up—what some dubbed the “K-shaped” recovery. The next figure explores whether this has materialized in Ohio. Figure 2 shows statewide proficiency rates (math and reading combined)[1] and indicates sluggish recovery across the board. Virtually all student groups continue to fall short of their respective pre-pandemic benchmarks, though students with disabilities have struggled noticeably more than others to meet their pre-pandemic benchmark. In contrast, Black students have demonstrated somewhat stronger recovery and their 2025–26 proficiency rates slightly top their respective pre-pandemic rates. Economically disadvantaged students’ proficiency also exceeds their pre-pandemic target, though that result is highly suspect due to the rapid compositional change within that group (see note below the figure).

Figure 2. Proficiency rates by student group on all state exams, 2019 and 2026

Ohio academic recovery blog figure 2
Note: (*) Due to the Community Eligibility Provision, many schools may report higher-income students as “economically disadvantaged,” which has in turn inflated these rates. In 2019, Ohio reported 50 percent of students as economically disadvantaged, while in 2026, Ohio reported 63 percent of students as disadvantaged (many of whom were not actually low-income). 

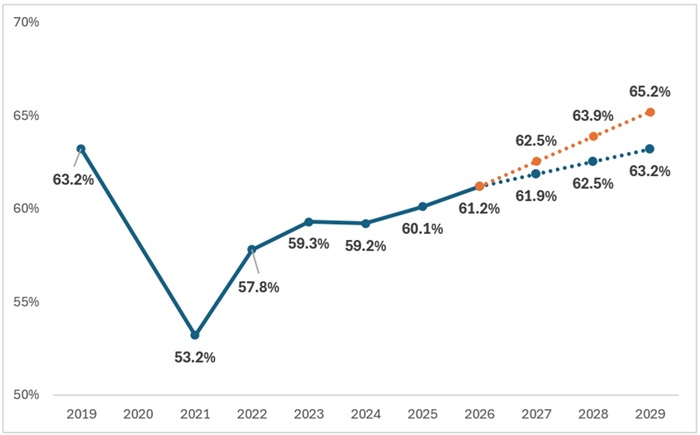
Figure 3 displays statewide proficiency rates (all tests) from 2019 to 2026 as well as projections based on the current rate of improvement. After significant jumps in proficiency shortly after scores bottomed out in 2020–21, the rate of improvement slowed, with a gain of just 2.1 percentage points over the past four years. At this rate of improvement, Ohio won’t return to the pre-pandemic mark until 2028–29—a full decade after the pandemic struck. If Ohio can step up the rate of improvement (double it), students would make it back to square one a year earlier.  

Figure 3. Trend in statewide proficiency rates, all state exams

Ohio academic recovery blog figure 3
Note: The blue dotted line displays projected proficiency rates if Ohio maintained its current rate of improvement (based on the average annual rate of improvement over the past three years, or 0.67 percentage points). The orange dotted line displays the trajectory if Ohio doubled its current rate of improvement.

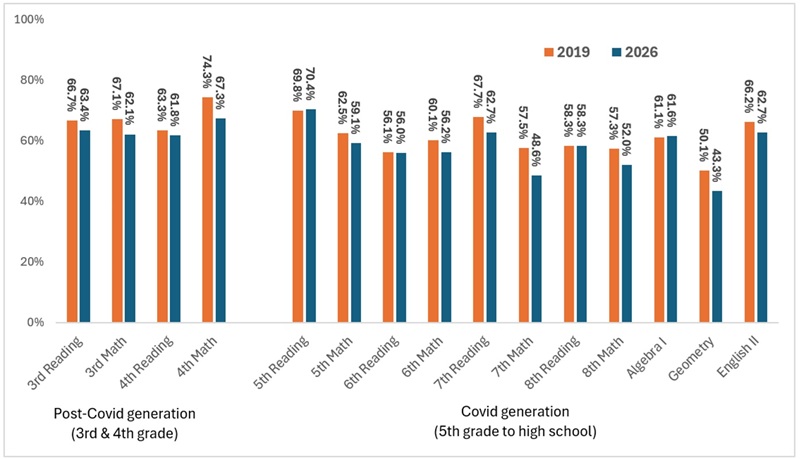
Finally, Figure 4 shows proficiency rates by grade level, an important aspect of tracking recovery. Students in the early elementary grades during 2025–26 were infants and toddlers during Covid, and one would expect “post-Covid generation” scores to more closely track with the 2018–19 benchmarks. But as the figure indicates, third and fourth grade proficiency rates sank noticeably below pre-pandemic standards. Meanwhile, the higher grades represent students who were directly impacted by school disruptions during the pandemic. Here, we see recovery in fifth, sixth, and eighth grade reading as well as algebra I, but proficiency rates still lag for seven other grade-subject assessments. Overall, these data indicate significant work still ahead to help both the post-Covid and Covid generations catch up to Ohio’s historical achievement marks.    

Figure 4. Statewide proficiency rates by grade and subject, 2019 and 2026

Ohio academic recovery blog figure 4

* * *

Outwardly, schools have returned to normalcy. But the long shadow of Covid continues to be felt inside of Ohio classrooms. Students today—due to the closures and the anemic recovery—are still behind in comparison to where their peers stood six years ago. Can Ohio make a full academic recovery? When will it finally happen—and for all student groups, in both math and reading, and across all grades?

To their credit, Ohio policymakers have established critical academic initiatives that, if rigorously implemented, should move the needle faster for students. It’ll take continuing resolve from state and local leaders to put the pandemic—and all its ill effects—behind us once and for all.


[1] It also includes grade 5 and 8 science and the biology, U.S. government, and American history end-of-course exams.

view
Ohio's outcomes dashboards blog image

Ohio takes a big step forward in tracking students’ workforce outcomes

Jessica Poiner
9.16.2026
Ohio Gadfly Daily

Last month, the Ohio Department of Education and Workforce (DEW) unveiled a pair of brand-new resources that provide a snapshot of education and workforce outcomes for the state’s graduates. The dashboards, which were developed via a partnership among several groups[1], connect three primary data sources: the Education Management Information System (public and private high school graduation records), the National Student Clearinghouse (enrollment and graduation records for two-year, four-year, public and private colleges in Ohio), and state unemployment insurance wage records. Users can examine these data at a variety of levels, including the state, JobsOhio region, district, school, and Career-Technical Planning District (CTPD).

The goal of this effort is to shine a light on real-world results. In a media release, DEW Director Stephen Dackin noted that the dashboards provide a “new level of insight” that can help students and families plan for the future. The data can also support schools in their efforts to identify areas of success and areas for improvement, and empower advocates and researchers to track student outcomes into the workforce.

To get a clearer picture of what these resources offer, let’s take a closer look at each.

Ohio high school outcomes

This dashboard examines post-high school outcomes for the classes of 2018 through 2023. Cohorts are based on students’ expected year of graduation, which is determined by the year they first enter ninth grade. Outcomes include educational attainment, combined education and workforce status, college enrollment and completion, in-state employment, and earnings.[2]

For families deciding where to send their kids to school, this dashboard can be a helpful supplement to district and school report cards. It examines different data than the state’s College, Career, Workforce, and Military Readiness component and provides a clearer picture of real-world outcomes like college degree attainment and wages that complements school-based measures like passing AP exams or doing well on the ACT.

It also offers plenty of information for advocates and policymakers. In fact, here are a few key data points from Ohio’s class of 2018, which has six full years of postsecondary data available: 

  • Six years after graduation, the highest educational attainment for nearly one-third (32 percent) of students was a high school diploma. More than one-fourth (28 percent) earned a bachelor’s degree. Another 4 percent earned an associate degree. The “some college” group—students who enrolled in college at some point after high school—includes those who were still enrolled (just under 6 percent) and those who discontinued their studies without earning a degree (more than 19 percent). The remaining 10 percent dropped out of high school without earning a diploma.

  • Six years after graduation, median annual earnings (in 2024 dollars) for students who obtained an associate degree or higher were nearly $48,000. For students with no college degree, median annual earnings clocked in at just over $31,000.

  • The percent of 2018 high school graduates employed in Ohio declined from 85 percent in 2019 to 77 percent in 2024.

Ohio career technical education outcomes

This dashboard focuses on CTE concentrators, or students who have completed at least two courses in a single CTE program. It examines three primary outcomes: earnings, in-state employment, and college enrollment and attainment. Just like with high school outcomes, the CTE dashboard focuses on graduation cohorts 2018 through 2023. Unlike the high school resource, however, users can’t access statewide or regional data—to examine CTE outcomes, they must select a specific CTPD and a specific CTE program.

It’s important to recognize that drilling down to specific CTPDs and programs can be incredibly helpful for students and families. For example, let’s say Jane is a student who lives in Hamilton County. Her district works with the Great Oaks Career Campuses to provide CTE programming. She’s interested in becoming an automotive service technician, which is part of the Ground Transportation pathway. But Jane’s mom is worried. Will her daughter be able to find work in Ohio? How much money can she expect to make? The CTE outcomes dashboard not only answers those questions, it provides data specifically tied to Great Oaks. The dashboard, for instance, shows that within six years of graduation, 84 percent of Ground Transportation concentrators from Great Oaks were working in Ohio. It also shows that during those six years, wages steadily climbed. Within six years of earning a diploma, median annual earnings clocked in at nearly $42,000. Concentrators in the 75th percentile made over $56,000. Thanks to these data, Jane and her mom can have a productive conversation about her future plans.

Alternatively, consider Joe, who lives in Berea, Ohio. Joe attends the Polaris Career Center, where he’s well on his way to becoming a Certified Nursing Assistant. He’s trying to decide whether he should pursue postsecondary education after graduation (perhaps to become a registered nurse) or stick with his certificate and go straight into the workforce. When he uses the state’s dashboard to pull up the Polaris Career Center and choose Allied Health and Nursing on the dropdown menu, he notices that median earnings are much higher for students who attain at least an associate degree compared to those who don’t. In fact, five years after graduation, those with a degree earn a median wage of $49,865 compared to just $27,071 for those who don’t earn a degree. Six years after graduation, degree-holders earn more than double their peers who don’t have a degree. Armed with these data, Joe will be able to make a much more informed decision about his future.

***

These new dashboards are a welcome addition to Ohio’s transparency efforts. They have the potential to serve a wide range of stakeholders, from district and school leaders looking to build on what works to policymakers eager to make data-driven decisions. Most importantly, though, this effort puts detailed and accurate information straight into the hands of students, who can use it to make informed decisions about their future. Ohio kids and families deserve to be well-informed. These resources help make that happen.


[1] The groups are DEW, the Ohio Department of Job and Family Services, InnovateOhio, and the Ohio Education Research Center at the Ohio State University.

[2] Employment and earnings measures are currently limited to Ohio employers covered by the state’s unemployment insurance program.

view
Charter renewal term length report SR image

Examining charter school contract renewal length decisions by authorizers

Jeff Murray
9.22.2026
Ohio Gadfly Daily

A defining feature of charter schools is the oversight structure provided by the authorizer. It is an authorizer’s job to determine whether schools are fulfilling the terms of their charters across numerous areas, not least of which is student outcomes. Contract renewal time is when those determinations matter most. Has a school earned the right to continue operating and for how long? While the typical charter renewal term is five years, most states give authorizers the discretion to offer longer or shorter terms if circumstances warrant. A new report looks at renewal term length decisions in four of those states, aiming to see how authorizers use that discretion and what impacts they associate with different term lengths.

The National Association of Charter School Authorizers (NACSA) surveyed 39 authorizers across Colorado, Florida, Indiana, and Michigan, all of whom had at least five charter schools in their portfolios. The survey asked respondents about all the renewal term lengths they grant and the reasons for granting different lengths. Twenty-six of those authorizers also agreed to participate in focus groups which delved into more depth on their survey responses and added an additional dimension: What effects—intended and unobserved—do authorizers associate with different term lengths.

Across all four states, five years was the most common renewal length. Respondents said that a five-year term provides them with enough data to make sound decisions and provides schools sufficient time to achieve any needed operational stability required by authorizers.

Longer-term renewals (anything more than five years) were rare, respondents said—typically reserved for schools with sustained strong performance across academics, finances, and governance. But they do have their upsides when granted, including reduced administrative burden for both authorizers and school staff, as well as incentivizing more favorable facility financing opportunities for schools with longer-term charters. On the downside, however, respondents reported that some schools declined in performance after receiving long-term renewals, with fewer intervention tools then available to authorizers.

Shorter-term renewals (anything less than five years) were most commonly reported in response to academic underperformance, financial distress, or governance problems. Authorizers intend them as leverage—a way to force change with new contract/accountability requirements or to signal that a school’s continued operation is conditional upon specific improvements. However, respondents provided little evidence that short-term renewals actually improved school performance. Repeated short-term renewals, respondents said, could also accelerate staff turnover, hasten enrollment declines, and do reputational harm to schools.

Interestingly, while five-year terms continue to function as the sector default and are deemed appropriate for most schools that are meeting expectations, they still generated concerns from some respondents. Having all or even most schools in a portfolio on similar terms creates clusters of renewals every year, resulting in a significant and ongoing administrative burden for authorizers that staggered/non-standard terms could alleviate. Additionally, any states that don’t allow shorter renewal terms lump both adequate and problematic charter schools into the same category; and any states that don’t allow longer renewal terms lump both adequate and exceptional schools together. Both situations, authorizers say, remove the quality signals that varying term lengths are meant to convey.

While these findings come from a limited, nonrepresentative sample of authorizers—those willing to speak on the subject—NACSA’s recommendations on renewal term length nonetheless reflect much of the insight they provide. To wit: The length of charter renewal terms should be determined through a deliberate, performance-based process, and not by default or tradition.

Long-term renewals should be reserved for schools demonstrating sustained excellence across all performance areas, and their contracts should include robust monitoring systems to detect declines in performance as well as actionable accountability structures if a decline occurs mid-cycle. Short-term renewals should be used sparingly—with “clear conditions and consequences”—and never as cover to kick painful closure decisions down the road a year or two. Finally, the report encourages charter supporters to band together to support state policies (or support implementation of new policies if they don’t already exist) that minimize “authorizer shopping,” the process whereby schools can easily switch authorizers if they don’t like, for example, the term length being offered.

SOURCE: National Association of Charter School Authorizers, “Charter Renewal Term Length Project” (August 2026).

view
Kogan Columbus Promise blog image

The false Columbus promise

Vladimir Kogan
6.9.2026
Ohio Gadfly Daily

Columbus State Community College graduated its largest ever class last month—including the most Columbus Promise students since the program to provide local students six semesters of free tuition and a modest stipend started in 2022, the college noted in a triumphant press release.

But the same figures also tell a more pessimistic story. The Columbus State class of 2026 included just 57 Columbus Promise participants. This brought the total number of students who completed the program over the first four years to only about 430. Over the same period, Columbus City Schools—the only school district whose students are eligible to participate—awarded approximately 10,000 high school diplomas.

This means that only about 5 percent of eligible Columbus high school graduates have gone on to earn an associate degree or certificate through Columbus Promise, and many of those who did would have almost certainly received a college degree anyway. Despite millions of dollars in spending, the program has barely moved the needle on helping students attain higher education and economic opportunity.

The numbers matter because Columbus Promise has taken on new political significance in recent months. Its chief architect, Columbus City Council President Shannon Hardin, has made no secret of his plans to challenge incumbent Mayor Andrew Ginther in next year’s election. Hardin has touted the Columbus Promise as one of his signature legislative achievements and one of the few points of contrast with the incumbent mayor, who attempted to defund the program in his proposed budget for next year. (During its first three years, the cost of the program was split roughly evenly between the city and private donors.)

Despite its centrality in the campaign, no one has seriously examined the actual educational impact of Columbus Promise. An honest assessment would show that the program probably did help a small number of students—while also doing harm to many others.

For many participants, the Columbus Promise has meant enrollment in courses they ultimately ended up failing and likely delayed their entry into the labor force. Others were diverted from better-resourced, higher-quality four-year programs—precisely the kinds of institutions that research shows help disadvantaged and low-income students succeed.

In short, it is far from obvious that the Columbus Promise has been a net positive for most affected Columbus students.

A flawed evaluation

This gloomy verdict may surprise many readers who have followed the discussion about Columbus Promise and hundreds of similar efforts around the country or those familiar with an evaluation of the program released by the Michigan-based Upjohn Institute last spring.

“The Columbus Promise has dramatically increased the number of Columbus City Schools (CCS) students attending Columbus State Community College (CSCC),” the report began, “and expanded access for students who may otherwise not have enrolled in college at any institution.”

This language—with its focus on attendance (rather than completion) and use of a tentative verb (may)—was intentional.

The Upjohn analysis focused on one question: comparing the performance of students attending Columbus State under the program to earlier cohorts who had to fund their own tuition. 

To account for the fact that the more recent, larger Columbus State cohorts include more disadvantaged, lower-achieving students who enrolled only because of the Columbus Promise, the report carries out statistical “adjustments” to provide a more apples-to-apples analysis. Such adjustments, while useful for making over-time comparisons, are misleading for current students trying to understand their own likelihood of success at Columbus State.

The analysis, in other words, focused on tracking relative performance across different cohorts, not highlighting shockingly low absolute levels of achievement and completion seen among all students. While interesting to academic researchers, this question is of little relevance to students, families, and the funders ultimately footing the program’s bill.

For families, the real question is whether high school graduates who would’ve otherwise skipped higher education were made better off by attending Columbus State for free. Although not the focus of the Upjohn report, the data in it suggest that the answer for nearly all such Columbus high school graduates is “no.”

The reason is that 90 percent of students who begin Columbus State through the Columbus Promise don’t end up completing a certificate or an associate degree.[1] For all but a small handful of participants, community college enrollment doesn’t lead to new credentials.

About half of all Columbus Promise students drop out during or after their first year of community college. Even a single wasted year can have career consequences if it means delaying these students’ entry into workforce because it represents forgone earnings and time they could’ve spent building valuable work experience and seniority instead.[2]

To be sure, a small number of students—approximately 40 per year, based on the first cohort—successfully earned Columbus State certificates and associate degrees they would not have otherwise attempted, and some of them may go on to earn a bachelor’s, too. But a roughly similar number would have attended a four-year university instead.[3] These students were lured to Columbus State by the promise of free tuition, and several careful economics studies suggest that they were likely made worse off in the long run.

Reasonable people can disagree about how to weigh these offsetting impacts, but the bottom line is that typical Promise participants obtain no measurable educational benefits from the time they enter the program.

For policymakers, the main question is about return on investment of a different kind. The first three years of the Columbus Promise program cost a reported $9.5 million, with half coming from Columbus taxpayers. Even under the most optimistic assumptions that ignore potential diversion of students who would’ve gone elsewhere, this comes out to nearly $100,000 for each additional Columbus State certificate and associate degree earned,[4] an astronomical cost.

How to better help Columbus students

Acknowledging these issues is the first step to improving the Columbus Promise program to help achieve its original goals. There are three concrete ways to do so.

One simple change is to expand the program to cover tuition at any Ohio public college or university, rather than just Columbus State. This was precisely the design of the original, well-studied college “promise” program in Kalamazoo and explains why it produced much larger effects on both college enrollment and completion. Students who begin their college careers at more selective, four-year universities are far more likely to earn degrees.

This is also the structure of Ohio’s other major free-college program, Say Yes Cleveland, which seems to achieve significantly higher college graduation rates.

A second reform would add academic eligibility requirements, tied to a combination of high school grades and standardized test scores. (Currently, all Columbus high school graduates can participate.) While almost certainly controversial, narrowing eligibility would have three benefits.

First, it would help target Columbus Promise toward students who are likely to complete higher education and avoid pulling those who have almost no prospect of doing so out of the labor force. Second, academic requirements would also increase incentives for students to perform better while in high school, putting them in a better position to succeed in college. Finally, reducing the number of participants would free up money that could be used to increase the $500 per semester stipend students in the program receive on top of their tuition.

The last necessary change—improving the quality of Columbus students’ K-12 education—is the most difficult task. But it is also the most necessary.

The main barrier to higher education for Columbus students is not cost—despite the recent moral panic over student loans—but rather inadequate academic preparation during their public school years. According to the Upjohn analysis, Columbus Promise students attending Columbus State barely clear a D+ average. Among those who drop out without completing a degree, more than a third explicitly cited their poor academic preparation as the reason for leaving the program.

In truth, as currently designed, the Columbus Promise seems more like a program designed to serve the interests of Columbus adults rather than its students.

For city officials, it provides a highly visible credit-claiming opportunity on which to build campaigns for higher office. For school district leaders, it helps boost enrollment and appeal to families considering charter and private school options. (There is a reason why Columbus Promise eligibility is limited only to students graduating from Columbus City Schools.) The program similarly boosts enrollment at Columbus State, the only college students can attend. And for local corporate leaders and other financial benefactors, it creates the impression of supporting Columbus students without having to take on the entrenched school employment interests and dysfunctional systems that stand in the way of academic achievement and economic opportunity.

Columbus students deserve better.

Vladimir Kogan is a senior research fellow at the Thomas B. Fordham Institute and a professor of political science at the Ohio State University. He is the author of the 2025 book No Adult Left Behind: How Politics Hijacks Education Policy and Hurts Kids (Cambridge University Press).



[1] This estimate is based on the first cohort of Columbus Promise students who graduated from high school in 2022, the only group for which completion data are available in the Upjohn Report. However, the cumulative count of Columbus Promise students who have received degrees or certificates, covering the first four cohorts, suggest that completion rates did not increase dramatically in more recent years.

[2] Only 22 percent of students who left the community college without a degree reported that they were working full- or part-time while attending in a survey fielded by the Upjohn researchers, suggesting that enrollment did indeed delay employment for most.

[3] Bizarrely, the Upjohn evaluation claims that “increased enrollment at CSCC is not coming at the expense of the four-year college/university enrollment rate”—hedging the claim with “it appears.” Yet the report’s own data (in Figure 5) suggests otherwise. Before the rollout of the Columbus Promise program, 12 percent of Columbus City Schools high school graduates immediately enrolled in four-year Ohio public universities. In 2022, this fell to 9 percent. Although not large in absolute terms, these numbers imply that one in four students who would’ve otherwise gone directly to a four-year school enrolled in Columbus State instead, similar in magnitude to effects documented by other two-year promise programs.

[4] In the first Columbus Promise cohort, two-thirds of students who completed the program earned a certificate and not an associate degree, according to the Upjohn report.

Fordham Logo

© 2026 The Thomas B. Fordham Institute
Privacy Policy
Usage Agreement

National

P.O. Box 110
Burke, VA 22009

202.223.5452

[email protected]

Ohio

P.O. Box 82291
Columbus, OH 43202

614.223.1580

[email protected]

Sponsorship

130 West Second Street, Suite 410
Dayton, Ohio 45402

937.227.3368

[email protected]