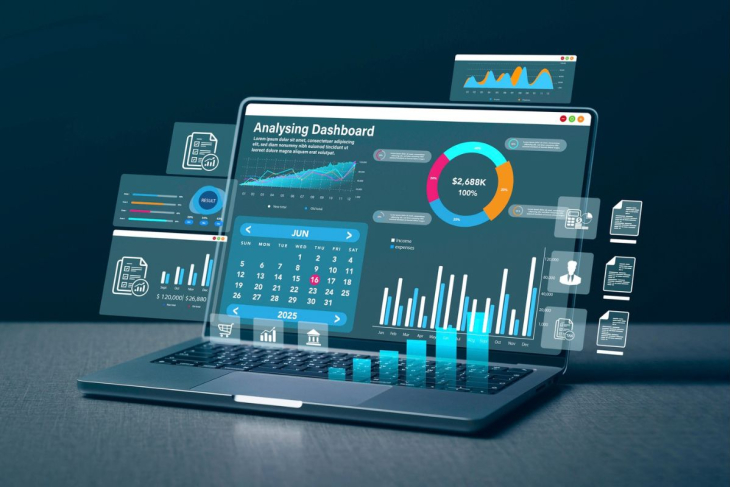
Last month, the Ohio Department of Education and Workforce (DEW) unveiled a pair of brand-new resources that provide a snapshot of education and workforce outcomes for the state’s graduates. The dashboards, which were developed via a partnership among several groups[1], connect three primary data sources: the Education Management Information System (public and private high school graduation records), the National Student Clearinghouse (enrollment and graduation records for two-year, four-year, public and private colleges in Ohio), and state unemployment insurance wage records. Users can examine these data at a variety of levels, including the state, JobsOhio region, district, school, and Career-Technical Planning District (CTPD).
The goal of this effort is to shine a light on real-world results. In a media release, DEW Director Stephen Dackin noted that the dashboards provide a “new level of insight” that can help students and families plan for the future. The data can also support schools in their efforts to identify areas of success and areas for improvement, and empower advocates and researchers to track student outcomes into the workforce.
To get a clearer picture of what these resources offer, let’s take a closer look at each.
Ohio high school outcomes
This dashboard examines post-high school outcomes for the classes of 2018 through 2023. Cohorts are based on students’ expected year of graduation, which is determined by the year they first enter ninth grade. Outcomes include educational attainment, combined education and workforce status, college enrollment and completion, in-state employment, and earnings.[2]
For families deciding where to send their kids to school, this dashboard can be a helpful supplement to district and school report cards. It examines different data than the state’s College, Career, Workforce, and Military Readiness component and provides a clearer picture of real-world outcomes like college degree attainment and wages that complements school-based measures like passing AP exams or doing well on the ACT.
It also offers plenty of information for advocates and policymakers. In fact, here are a few key data points from Ohio’s class of 2018, which has six full years of postsecondary data available:
- Six years after graduation, the highest educational attainment for nearly one-third (32 percent) of students was a high school diploma. More than one-fourth (28 percent) earned a bachelor’s degree. Another 4 percent earned an associate degree. The “some college” group—students who enrolled in college at some point after high school—includes those who were still enrolled (just under 6 percent) and those who discontinued their studies without earning a degree (more than 19 percent). The remaining 10 percent dropped out of high school without earning a diploma.
- Six years after graduation, median annual earnings (in 2024 dollars) for students who obtained an associate degree or higher were nearly $48,000. For students with no college degree, median annual earnings clocked in at just over $31,000.
- The percent of 2018 high school graduates employed in Ohio declined from 85 percent in 2019 to 77 percent in 2024.
Ohio career technical education outcomes
This dashboard focuses on CTE concentrators, or students who have completed at least two courses in a single CTE program. It examines three primary outcomes: earnings, in-state employment, and college enrollment and attainment. Just like with high school outcomes, the CTE dashboard focuses on graduation cohorts 2018 through 2023. Unlike the high school resource, however, users can’t access statewide or regional data—to examine CTE outcomes, they must select a specific CTPD and a specific CTE program.
It’s important to recognize that drilling down to specific CTPDs and programs can be incredibly helpful for students and families. For example, let’s say Jane is a student who lives in Hamilton County. Her district works with the Great Oaks Career Campuses to provide CTE programming. She’s interested in becoming an automotive service technician, which is part of the Ground Transportation pathway. But Jane’s mom is worried. Will her daughter be able to find work in Ohio? How much money can she expect to make? The CTE outcomes dashboard not only answers those questions, it provides data specifically tied to Great Oaks. The dashboard, for instance, shows that within six years of graduation, 84 percent of Ground Transportation concentrators from Great Oaks were working in Ohio. It also shows that during those six years, wages steadily climbed. Within six years of earning a diploma, median annual earnings clocked in at nearly $42,000. Concentrators in the 75th percentile made over $56,000. Thanks to these data, Jane and her mom can have a productive conversation about her future plans.
Alternatively, consider Joe, who lives in Berea, Ohio. Joe attends the Polaris Career Center, where he’s well on his way to becoming a Certified Nursing Assistant. He’s trying to decide whether he should pursue postsecondary education after graduation (perhaps to become a registered nurse) or stick with his certificate and go straight into the workforce. When he uses the state’s dashboard to pull up the Polaris Career Center and choose Allied Health and Nursing on the dropdown menu, he notices that median earnings are much higher for students who attain at least an associate degree compared to those who don’t. In fact, five years after graduation, those with a degree earn a median wage of $49,865 compared to just $27,071 for those who don’t earn a degree. Six years after graduation, degree-holders earn more than double their peers who don’t have a degree. Armed with these data, Joe will be able to make a much more informed decision about his future.
***
These new dashboards are a welcome addition to Ohio’s transparency efforts. They have the potential to serve a wide range of stakeholders, from district and school leaders looking to build on what works to policymakers eager to make data-driven decisions. Most importantly, though, this effort puts detailed and accurate information straight into the hands of students, who can use it to make informed decisions about their future. Ohio kids and families deserve to be well-informed. These resources help make that happen.