

School Funding
Ohio’s collective bargaining laws are a drag on its schools
The Fordham Institute recently published a comprehensive study comparing the power of teacher unions across all 50 states.
The Fordham Institute recently published a comprehensive study comparing the power of teacher unions across all 50 states.

The Fordham Institute recently published a comprehensive study comparing the power of teacher unions across all 50 states. The report’s authors—Melissa Arnold Lyon, Sandy Frost Waldron, and Rebecca Jacobsen—compiled data on 59 indicators that capture unions’ resources, political involvement, policy wins and losses, and perceived influence, as well as the extent to which state labor and bargaining laws empower them.
One can quibble with some of the methodology, of course. The indicators capturing “policy wins and losses” may say little about union power, as we don’t know what policies a state would have adopted in the absence of unions’ political efforts. For example, Ohio might well have adopted universal education savings accounts by now—and perhaps it would have done so long ago—had it not been for union opposition. Similarly, as the authors acknowledge, survey respondents’ perceptions of union strength may not be fully grounded in reality.
Nonetheless, the authors’ methodological choices are reasonable, their analysis is systematic and transparent, and the rankings generally validate political wisdom (e.g., that blue states tend to have stronger teacher unions). For those of us who have monitored the diverging paths of Ohio and Wisconsin since 2012, the results are a stark reminder of what could have been.
How powerful are teacher unions in Ohio?
Overall, according to the report and Ohio’s online profile, Ohio ranks 17th nationally in terms of overall union power, which lines up with its specific rankings in terms of union resources and membership (16th) and unions’ political involvement (17th).
How can it be that a red state with a long-standing commitment to school choice finds itself in the top third in terms of union power? The analysis confirms what we’ve long known: Ohio has one of the most stifling collective bargaining laws in the country. According to the report, Ohio is among the five states “with bargaining policies most favorable to teacher unions”—ranking just a notch ahead of California.[1]
Ohio unions’ power to bargain over salaries and a broad range of school district policies—further bolstered by their power to strike—means that school boards and superintendents often have limited discretion over how district schools are run. Moreover, as a prior analysis demonstrates, the Ohio districts most burdened by collectively bargained salaries and policies are those that can least afford it: large urban districts that need managerial flexibility to deal with serious problems, such as declining enrollments, half-empty school buildings, and low student achievement.
Divergent paths: Ohio vs. Wisconsin
To fully grasp the significance of Ohio’s position, one can look to Wisconsin as an example of what might have been.
In 2011, both states stood at educational and fiscal crossroads. Wisconsin passed Act 10, which fundamentally altered public-sector collective bargaining by limiting it almost exclusively to base wages, disallowing the inclusion of rigid salary schedules in agreements, requiring annual union recertification, and ending the automatic collection of union dues. That same year, the Ohio General Assembly passed Senate Bill 5, a similarly comprehensive package aimed at reforming public-sector collective bargaining rules and eliminating public employees’ right to strike.
However, while Wisconsin sustained its reforms through intense political challenges, Ohio’s SB 5 was repealed by a union-backed referendum before it ever took effect. It is conceivable that, had Ohio exempted fire and police from its bargaining reforms as Wisconsin did, they would have remained intact. My colleague Vlad Kogan thinks the critical difference was the availability of a citizen-initiated referendum in Ohio, whereas Wisconsinites were limited to attempting to recall the governor. Whatever the precise cause, the point is this: Ohio’s reforms died, while Wisconsin’s lived.
Fordham’s report documents what happened next. Wisconsin experienced the biggest decline in union membership in the country, from 98.34 percent of the state’s teachers belonging to a union in 2012 to 44.57 percent of its teachers in 2026. Meanwhile, Ohio’s union membership rate remained relatively steady, declining from 91.48 to 88.38 percent of the state’s teachers—a modest decline in the wake of the 2018 Janus decision, which enabled teachers to opt out of their unions without incurring a financial penalty.
Correspondingly, between 2012 and 2026, Wisconsin unions’ financial contributions to state political parties plummeted by 87 percent (from 1.93 to 0.25 percent of total contributions) while, in Ohio, they declined by a more modest 32 percent (from 3.02 to 2.07 percent).
These trends track with changes in students’ performance on the National Assessment of Educational Progress (NAEP) eighth-grade math test, which research indicates is a strong predictor of long-term student outcomes such as higher incomes and educational attainment, and lower teenage motherhood, incarceration, and arrest rates. In 2011, Wisconsin and Ohio both ranked 14th nationally in terms of their students’ average scale score on the eighth-grade NAEP math test. However, by 2024, Wisconsin ranked second while Ohio ranked tenth. These rankings are volatile from year to year—and trends between the two states are similar on other NAEP exams—but Ohio and Wisconsin appear to be on different trajectories on a test that is predictive of long-term student wellbeing.
Is there a causal relationship between the decline in union power and student achievement in Wisconsin? Yes, it turns out there is. Rigorous research confirms that Wisconsin’s Act 10 led to a decline in union resources and political power, as well as corresponding increases in student achievement. Research also provides evidence that declines in union power in fact caused improvements in student achievement. As Barbara Biasi’s earlier research indicates, an important part of the story is that superintendents with newly acquired managerial discretion were able to attract and retain good teachers.
The diverging paths between Wisconsin and Ohio seem to hinge, at least in part, on Ohio’s failure to implement its 2011 bargaining reforms.
* * *
This new evidence should serve as an urgent wake-up call for Ohio lawmakers. Fordham’s report shows empirically that Ohio is an outlier in terms of the strength of its labor and collective bargaining laws. If we are genuinely committed to giving every child in Ohio an excellent education, we must address the underlying statutory structures that enable teacher unions to put a stranglehold on district management.
Fifteen years ago, Ohio failed to reform its labor laws. The data now show the cost. Wisconsin’s trajectory demonstrates that structural labor reform is entirely achievable and transformative. It’s time for Ohio policymakers to align collective bargaining laws with the needs of our students.
[1] The report also claims Ohio is one of only four states that have “enhanced” unions’ collective bargaining power since 2012, by mandating that school districts collectively bargain if teachers vote to unionize. But, as I pointed out in a prior post, this has been a requirement since the collective bargaining law was enacted in 1983.

In 2025, the General Assembly created a workgroup tasked with reviewing pupil transportation and developing recommendations aimed at “better meet[ing] the transportation needs of Ohio students.” Consisting of four state lawmakers (two from each party) and 11 school officials (representing all education sectors), the workgroup was formed in response to persistent concerns about students being left without rides, particularly those attending public charter and private schools.
The workgroup’s final report was released earlier this month. It depicts districts’ growing use of an “impracticality” loophole that allows them to deny student transportation. The report offers a series of recommendations—some more realistic than others—that seek to address the problem. Let’s take a look at the findings and key recommendations.
“Impractical to transport”
For more than 50 years, Ohio has required districts to provide transportation to all resident students, whether they choose a district school or an alternative.[1] The law makes perfect sense. It promotes safety and efficiency, as a single entity is responsible for busing rather than hundreds of individual schools attempting the feat. It’s also fair to taxpayers: All parents receive a public service from the district to which they pay taxes. Finally, the law honors parents’ choices. They can rely on their local district for transportation even if they select another option. To support districts in this task, the state provided $830 million for transportation in FY26 (up from $603 million four years ago).
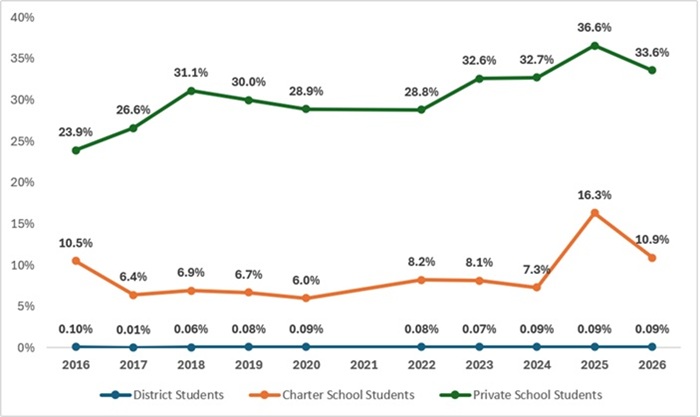
Unfortunately, as the workgroup report discusses, school districts declare tens of thousands of charter and private school students “impractical to transport.” This loophole—or “statutory opportunity,” as the report awkwardly phrases it—permits districts, through school board resolution, to deny tax-paying families the busing service they are otherwise entitled to. The latest numbers per the report: In 2025–26, districts rejected transportation for 19,153 private school and 2,723 charter school students (representing 34 and 11 percent of transported private and charter students, respectively). Instead, districts pay their families a nominal “payment in lieu of transportation” of about $600—half of what districts spend to bus a typical student and the equivalent of a meager three bucks and change per day.
As Figure 1 shows, districts have increasingly used this loophole to avoid busing. Impracticality rates over the past two years are the highest on record (these data have been tracked since 2015–16). And in 119 districts (roughly one in six statewide), the workgroup notes that every single private and charter school student was declared “impractical”—likely reflecting a blanket policy of rejecting parents’ requests rather than making case-by-case determinations. In stark contrast, only 618 district pupils statewide were denied transportation last year, representing less than one in every 1,000 transported district students overall. Likely, these are mainly students attending their home district but could consist of some open enrollees who are entitled to transportation if they make it to a bus stop within their district of attendance.
Figure 1. Percentage of district, charter, and private school students declared “impractical to transport,” 2015–16 to 2025–26
Workgroup recommendations
The workgroup report generally acknowledges that denying transportation en masse is wrong and recommends a policy framework that would “guarantee transportation for all eligible Ohio students to their school of choice.” This goal is spot-on and consistent with Ohio’s longstanding policy (save for districts’ “opportunity” to declare children “impractical”).
Given this, one might have expected a clear and forceful call to simply repeal the impracticality provisions, a move that lawmakers should seriously consider. But, alas, the workgroup—comprised of several district officials—did not go that route. Instead, the report argues for a “phasing out” of impracticality conditioned on a slew of other policies being adopted (e.g., lots more money, regional transportation consortia, increased data collections, statewide student registration systems, and more). Those are fine ideas, but also large and complicated proposals that would be tough to implement in the real world and thus unlikely to be enacted. In the meantime, thousands of Ohio families will continue to be denied transportation because of impracticality.
Fortunately, the workgroup shifts toward more realistic proposals near the end of the report. There, it suggests ways that lawmakers can at least curb districts’ abuse of the impracticality provision. Commendable recommendations include:
Though not formally adopted by the workgroup, a report appendix contains two more critical policy recommendations:
***
School transportation should be a basic public service provided by local governments (districts) to all families in the community. Regrettably, the bus doesn’t come around to serve thousands of Ohio students due to a massive loophole in state law. Though not perfect, the workgroup report contains some recommendations that would help to curtail abuse and better ensure that every student gets a ride to school.
[1] Certain commonsense exceptions do apply: Districts are not required to transport students who live less than two miles from their school or more than 30 minutes away. Providing busing for high school students (grades 9–12) is also optional for districts.

In Ohio, the summer months are quiet on the legislative front. This fall is shaping up to be quiet, as well, with lawmakers focusing most of their attention on the November election and its potential impacts. But there is some low-hanging, bipartisan fruit that policymakers can and should pluck before the end of the year.
House Bill 644, which was passed out of the House in May, aims to boost postsecondary student outcomes by establishing the Higher Education Evidence-Based Innovation Fund.[1] The fund would be housed in the state treasury and consist of designated dollars from the General Assembly and private contributions. It’s important to note that the bill doesn’t provide state dollars. Its purpose is to create an infrastructure that lawmakers can use to allocate funding in next year’s biennial budget. The chancellor of higher education would then competitively award grants to state institutions to support “the adoption of evidence-based reforms and practices.”
More specifically, grant funds would go toward the “development, piloting, scaling, and assessment” of student success programs. The bill defines these programs as those that are established and operated by a state institution of higher education for the purpose of improving postsecondary retention rates, completion rates, or the time it takes students to earn a degree. Each program must emphasize supporting low-income students. If the bill becomes law, the chancellor would be required to open competitive grant periods at least once every two years beginning in 2027.
There are two reasons why this grant program merits consideration.
First, it emphasizes evidence-based practices. That’s not unique, as most education legislation calls for interventions to be evidence-based. But “evidence” is typically treated as an umbrella term that covers pretty much anything. HB 644, however, explicitly defines an evidence-based practice as an activity, strategy, or intervention that falls into one of two categories.
1. It demonstrates a statistically significant effect on improving student outcomes or other relevant outcomes based on one of the following:
2. It does both of the following:
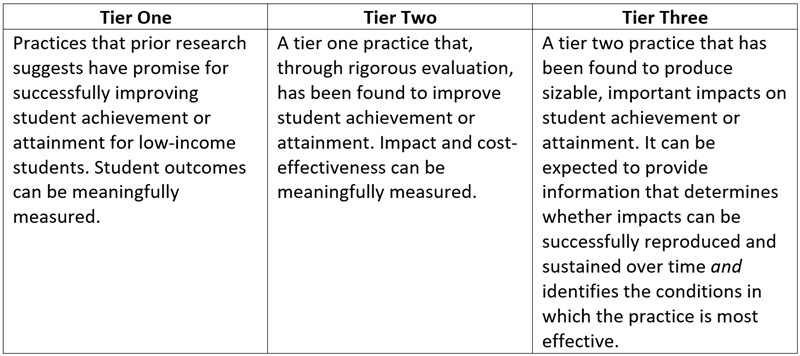
But that’s not all. The bill also separates evidence-based practices into three tiers. Preference must be given to those who plan to use tier three practices.
Table 1. Tiers of evidence-based practices
Second, the bill prioritizes specific and measurable metrics of success. While many grant programs require some type of effectiveness evaluation, HB 644 makes measurement a key feature instead of an afterthought. Grant applications must identify annual benchmarks for student outcomes and outline a plan for evaluating evidence-based practices. This plan must include “experimental designs using random assignment or other research methodologies that allow for the strongest possible causal inferences.” When developing criteria for awarding grants, state agencies[2] must include metrics related to student retention and completion, the economic mobility of students, and student preparation for high-wage or high-need jobs. Collectively, these expectations set a rigorous bar for evaluation that will make it much easier to identify which programs are successfully boosting student outcomes.
It’s easy to pay lip service to evidence-based practices and rigorous evaluation. But HB 644 doesn’t just talk the talk; it walks the walk. It sets a high standard for what actually counts as evidence based. It requires institutions to track specific and measurable metrics. And it pairs these expectations with the possibility of state funding that institutions can use to pilot innovative, promising programs that boost student outcomes. This is a bipartisan, win-win bill. Policymakers should make it law.

Thousands of Ohio students are M.I.A. from school and losing the opportunity to reach their potential. Nearly 385,000 students—about one in every four—were “chronically absent” in 2024–25, meaning they missed more than 10 percent of the school year. Of these students, 125,000 were absent more than 20 percent of the year, or about two months’ worth of school. In districts such as Cleveland, Lorain, and Youngstown, more than half of students were chronically absent. Based on preliminary data, attendance appears little improved in 2025–26.
Ohio has pursued various ideas to address this crisis. Governor DeWine pledged to dramatically cut absenteeism. State officials have created toolkits to provide advice for schools. A taskforce was convened and offered some helpful recommendations. Ohio has a philanthropy-led attendance effort. We at Fordham have suggested coaches and a stronger report-card measure to combat absenteeism.
These initiatives and ideas all have merit, but they may not be enough to vanquish widespread absenteeism. To add extra oomph, state policymakers should explore funding levers. One possibility in this realm is a move to an attendance-based school funding formula—an approach to funding that the nation’s two largest states (California and Texas) implement and that has encouraged their schools to take daily attendance seriously.
Funding actual attendance, not just enrollment
Ohio provides state aid based on pupil enrollments.[1] Enrollment-driven funding is common across the U.S., but it’s also blind as to whether students actually show up for school. All that matters is whether students are on a school’s membership roll—not if they attend. Since attendance has no bearing on funding levels, schools aren’t as likely to take proactive measures, such as improved bussing, home visits and family supports, or even initiatives that directly reward students when they are present.
In contrast to Ohio’s enrollment-based system, California, Texas, and four other states fund schools based on attendance. Because state funding hinges on attendance, schools pay closer attention to it. In a recent report, the California Legislative Analyst’s Office argued in favor of maintaining an attendance-based system and wrote the following:
(1) the ADA [average daily attendance]‑based funding model creates a fiscal incentive for districts to prioritize actions that support increased attendance; (2) statewide attendance rates improved after the state changed its ADA model in the late 1990s to more closely link funding to student attendance; and (3) under the current model, districts have taken recent actions to support attendance.
A smattering of news reports corroborates that California districts do indeed respond to the financial incentive. In advocating for a comprehensive attendance strategy, one school board member recently said that it’s “the biggest [revenue] lever we have... We get paid by who shows up.” Notable also is that California has nearly restored attendance rates to pre-pandemic levels, while Ohio still lags its pre-pandemic marks.
One can also locate similar news stories about Texas districts pushing for attendance to boost their state aid. We also find a state comptroller report (2003) urging Texas schools to prioritize attendance because they can more than recoup their expenses by claiming the additional state dollars. It recommended:
Beef up truancy programs—more students in average daily attendance means more dollars allocated to the district through state funding formulas. Socorro ISD added three attendance officers to increase attendance and could get $1.2 million in additional state revenues over five years.
Lacking financial incentives, Ohio schools don’t have the same urgency as their California and Texas counterparts. In those states, attendance matters—real dollars are at stake—and their schools take more assertive measures to push for it.
Navigating transition challenges
Despite its advantages, attendance-based funding would stir debate in Ohio. If done in isolation, a shift implies reduced funding, as the number of students present on a given day inevitably falls below enrollment.[2] This would raise political hackles, as well as the specter of hold-harmless “guarantees” to keep districts’ state funding afloat—yet also undercuts the fiscal incentive. Equity concerns may also surface, as high-poverty urban districts tend to have lower attendance and could face larger funding reductions under such a transition.
State policymakers would need to thoughtfully navigate these issues, but it could be done by considering the following.
First, Ohio could phase in the change to blunt the immediate impact of the lower attendance-based counts relative to enrollments. The state is already undertaking a phased approach to usher in more accurate (but lower) economically disadvantaged rates for purposes of disadvantaged pupil impact aid (DPIA) funding. A similar approach could be used to phase in attendance and phase out enrollment data for funding purposes.
Second, on the equity issue, Ohio already drives significant supplemental funds to high-poverty schools through DPIA (about $600 million statewide this year). Though this is already a substantial amount, Ohio could consider a bump in DPIA in conjunction with a move to attendance-based funding.[3] This would maintain the incentive—schools could still generate more state aid when more students are present—but also offset reductions associated with a transition.
Third, policymakers should consider the strong likelihood that attendance rates improve in response to the incentive. Should this occur, schools will experience smaller reductions due to the transition (all else being equal in the formula).
Fourth, Ohio already has funding policies embedded in school choice programs that take into account attendance. Online public charter schools must document that students are participating in learning opportunities (the equivalent of attendance)—not merely enrolled—to receive state aid. In addition, students participating in EdChoice lose their scholarships if they accumulate more than 20 unexcused absences. These policies are designed to incentivize attendance and protect taxpayer dollars. Why not apply the same logic to public education funding, writ large?
* * *
Students need to be in class to learn and excel academically. Conversely, bad attendance derails academic progress and could even build habits that undermine employment success when students start working. Ohio must consider all policy options to fight back against absenteeism. Attendance-based funding could be a powerful tool that encourages schools to do everything in their power to help students get to class.
[1] Ohio’s long-standing use of “guarantees” undermine the enrollment basis of the school funding formula, as they provide excess funds to prop up districts losing enrollment. Local funding is entirely disconnected from district enrollments (and attendance), as it depends on the local tax rate and tax base.
[2] The statewide attendance rate was 91.3 percent in 2024–25 and 93.5 percent in 2018–19 (pre-pandemic).
[3] The increase should be additive—that is, in addition to covering an already-needed increase to DPIA to account for the phase in of the lower (but more accurate) counts of low-income students.

A plethora of research findings indicate that the gender gap in college performance today—favoring females in terms of enrollment in a four-year college and completion of a bachelor’s degree—appears as early as elementary school, with some variation in timing based on race/ethnicity and family income. A new report pins the timing down to no later than third grade and shows that the race and income introduce less variation than previously thought.
Researchers Dan Goldhaber and Stephanie Liddle from the University of Washington use data from The Evergreen State to examine the relationship between third-grade test performance—the earliest such data available—and students’ college outcomes. They start with more than 506,000 public school students who entered third grade between 2006 and 2012, including demographic characteristics, family income, and third-grade test scores in math and English language arts. They follow all students through one year after high school graduation and members of the first four cohorts through four years after high school graduation.
First up: They find that males and females are not evenly distributed among the performance deciles on third grade tests, with females overrepresented in the top five deciles, and males overrepresented in the lower five deciles. Black and Hispanic students are heavily overrepresented in the lower deciles regardless of gender—roughly 70 percent scoring in the bottom half of the distribution—of which 53 percent are Black or Hispanic males. By contrast, 62 percent of Asian students score in the top half of the distribution, comprising 47 percent males.
Using a multinomial logistic regression model, they examine college enrollment patterns, focusing on test deciles and gender. Overall, students in the lowest decile of third-grade achievement had a 6 percent chance of attending a four-year college while those in the highest decile had a 49 percent chance. So far, so logical. But at every decile, they also find a gap in four-year college enrollment clearly favoring women over men—by an average of 7 percentage points. This makes less intuitive sense, but is consistent with previous research. Put another way, males in all deciles except the highest had roughly the same chance of enrolling in a four-year college as females who performed two deciles below them in third grade. Low-income students of both genders were less likely to enroll in four-year colleges than their higher-income peers, but the female/male enrollment gap above was generally consistent within various income groups. Two-year college enrollment, interestingly, did not show the same gender gaps.
Goldhaber and Liddle confine their college completion analyses to a subset of students (136,710) who enrolled in either a two-year or four-year college the first year after high school and could be observed through four years after high school graduation. Overall, 67 percent of students who enrolled in a two-year college after high school were not observed completing an associate or a bachelor’s degree within four years, and 44 percent of students who enrolled in a four-year college after high school were not observed completing either degree. Women made up 54 percent of all degree completers. There was minimal gender difference in the likelihood of completing a two-year degree, consistent with the two-year college enrollment findings. Conversely, women’s probability of completing a bachelor’s degree outstripped men’s by 3 to 12 percentage points across every third-grade-performance decile. Notably, the average gender gap in bachelor’s degree completion is even larger (by 2.1 percentage points) than the gender gap in four-year college enrollment. In every racial and ethnic category, women were also more likely to complete a four-year degree than men—also in the 3 to 12 percentage points range—but the comparison between lower- and higher-income students reveals gender gaps ranging from 5 to 30 percentage points in favor of women, depending on third-grade-performance decile.
The report is quick to point out that these are not causal findings. Third grade test scores in math and English provide only a limited view of academic ability, just as four-year graduation from college is not the norm for many degree-earners. Moreover, the individual educational experiences for students between third grade and college, including possible out-of-school academic supports, are a black box in this research design. However, thousands of these students attended the same Washington schools with the same teachers and the same resources available. Thus the authors portray their findings as “early indicators” of future postsecondary outcomes, especially for boys. Whatever mix of influences determine the likelihood of college enrollment and completion is already in motion as of third grade, and these data show that boys of all races and ethnicities are particularly at risk of getting locked into low performance from an early age. And while there are clear reasons why high school boys would be less likely to go to college than their female peers, there are also societal reasons for wanting to close those college-going and college-completion gender gaps. Educators, policymakers, parents, and other stakeholders who value the latter will have to both boost the early achievement of young boys and convince more of them to go to college after high school.
SOURCE: Dan Goldhaber and Stephanie Liddle, “Gender, Ethnoracial, and Economic Differences in the Predictive Power of Early-Grade Test Scores on College Enrollment and Degree Completion,” The ANNALS of the American Academy of Political and Social Science (May 2026).