Interdistrict open enrollment is one of the most important—yet commonly overlooked—forms of school choice in Ohio. Under this longstanding policy, students can attend a nearby district that may be higher-performing or provide programs and courses not offered by their home district.
Interdistrict open enrollment is one of the most important—yet commonly overlooked—forms of school choice in Ohio. Under this longstanding policy, students can attend a nearby district that may be higher-performing or provide programs and courses not offered by their home district. For some students, open enrollment might cut commute times (if they live near district boundaries) or allow them to attend schools with relatives or friends. It could even help families on the move, as a student can maintain enrollment in their current school, even if their address changes. Open enrollment may be the only viable school choice option for many families living in rural parts of the state.
Over the past decades, countless thousands of Ohio families and students have benefitted from this option. Today, about five in six districts open their doors to non-residents—the decision to do so is voluntary under state law—and nearly 75,000 students statewide attend a nearby district via open enrollment. Previous work from Fordham found that open enrollment provides academic benefits, particularly for lower-income students.
Storms clouds, however, are threatening to wash away this popular option. And for some students, it’s already raining. Recently, news broke from Northeast Ohio that Cuyahoga Falls and Norton school districts will pull the plug on open enrollment, sending more than 500 students back to their home districts (or to charter or private schools). Over the past couple years, otherstoriesthroughoutthe state also indicate that a growing number of districts are either discontinuing or scaling back open enrollment.
These are stark reminders that open enrollment remains a “voluntary” program in which school boards choose whether to admit non-residents. Under such a policy, the financial incentive matters immensely. In districts with unused capacity (of which there are many in Ohio), they can fill empty seats by open-enrolling students—and improve their finances if the funding per open-enrollee exceeds the incremental cost of serving them, such as paying for instructional materials or perhaps some added costs associated with operating full rather than half-full classrooms (like keeping a teacher’s aide).
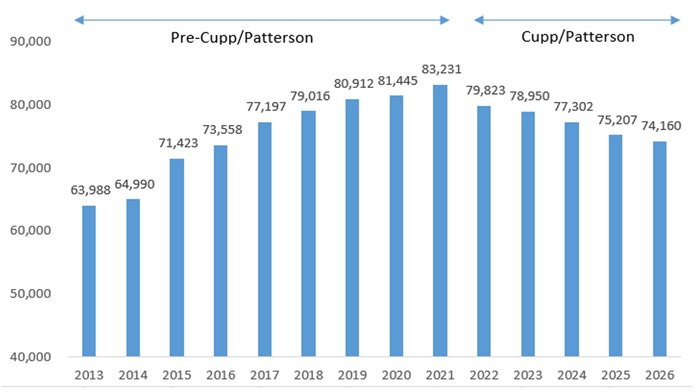
Historically, Ohio provided sufficiently generous funding to encourage district participation. Under the Kasich-era student funding formula, the state provided a standard amount that applied statewide: $6,020 per open-enrollee in the last year it was used. This per-pupil funding covered the incremental cost of adding open-enrollees—largely filling empty desks in existing classrooms—for most districts. Because the finances worked out, student participation steadily rose from 2013–21, as indicated in the chart below.
Figure 1: Interdistrict open enrollment participation, FY13 to FY26
The economics changed for the worse when Ohio adopted the Cupp-Patterson funding formula. Asdiscussedpreviously, this model treats open-enrollees just like resident students for the purposes of funding. In practice, this means a funding cut for open enrollment in many districts. Because the Cupp-Patterson model applies a district’s state share percentage to an open-enrollee’s per-pupil funding, a mid-wealth district may receive just $4,000 to $5,000 per open-enrollee, while a high-wealth district receives even less. Given the funding reductions, it’s not surprising to see a downturn in open enrollment.
But smaller funding amounts caused by the application of the state share is not the only problem. The guarantees embedded in Cupp-Patterson wreak further havoc on the financial incentives. When districts are on the guarantee, accepting open-enrollees may not generate any additional state aid. They are no longer funded by their current headcounts (including open-enrollees) but instead based on a historical funding level.[1] This year, 267 districts or about two in five, are on the guarantee. Those districts, especially the ones receiving the largest amounts, have virtually no incentive to open-enroll additional students.[2]
To fix this mess, Ohio should restore its former method of funding open enrollment. Rather than dragging open enrollment into the complexities of the formula—as Cupp-Patterson does—a flat per-open-enrollee amount would make perfectly clear the funding incentive for participation. And if set at $6,020 per student (or somewhere above it for inflation), the amount would restore confidence that open-enrolling students is fiscally sound. Going back to the old approach would avoid complications with the guarantee. Even if a district was on the guarantee during the Kasich era, it still received $6,020 per open-enrollment student. Finally, a reversion may not impose a substantial expense to the state (net of what it currently spends to fund open-enrollees), as the previous method counted open-enrollees in their home district and then transferred the funds to their district of attendance.
While sensible at first blush, Cupp-Patterson erred by treating open-enrollees the same as resident students for funding purposes. As the story from Cuyahoga Falls and Norton reminds us, open-enrollment students are different from resident students—districts do not have the same legal obligation to educate them—and open-enrollees should be treated differently under the formula. In their case, the per-pupil funding acts as a financial incentive and is critical in determining the access students have to public schools outside of their home district.
Ohio families and students shouldn’t be left in the lurch because of a misguided formula change. With more districts curbing access to their schools, it’s time for lawmakers to fix the method for funding open enrollment.
[1] If a district’s formula prescription is narrowly below a historical benchmark, then open-enrolling students could move it off the guarantee and onto the formula. In that case, a district would receive additional per-pupil funding for an open-enrollee.
[2] There is a complex mechanism, however, in Cupp-Patterson that tries to discourage districts from cutting open enrollment for existing open-enrollees (as Norton and Cuyahoga Falls did).
Last year, the Ohio Senate unanimously passed Senate Bill 19. The legislation, which is currently being considered by the House Education Committee, aims to improve student achievement by providing academic intervention services to those who score at the lowest level (“limited”) on state assessments in math or English language arts. It’s also designed to support high achievers by requiring public schools to enroll any student in grades 3–7 who scores at the two highest levels on their state math exam (“accomplished” or “advanced”) in an advanced math course the following year.
For the typical seventh grader, this would mean enrolling in Algebra I during eighth grade. Plenty of students already do that, so it’s important to recognize that Senate Bill 19 isn’t a start-from-scratch effort. Instead, it aims to ensure that all seventh graders who demonstrate readiness have access to algebra in eighth grade—something that isn’t happening today and is keeping high-ability students from pursuing advanced math and science courses when they reach high school and STEM majors when they reach college.
State level data show us how many students are being overlooked for advancement. During the 2023 school year, more than 23,000 seventh graders scored accomplished or advanced on the state’s math assessment. These students are considered to be on-track for college. Their scores are a clear indicator that they’re ready for more challenging work. Testing data indicate that high-ability students taking Algebra I in eighth grade almost universally perform well on the state’s end-of-course exam. And yet, more than half of them (55 percent) weren’t enrolled in algebra during eighth grade and thus didn’t take the end-of-course exam in 2024. That’s nearly 13,000 students who missed out on advanced math opportunities despite proving their readiness.
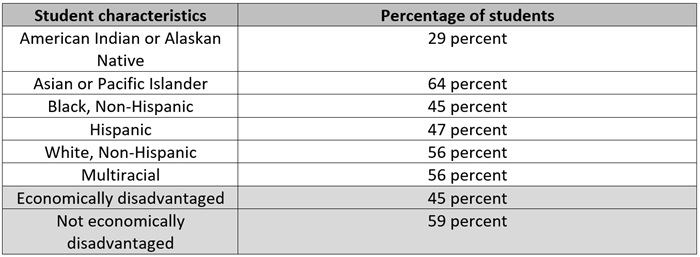
High-achieving low-income and minority students are more likely than their peers to miss out on advanced math. Less than 50 percent of Black, Hispanic, and American Indian/Alaskan native students who scored in the top two levels took algebra in eighth grade, while 56 percent of their White peers did so. A similar gap exists based on income: Just 45 percent of economically disadvantaged students who scored accomplished or advanced were enrolled in Algebra I in eighth grade, compared to 59 percent of their more affluent peers.
Chart 1. Percentage of seventh graders who scored accomplished or advanced on Ohio’s 7th grade math exam and took the Algebra I exam the following year
There are several reasons why these gaps exist. One is that some schools offer fewer opportunities for students to take advanced math. According to a nationally representative survey of teachers and principals published by the RAND Corporation in 2023, only 65 percent of principals in urban schools with middle grades said they offered Algebra I compared to 86 percent of principals in suburban schools. In Ohio, a majority of students who attend urban schools are Black or Hispanic and economically disadvantaged. The RAND survey results suggest these students are less likely to have access to algebra courses than their suburban counterparts, who are predominantly White and affluent. The state-level data outlined above seems to suggest the same.
Even when low-income and minority students attend schools that offer advanced math courses, they can still miss out on the opportunity to enroll. The RAND survey found that nearly one-quarter of principals said teacher nominations were included as part of the selection process for taking Algebra I before high school. That’s concerning, the RAND researchers say, because “previous research demonstrates that use of subjective measures—especially teacher nominations—during the enrollment process is a known contributor to persistent disparities in representation in advanced math courses.”
Senate Bill 19’s automatic enrollment policy would help Ohio address both these issues. Districts and schools that haven’t been offering advanced courses would be required to do so. And every student who demonstrates their academic readiness would have access to Algebra I regardless of whether they have a teacher or parent to advocate for them.
Some stakeholders have expressed concern that taking Algebra I instead of a typical eighth-grade math course could inadvertently cause students to miss out on important concepts and skills they’ll need down the road. Senate Bill 19 is structured in a manner meant to assuage these concerns, as it requires schools to begin identifying students for advanced coursework as early as third grade. Moreover, the bill requires districts to adopt a comprehensive math placement policy that includes a curriculum plan beginning in third grade and a timeline for how students will be prepared to be placed in Algebra I. Districts that align their policies and practice with state law should have plenty of time to identify algebra-bound seventh graders and provide accommodations to ensure they don’t miss out on important content.
For anyone still on the fence, it might be helpful to consider data from other states that have established similar policies and are seeing positive results. Federal Way School District in Washington State was one of the first to establish an automatic enrollment policy. After just one year of implementation, the number of students of color who took an advanced course jumped from 35 percent in 2009–10 to 61 percent in 2010–11. Even with this sizable increase, the course pass rate remained high (94 percent). A high school in Colorado Springs found that students who were automatically enrolled in AP courses based on prior performance had higher AP exam scores than their peers who self-enrolled. And after passing automatic enrollment legislation in 2018, a whopping 92 percent of eligible students in North Carolina were placed in advanced math courses during the 2025–26 school year.
Senate Bill 19 is a golden opportunity for Ohio to level the playing field for disadvantaged students by identifying high-achievers early and offering them support through a prescribed academic sequence. Like other statewide policies, automatic enrollment will require rigorous implementation. But the benefits for students are numerous. The sooner these policies can get underway, the better it will be for Ohio kids.
Governor Mike DeWine’s signature education policy is undoubtedly the science of reading. Passed in 2023, the initiative requires the use of high-quality curricula aligned to the science, mandates professional development for educators, and provides reading coaches to low-performing schools. The legislation also bans “three-cueing,” a debunked method that encourages students to guess at words, rather than sounding them out.
Getting the reading law passed—and investing millions to support its launch—were essential first steps. But the long-term success of the initiative hinges on classroom implementation. Will schools and teachers truly commit to the science of reading? Will the new textbooks and materials actually see use, or sit on storage shelves? Might teachers slip back into old habits if they are struggling to implement evidence-based practices?
Implementation was clearly top of mind in Governor DeWine’s recent “state of the state speech.” In his address—his last before leaving office—the governor outlined a couple key ways that the Ohio Department of Education and Workforce will be taking action to promote rigorous implementation.
First, the agency will create regionally-based “science of reading instructional implementation teams.” These expert teams will be laser-focused on helping schools “fully execute the science of reading.” The governor suggested that they will undertake mandatory reviews in low-performing schools (or perhaps a selection of them each year), and their services will be available to any school seeking an independent review of their reading programs.
Based on the tenor of his comments, which mentioned possible non-compliance issues, these teams will hopefully have some oversight and audit-type responsibilities—not just be there solely to offer some advice and hand-holding. This direction would be encouraging—especially for underperforming schools—as serious evaluations of their reading practices, including adherence to the science of reading, is sorely needed. The U.K.’s inspectorate and Massachusetts’s site visit system demonstrate how strong onsite reviews can drive improvement. With any luck, Ohio will develop a similar-style system that provides both the necessary accountability and the actionable feedback needed to bolster reading instruction.
Second, Governor DeWine pledged to add another 50 reading coaches this coming fall. Since 2023, state-funded reading coaches have provided more personalized one-on-one or small-group supports for teachers implementing the science of reading, particularly those working in low-performing schools. As of this year, there are 97 coaches who serve 151 schools statewide. While it’s still too early to fully understand their impacts in Ohio, research from other locales indicate that coaches sharpen instructional practices, which in turn boosts student achievement.
Beefing up coaching is another commendable way to push for strong implementation. Yet as the state redoubles its commitment in this area, it should make every effort to do the following:
Prioritize coaching placements in the state’s lowest-performing schools. Out of the 151 schools with reading coaches, just 29 are located in the high-poverty Ohio Eight cities.[1] These urban schools face the largest achievement gaps, and making sure they have strong coaches is critical. This may require mandatory placements in some of the schools with the lowest reading proficiency rates, rather than asking schools to sign up for a coach (as is current practice).
Recruit coaches with experience implementing the specific curriculum being used at their placement school. As one education scholar put it: “Often, U.S. teachers must work with a curriculum that suggests one instructional method, a coach who suggests another, and professional development that suggests a third.” While recruiting coaches is no walk in the park, pairing coaches who are well-versed in the curriculum their school is using can increase the likelihood of success.
Create conditions that allow for rigorous program evaluation. Coaching is not inexpensive—nor should it be—and the state will eventually need to gauge whether the benefits outweigh its costs. State officials should make sure the program design is conducive to evaluation. This might entail enhanced data collection in elementary schools (K–2 data are notably sparse, absent state testing) or thinking through design features that allow for stronger causal analyses.
The science of reading promises more effective instruction and improved reading proficiency across Ohio. Thanks to leadership of Governor DeWine and the members of the General Assembly, the initiative is off to a strong start. For the effort to achieve its intended goals, rigorous implementation is key. The support teams and additional reading coaches are another two steps forward on Ohio’s path toward improved literacy.
[1] The Ohio Eight refers to traditional districts and public charter schools located in Akron, Canton, Cincinnati, Cleveland, Columbus, Dayton, Toledo, and Youngstown.
School leaders, teachers, and state policymakers all work to provide information to parents about the quality of education in their schools and about their own children’s academic performance. How do parents receive and—if needed—act on the information provided? A new working paper creates an experimental methodology to examine how motivated parents are by various types of academic performance information, including a unique effort to reveal how parents respond when test scores and report cards send conflicting signals.
Researchers Derek Rury from Oregon State University and Ariel Kalil from the University of Chicago used the online survey platform Prolific to recruit parents from across the United States. All individuals who signed the consent form and completed the survey were paid a small stipend, but initial questions were designed to weed out anyone who was not currently the parent or guardian of one or more K–12 students. The majority of parent survey completers (n=2,078) were White (68 percent), followed by 18 percent Black, 7 percent Hispanic, and 2 percent Asian. Nearly 70 percent were mothers. The average age of parents was 41, and the average age of their oldest child was 17. Just over half of parents had completed a college degree and almost 42 percent reported household incomes below $60,000 annually.
The full survey focused on a hypothetical fifth grader who was “enrolled in a school similar to the participant’s own” and who had a specific letter grade in class, score on a standardized test (from 1 to 99), and percentile rank (10, 30, 50, 70, and 90) compared to a nationwide sample of fifth graders. Each survey respondent received a randomized set of data for a child and was asked to offer advice on how much time and money the family of this child should invest in their child’s academic progress based on the academic data provided. The child’s name was also randomly altered to indicate a boy or a girl for different survey completers. The dataset ultimately included more than 23,300 individual investment decisions.
Finally, participants were asked a series of questions regarding their feelings toward grades and standardized tests, designed to reveal whether parents viewed tests as biased against certain groups, whether they felt like a bad parent if their child earned poor grades or test scores, whether they believed parental investments pay off more if the child is already a good student, and so on. Researchers also asked parents how much they valued both grades and tests when making such investment decisions for their own child.
On average, participants recommended that parents invest about $43 per week and a little over four hours a day on their child’s academic progress. But Rury and Kalil found that survey respondents recommended stronger compensatory strategies—more investment to support the child—when either test scores or class grades indicated poor student performance. On average, a one-unit decrease in grades (e.g., from B to C) increased recommended investment by 0.14 standard deviations; a one-unit decrease in test score percentile category increased investment by 0.12 standard deviations. They also found clear evidence that parents placed more weight on grades than test scores when making investment recommendations. That is, the signal to invest was stronger for low grades than for low test scores.
And when the signals are mixed? In scenarios where grades were high but test scores were low, respondents did not recommend investing time or money. In scenarios where grades were low but test scores were high, they did recommend investing, consistent with the non-mixed signals responses. In short: The positive signal of high grades appeared to override the danger signal of low test scores. These findings cut across income, parental-education, and race/ethnicity categories, although Hispanic parents exhibit particularly pronounced grade-weighting. The findings also echo those established by Learning Heroes, whose survey and focus group studies have been sounding similar alarmsfor years.
The mechanisms at work in Rury and Kalil’s results aren’t immediately apparent, with the researchers’ best guess centered on interaction between the common belief (40 percent of respondents) that standardized tests are biased against “certain groups,” the fact that more respondents reported feeling distressed over their own child’s poor grades than over their poor test results, the high number (almost 30 percent) of respondents who said test scores were a reflection of family income, and several other widely-held beliefs captured in the data. They recommend that future research dives deeper into the specifics of these anti-test biases.
In conclusion, Rury and Kalil sound the alarm that their findings, coupled with rampant grade inflation, indicate parents are not receiving accurate information about how their children are really doing in school. From the parent perspective, this could lead to underinvestment in a child’s academic needs. And from the educator sector perspective, students will get less help at home unless grades and test scores start to match up—and tell the truth. From the policy perspective, it all sounds like a recipe for continued academic malaise.
It’s not often that a conservative education secretary and a progressive teachers’ union boss see eye to eye. But such a convergence occurred last year, when Secretary Linda McMahon told a congressional committee that a “four-year college is not for everyone” and, a few months later, President Randi Weingarten of the American Federation of Teachers said almost the same thing in The New York Times. Rather than continuing to push a “college for all” approach, both voiced support for stronger career and technical education to help more young people transition from high school to the workforce.
With bipartisan support from many governors and legislators, career and technical education has also risen on state policy agendas. Leaders have promoted industry-recognized credentials as a tool to validate students’ technical skills and to aid transitions into the workforce. Here in Ohio, such credentials are used in three principal ways: (1) Students can use them to meet alternative high-school graduation requirements; (2) schools receive credit on the state report card when students earn them; and (3) schools receive extra state funding (currently up to $725 per credential) through the Innovative Workforce Incentive Program (IWIP).
For graduation and report-card purposes, Ohio has approved an expansive list of 693 credentials tied to jobs in thirteen career clusters (e.g., agriculture, business, and healthcare). These credentials include anything from basic CPR and job-safety certificates to full occupational licenses. The state’s IWIP credentials are more selective—focusing on fields like IT and advanced manufacturing. Today, just 210 credentials qualify for these funds. With this trio of policies encouraging credentials in place, attainment has soared: 26 percent of Ohio’s class of 2024 earned credentials during high school, whereas just 2 percent of the class of 2014 did so.[1]
But how beneficial are such industry credentials for students? This is a critical question that state policymakers are wrestling with, yet only a handful of studies have shed light on their value. A prior Fordham Institute report found that credential earning in Texas was associated with modest wage increases in the year immediately after high school; another study, from Florida, linked credentials to college attendance. Though not focused on credentials earned during high school, a national study from the American Enterprise Institute and Burning Glass uncovered wide differences in the economic returns of various credentials.
This study is the first from Ohio to examine industry credentials, and, alongside a recently published report from Texas, is one of the first nationally to study how they relate to students’ longer-term outcomes. Author Jay Plasman of The Ohio State University focuses his analysis on postsecondary education and labor market outcomes for students in the high school classes of 2016 to 2022, a span of time that covers cohorts affected by the state’s early rollout of credential policies.
Here are Dr. Plasman’s main findings:
1. Credentials typically provide students with an income boost right after high school, but wage returns weaken over time. In the year immediately after high school, students who earn an industry credential have an average annual income that is 21 percent higher than their non-credential-earning peers of similar demographic and academic backgrounds. However, the wage return on a credential falls to just 5 percent by the time (former) students reach their mid-twenties. The diminishing return may be partly due to students (without credentials) earning college degrees, which helps their wages catch up. It’s also possible that some credentials help young people get their foot in the employment door but don’t help them climb the ladder after that.
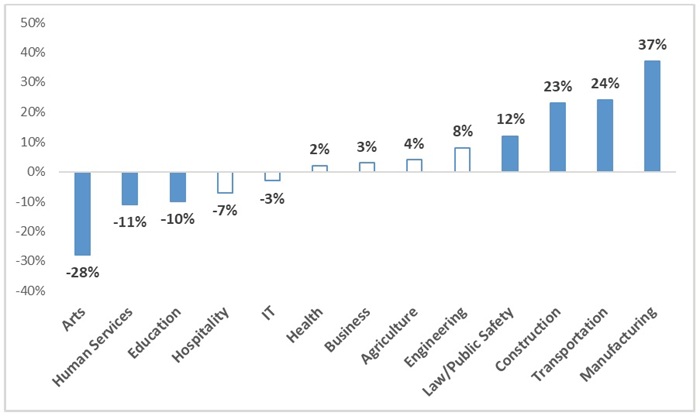
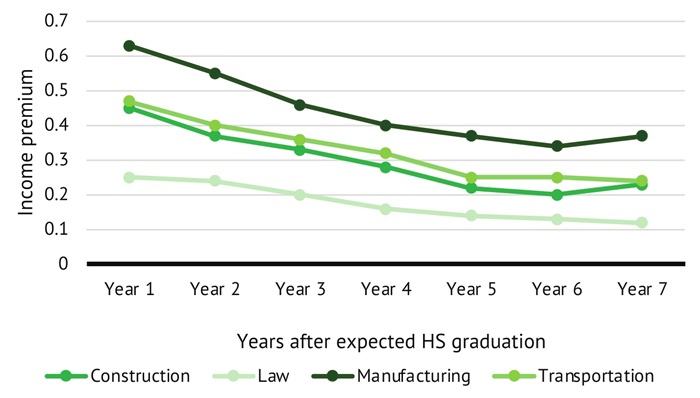
2. Some credentials hold value as students reach their mid-twenties—but others do not. As figure A shows, credentials in construction, transportation, and manufacturing are associated with stronger and more enduring wage returns. For instance, the average student attaining a manufacturing credential—e.g., a welding or mill-operating certificate—earned wages at age twenty-five that were 37 percent higher than a peer who did not attain a credential during high school. Credentials in other career clusters have less certain long-term economic value by the time students reach their mid-twenties.
Figure A: Credentials’ wage returns seven years after high school, by career cluster
Note: Solid bars indicate statistically significant wage gains or losses (discussion and technical detail are available on pages 23 and 27). Information about which specific credentials are tied to each career cluster is available here.
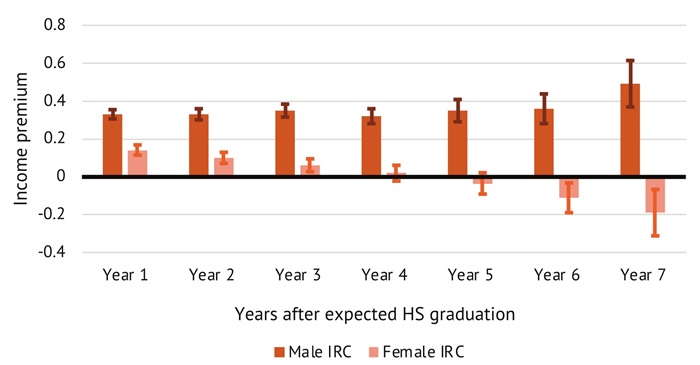
3. Young men benefit more from credentials. By their mid-twenties, male credential-earners have annual incomes 23 percent higher than students who have not earned credentials, while female credential-earners enjoy no wage advantage at all (their returns are actually negative). This reflects the fact that males attain far more of the high-value credentials in such industries as construction, manufacturing, and transportation.
4. Credentials are associated with higher wage returns when paired with career and technical education course completion. Students do not necessarily need to complete formal coursework to earn a credential; some credentials can be earned through self-paced learning modules and passing a skills assessment. But those students who combine structured coursework and an industry credential earn higher wages than those who only earn a credential: 18 percent more by their mid-twenties, versus 4 percent for students with only a credential.
5. Earning industry credentials is, on average, negatively associated with college attendance and degree completion. While this finding isn’t entirely surprising, it does contrast with priorstudies suggesting that career and technical education might increase college-going. It’s not entirely clear what is behind the negative relationship. Although the analysis includes a rich set of control variables, the results may reflect unobserved characteristics (e.g., less motivation to pursue higher education) that contribute to credential earners’ lower college attendance rates. Credential earning could also be “nudging” students toward the workforce and away from college.[2] There may also be variation in post-secondary outcomes by the type of credential-earned, an issue not examined here but warrants further study.
What are the real-world implications of this analysis? Industry credentials should remain an integral part of a robust career-and-technical education system that also includes rigorous coursework and work-based learning. Yet policymakers ought not view all credentials as holding equal value. As work by higher-educationanalysts reveals, college majors have widely varying payoffs in the labor market. The same holds true for industry credentials. With that in mind, we offer the following recommendations for state policymakers, both in Ohio and elsewhere.[3]
Be selective about which credentials are approved. Some industry credentials unlock value for students—and Ohio has done a respectable job of identifying those types for IWIP. But many others do not, including some that Ohio has approved for graduation. State leaders should be wary of approving low-value credentials, lest they inadvertently push students away from college or into jobs with little room for wage growth.
Gauge credentials’ economic value based on longer-term outcomes. This study shows the importance of examining credentials over a longer timeframe. To wit, the cosmetology credential is associated with a modest income return immediately after high school, but its value disappears six years after high school. States should prioritize credentials that offer enduring value to students, not just a short-term boost.
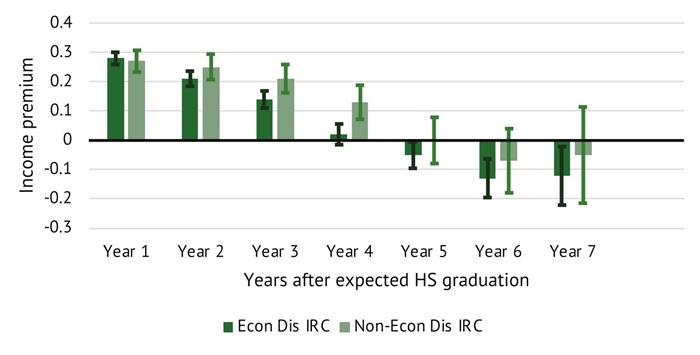
Create high-value credential opportunities for disadvantaged students. This study indicates that economically disadvantaged pupils tend to earn lower-value credentials (see Figure 5 below, a finding that mirrors data presented elsewhere showing that students in urban areas are racking up a great many questionable credentials en route to their high school graduation. In Ohio, we need more programs such as Toledo Public Schools’ new commercial driver’s license program and fewer programs that add little value to students’ career prospects.
Avoid making credentials a substitute for academic competence. For graduation purposes, Ohio permits students to substitute credentials for math and reading competency as measured by a state test. In hindsight, this was a policy misstep, especially as the state has struggled to evaluate credentials and ensure quality control. Today, thousands of Ohio students exit high school with weak academic skills and credentials whose value will likely evaporate quickly. It’s important to encourage students to develop specialized technical skills and pursue individualized pathways, but not at the expense of basic English and math competency.
Young people should have opportunities to do something they love and to secure jobs that pay enough to support a family—and do all this without having to spend four years in college. That’s a tall order, but rigorous career and technical education can help many students get on the right path. Industry credentials can and should continue to play a key role in the future of career-tech in America. Let’s make sure that they are being used wisely and that they truly pay off for students who earn them.
Executive Summary
Industry-recognized credentials (IRCs, hereafter usually simply “credentials”) in high schools have seen rapid expansion in recent years, with the intent of providing students with an alternative to traditional college preparation and to align career and technical education (CTE) in high school with labor market needs. These credentials serve two potential purposes: to provide evidence of a student’s employability after high school and to provide a foundation for engagement in later postsecondary education pursuits. Although the specifics vary, all IRCs are issued by some authority (e.g., a business, an industry group, or a state-certifying entity) that is external to the school itself (Giani, 2022; U.S. Department of Labor, 2010) and can include anything from a basic CPR certification to an advanced Telecommunications Tower Technician certification.
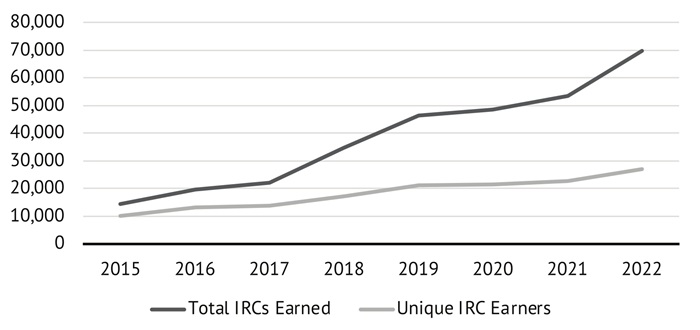
Like many other states, Ohio has experienced extremely rapid growth in credential attainment over the past decade, with the number of unique earners increasing nearly threefold between 2015 and 2023. In addition to an increase in credential earners, the total number of credentials offered in the state has ballooned to nearly 700 unique credentials offered in the 2025–26 school year (ODEW, 2025). Of note, not all credentials are equivalent with respect to how they are awarded or in how they are recognized by the state. The rise corresponds with key state policy changes: credentials as an option to fulfill high-school graduation requirements and a targeted policy to increase credential earning in high-priority career fields (Plasman, 2025). Amid these increases and the direct link to policy priorities, state leaders need an understanding of how and which credentials that students earn relate to their success after high school.
This report examines the effects of earning a credential in high school on postsecondary education and labor market outcomes for the 1.3 million Ohio students who entered high school between the school years of 2011–12 and 2019–20. By exploring the labor market outcomes, it provides new evidence on longer-term (up to seven years beyond high school) effects of earning a credential. In addition to assessing the overall consequences of earning any type of credential, it explores the potential benefits of earning a credential designated as high-demand and high-wage under Ohio’s recently authorized Innovative Workforce Incentive Program (IWIP). Of the 693 total credentials offered in Ohio’s high schools, 210 are identified as high-demand/high-wage credentials under IWIP as of the 2025–26 academic year.
The study focuses on three questions:
What is the relationship between earning a credential and outcomes after high school (e.g., related to postsecondary education and eventual income in the labor market)?
What role does achieving CTE concentrator status—by completing at least two CTE courses in the same career pathway—play in the relationship between credentials and later outcomes?
How does this relationship differ based on whether a credential is or is not IWIP-designated?
To respond to these questions, we use data provided through the Ohio Longitudinal Data Archive, which includes high school, postsecondary, and labor market information from the Ohio Department of Education and Workforce (ODEW) and the Ohio Department of Job and Family Services. At the most basic level, our analyses compare the educational and earnings outcomes of students who did and did not obtain credentials in high school. In each of our analyses, we include a robust group of control variables that account for student demographics, prior academic achievement, coursetaking patterns, and the highest degree earned (for labor market outcomes) to ensure we are making comparisons between observably similar groups of students. Below we highlight key findings for our selected outcomes.
Finding 1: On average, earning a credential is positively associated with high school graduation but negatively associated with postsecondary enrollment and completion.
Students who earned a credential were about 6 percentage points more likely to graduate from high school (graduating at a rate of 87 percent, compared with 81 percent for students with no credentials), with very little difference based on whether a credential was IWIP-designated.[4] On the other hand, students earning any credentials in high school were about 9 percentage points less likely to enroll in a postsecondary education program (40.6 percent of credential earners versus 49.3 percent enrolled in college).
Finding 2: On average, earning a credential is associated with higher odds of employment and annual income for up to seven years after high school.
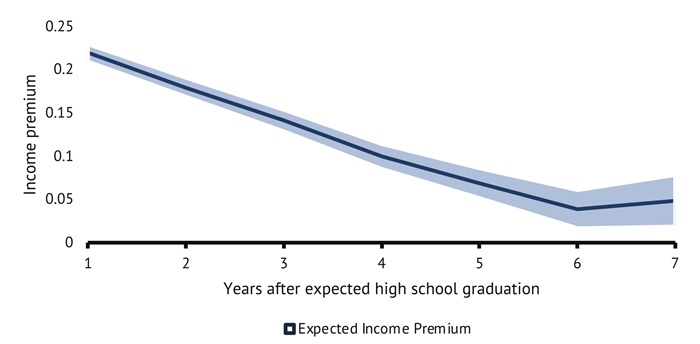
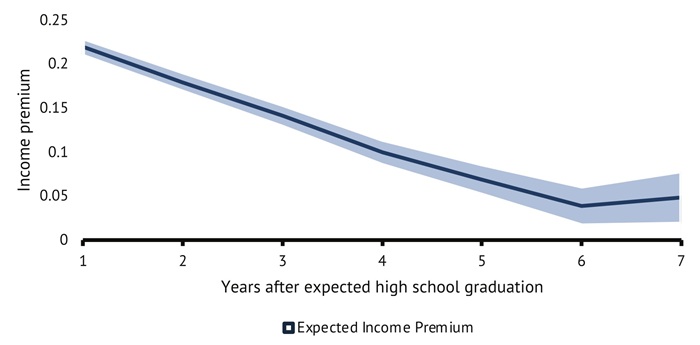
Students who earned a credential were about 2 percentage points more likely to have had paid employment than non-IRC earners (86.8 percent of credential earners versus 88.5 percent of non-earners). Credential earners also had higher expected income relative to non-earners after high school, though the difference reduces over time, which correlates with college-goers entering the workforce. In the first year after high school (figure ES-1 below), credential earners are expected to earn about 22 percent more (about $2,900 in annual income) than their non-earning counterparts and about 4 percent more (or an extra $720 in annual earnings) by year 6.
Figure ES-1. Income Premiums Over Time Associated with Earning an IRC
Finding 3: On average, students have better outcomes if they concentrate in CTE in addition to earning a credential.
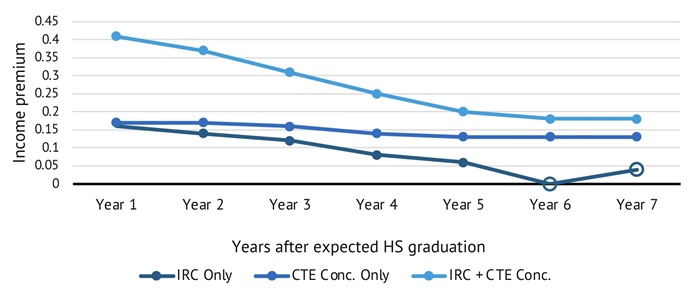
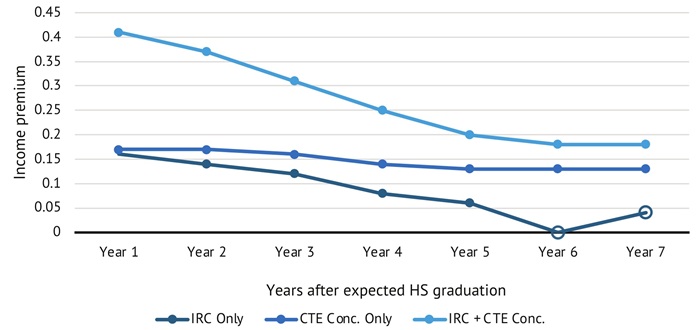
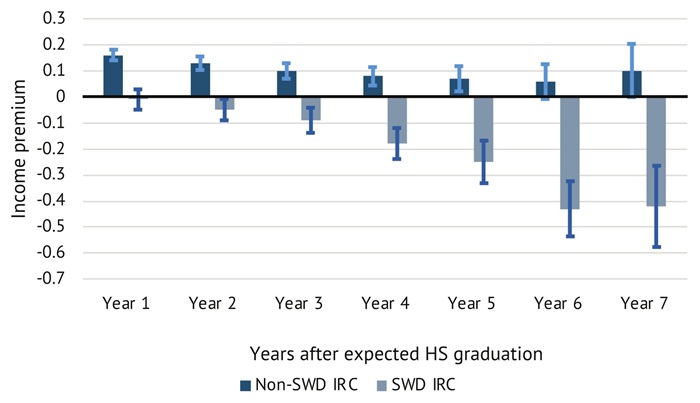
The relationship between credential earning and later income differs greatly based on whether an individual earns only an IRC or combines to both earn an IRC and concentrate in CTE. After accounting for postsecondary degree attainment, students who earned only a credential and those who only concentrated in CTE see very similar income premiums in year 1 after high school (16 percent higher income, or about $1,810, than non-earners/non-concentrators). However, individuals with both a credential and CTE concentration are expected to make an average of 41 percent more (about $5,450) than those with neither. By year 6, credential earners and non-earners don’t see different earnings. However, CTE concentrators (about $3,060) and combination earners (about $3,880) have higher income premiums in year 6. There are major differences based on key student demographics: Male students (versus female students), non–economically disadvantaged students (versus economically disadvantaged students), and students without disabilities (versus students with disabilities) typically see higher income premiums.
Figure ES-2. Income Premium Over Time by IRC and CTE Concentration Status
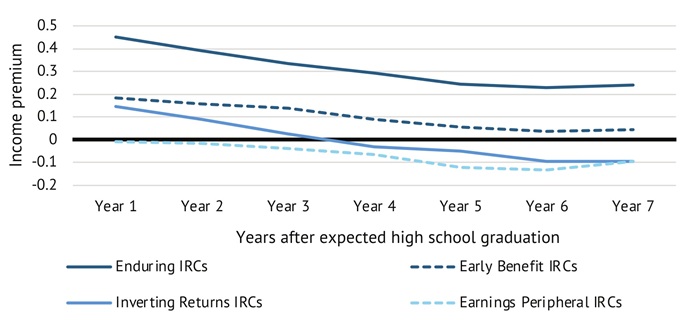
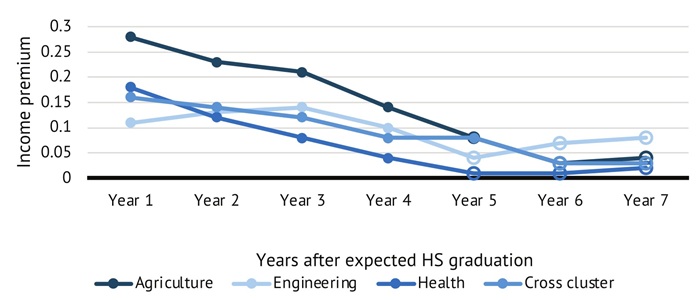
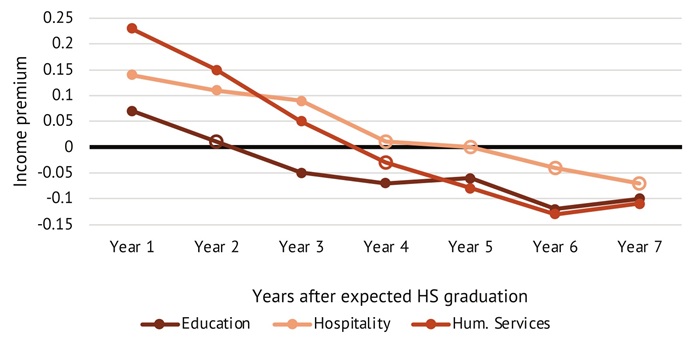
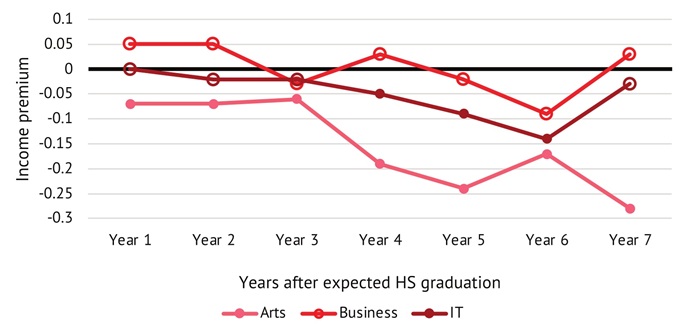
Finding 4: Across four categorizations of credentials based on labor market returns, only one category—made up of construction, law and public safety, manufacturing, and transportation—is associated with consistently higher income premiums.
The field in which a student earns a credential plays a large role in expected income-related outcomes. In this report, we group credentials into career clusters as defined by ODEW and create four categories based on labor market returns (see figure ES-3 below). First, “Enduring IRCs” show consistently positive relationships with income over time and include credentials in the fields of construction, law and public safety, manufacturing, and transportation. “Early Benefit IRCs” are associated with positive income premiums early but produce no observable relationship in later years; they include credentials from agriculture, engineering, and health. The third group we refer to as “Inverting Returns IRCs”—including IRCs in education, hospitality, and human services—which show initially positive income premiums, but the relationship becomes negative over time. Finally, “Earnings Peripheral IRCs” do not show any positive income premiums and include those in the arts, business, and information technology clusters.
Figure ES-3. Income Premium for Identified IRC Categories
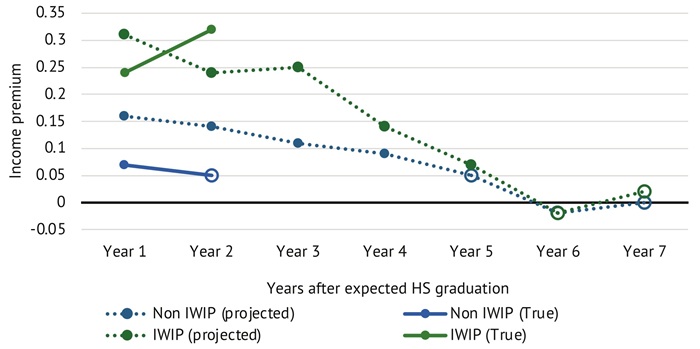
Finding 5: On average, projected IWIP-designated credentials are associated with larger income premiums than non-IWIP credentials.
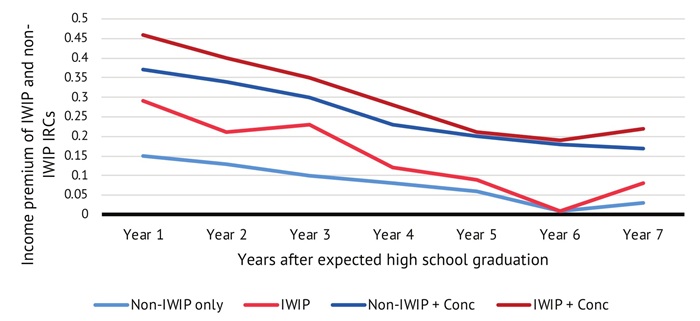
Below we show the results for all credentials that were earned prior to IWIP authorization. We define IWIP-projected credentials as those that would have been designated as such after the authorization of IWIP. For IWIP credentials that were awarded after the IWIP authorizations (true IWIP credentials), initial estimates suggest that income premiums may be even larger than for those issued prior to the IWIP policy (see figure 4 in the main body).
Figure ES-4. Income Over Time IWIP Designation: Pre-IWIP Initiative Only
Note: To be able to observe longer term, we focus here on the credentials students earned that would eventually be designated as IWIP (i.e., IWIP-projected credentials) but were awarded prior to the authorization of IWIP. We only have access to two years of labor market data for credentials awarded after IWIP authorization, though the true IWIP credentials are linked to higher income in those two years.
In figure ES-4, we show that IWIP-projected credentials are related to higher post–high school earnings than non-IWIP credentials in the years immediately after graduation. In year 1, IWIP credentials are related to an income premium of nearly 30 percent, while the non-IWIP premium is just 15 percent. However, the IWIP premium declines over time and comes together with the non-IWIP premiums in year 6. The combined benefit of earning CTE concentration and an IWIP credential relates to the highest income premium for students.
Discussion
The major takeaways based on the above findings are as follows:
Students who earn credentials are more likely to graduate from high school.
Students who earn credentials are less likely to enroll in postsecondary education and go on to earn a postsecondary degree.
Students who earn credentials typically see better labor market outcomes in early years after high school.
Coupling credential earning with CTE concentration links to larger benefits on average.
Benefits differ for students from different demographic backgrounds and differ based on the field in which a credential is earned.
Our main findings related to high school and labor market outcomes do generally align with prior work in this area. Researchers at RTI International have done a good deal of work on earning industry credentials in the state of Florida, showing meaningful links to high school completion (Glennie et al., 2025). Further, as we’ve seen in literature related to industry credential earning in high school and postsecondary career preparation programs, the field of study matters a great deal with respect to labor market outcomes (Giani, 2022; Stevens et al., 2019). That CTE concentration is also associated with these high school and labor market outcomes is also unsurprising given prior work by Dougherty (2016), Rodriguez et al. (2012), and Theobald et al. (2017). Differences across subgroups identified in our report also align with prior work by Kemple and Willner (2008) showing that male students are particularly likely to benefit from career-focused education programming in high school. Each of those prior studies links closely with our findings here. However, we do find some major differences with respect to postsecondary participation. In Glennie et al.’s (2021) study on earning credentials in the state of Florida, the authors found that students who had earned credentials in high school were actually more likely to attend two-year colleges and earn an associate degree than non–credential earners, whereas we found a negative overall relationship with college enrollment and attainment.
Recommendations for Ohio policymakers
Ohio’s continued focus on workforce development through career and technical education, with a heavy emphasis on industry-recognized credentials, demands continuing efforts to evaluate the success of such initiatives. Our work here provides an in-depth examination of how some of these policy investments relate to student outcomes. Below we highlight key policy recommendations related to credential earning and CTE concentration in high school.
1. Consider requiring students to complete a combination of baseline academic and CTE coursework (i.e., concentration) and in the same career field that they earn a credential. Earning credentials is one path to high school graduation in Ohio. However, as we have shown in this report, not all credentials are equivalent when it comes to later outcomes. The state might wish to revisit how credential earning relates to high school graduation. Potential labor market benefits of credentials diminish over time, but CTE concentration appears to have more consistent links with higher later income. Further, students who earn credentials and concentrate in CTE are expected to see even larger income premiums. With this in mind, one potential update to graduation requirements could require that students who demonstrate readiness through career-related education must earn a credential and concentrate in CTE in the same field. This option would not only ensure rigor through passing assessments required to earn credentials but also ensure students are following meaningful pathways instead of picking and choosing unrelated pursuits. Additionally, such an option would be a move in the right direction toward ensuring students are in position to succeed once they enter the labor market.
2. Income alone should not be used to measure the efficacy of credentials. While much of this report does focus on the potential income benefits of earning credentials, there are two key findings that suggest income alone is insufficient as a way to identify whether credentials are benefiting students and the state more broadly. First, our finding that female students see negligible or even negative income premiums related to credential earning may be more a function of traditionally male-dominated careers (and, consequently, associated credentials) having higher pay than traditionally female-dominated careers. This links to a second key finding related to the differences depending on credential cluster. The three clusters in the Inverting Returns category are traditionally more female-dominated or at least balanced. Further, credentials in the health cluster (another field with higher proportions of women) also see benefits only in the initial four years after expected high school graduation. Given the dire need for more individuals in health and education fields in particular, future policies should look to credentials as a way to strengthen alignment between learning and later career, regardless of postsecondary education pursuits.
3. Continue to fund IWIP reimbursements to encourage further growth in high-demand sectors. In our analyses focused on IWIP designation (see figure 4), there is an extremely wide gap between IWIP-designated credentials and non-IWIP credentials. Even though we only looked at the first two years of labor market earnings for these credentials, the evidence suggests that IWIP credentials not only produce better outcomes than non-IWIP credentials (compared with non–credential earners) but also the potential benefits may even increase over time. In the 2026–27 state budget, policymakers commendably increased the overall IWIP reimbursement set-aside from $11 million to $16 million per year. Other recent budget initiatives in fiscal year 2025 included a $300 million investment in improving CTE offerings across the state. Further, the budget for career and technical centers will be increasing at a substantially larger rate over the next two years compared with traditional high schools (Churchill, 2025). This is an important gap because traditional high schools serve a different student demographic—more likely to be low-income and minority—than career and technical centers, and as discussed above (see Figure 6), the income premiums associated with earning credentials for economically disadvantaged students were lower than those for their non-disadvantaged peers. In the next budget cycle, policymakers should consider additional allocations that help expand access to high-value credentials across a wide variety of schools delivering CTE programming and ensure schools receive the maximum per-credential reimbursement (not scaled-back amounts, as has occurred in recent years). With this substantial investment, it will be important to continue to track potential benefits, as they may differ for IWIP and non-IWIP credentials in the longer term.
4. College and career readiness does not equate to college and career success with respect to earning industry credentials in high school. One of the most telling findings in this report is the contrast between postsecondary education outcomes and labor market outcomes related to earning credentials. Above, we provide evidence that students who earn credentials may be choosing to forgo college and directly enter the labor market. However, as we have also shown, income premiums associated with earning credentials tend to reduce over time. There are two potential options. First, the state could look to secure more articulation agreements between high schools and community colleges that allow all IWIP credentials to count toward postsecondary credits. Second, providing reentry points into postsecondary education and training for the students who choose to immediately enter the workforce—through apprenticeships, postsecondary certificates, stackable credentials, or other mechanisms—should be improved as a way to allow for reskilling and upskilling opportunities. This is particularly important given our findings that income premiums typically diminish over time. In particular, two of the three clusters (engineering and health) in the Early Benefit category and education in the Inverting Returns category are associated with fields that typically require postsecondary education degrees, further supporting this idea that increasing opportunities to upskill or reskill after initial entry into the labor market could help students who pursue these pathways. With this in mind, students, parents, teachers, and counselors need to have access to information about these potential trade-offs. By pursuing these suggested updates (or other comparable options) for credential earners, workforce development policy initiatives that encourage pursuit of further training or education could help translate college and career readiness into observable college and career success.
Ohio has invested heavily in workforce development for high school students, with policies such as IWIP showing initial promise in producing positive outcomes on the labor market. Considering that a large portion of Ohio’s high school graduates choose to enter the workforce immediately after high school, these high-value credentials (IWIP credentials in particular) can help young people get off to a good start in the labor market. When combined with CTE concentration, this initial boost in the labor market is likely even stronger. Although CTE and credentials may not be the chosen option for everyone, state and local policymakers should look to ensure broad access to credentials and CTE programs in high-quality, high-demand fields for all students.
Introduction
Across the country, more and more states are using career-focused learning opportunities to signal the career readiness of high school students and to meet high school graduation requirements (Plasman & Thompson, 2023). This push comes amid growing national concerns that schools are not adequately preparing students to succeed in either college or career (Hershbein & Ferenstein, 2016; Schrand & Tulante, 2021). In an attempt to address these readiness concerns, states are turning to career and technical education (CTE), which is generally designed to engage students more deeply in the learning process by integrating rigorous academic instruction with technical skill development. In recent years, CTE has seen widespread participation by college-bound and non-collegebound students alike (Plasman et al., 2020a), and recent studies have uncovered substantial evidence that CTE is beneficial for high school students (e.g., Lindsay et al., 2024).
CTE has many components, including coursework, work-based learning, and the attainment of industry-recognized credentials (IRCs, hereafter usually simply “credentials”). The prevalence of credentials in high schools in particular has expanded in recent years as a means to further align CTE programming in high school with labor market needs. Part of this growth is related to the reauthorization of federal legislation in 2018 (the Carl D. Perkins Strengthening Career and Technical Education for the 21st Century Act, or more simply referred to as Perkins V) that included language requiring states to report on one of three quality indicators related to secondary CTE programming: work-based learning, credentials of value, and postsecondary credit attainment (Advance CTE, 2020). In response, nearly half of states identified attainment of a credential of value (e.g., industry-recognized credential, apprenticeship certification, government-issued license, or associate or baccalaureate degree) as their quality measure (Advance CTE, 2020). Importantly, these Perkins-described credentials of value include IRCs, which signal an individual’s competence and qualification in a specified industry sector. For students, credentials can serve as evidence of their employability immediately after high school, or high school graduates can use them in their postsecondary education pursuits. Of particular relevance to CTE, credentials are not a product of the education system; rather, they are issued by some authority (e.g., a business, an industry group, or a state-certifying entity) that is external to the school itself (Giani, 2022; U.S. Department of Labor, 2010).
Prior work provides mixed evidence as to how credentials are meeting different goals. Giani (2022) found some evidence that earning a credential was associated with a modest increase in Texas students’ income. However, many students were not employed in an industry closely related to their credential, and only a handful of credentials were linked to enrollment and persistence in a postsecondary institution. Other research out of North Carolina suggests the benefits of credential earning linked with CTE concentration could produce substantial benefits to the broader state economy (Hendricks et al., 2021). A recent report by Sigelman et al. (2025) reflects this finding that outcomes are strongly related to the specific credential a student earns. Specifically, the team found that only one in eight industry-recognized credentials actually provide significant returns on investment. Although the report focused on postsecondary credentials, the findings are relevant—given the focus on credentials, as opposed to full degree programs. Work by Glennie et al. (2021, 2023) showed that credential earners in Florida were more likely to enroll in two-year colleges (and go on to earn an associate degree) but less likely to enroll in four-year colleges (and go on to earn a bachelor’s degree). This report builds on prior work by looking at the relationship between credentials and/or CTE concentration and high school, college, and labor market outcomes in the state of Ohio.
Potential Benefits of Career-Focused Education
There is growing evidence that students who participate in career-focused education, such as earning a credential or concentrating in CTE, are likely to experience improved outcomes related to high school, college, and the labor market. Work by Bonilla (2020), Brunner et al. (2023), Dougherty (2018), Gottfried and Plasman (2018), and Hemelt et al. (2019) provides evidence that CTE concentration and coursework participation in general is predictive of improved chances of high school completion. Related to college outcomes, Plasman and Gottfried (2018), Dougherty (2016), and Gottfried and Bozick (2016) all find links between CTE coursework and concentration and improved odds of enrolling in a postsecondary institution. Finally, there is strong evidence that CTE concentration is associated with a higher likelihood of being employed and higher earnings early after high school (Dougherty, 2016; Hemelt et al., 2019; Kemple & Willner, 2008; Lindsay et al., 2024). Of note, a vast majority of this work has focused on the CTE concentration/coursework aspect of career-focused education. Much less has examined how credentials relate to later outcomes, and what does exist is quite mixed (as mentioned above).
Through the process of earning a credential, students develop specific technical skills that may set them up for success immediately upon entering the labor market, thereby potentially providing opportunities to earn higher income. The interaction between credentials and CTE concentration is of interest because credentials are often—though not always—part of an identified career program of study that includes concentration. However, not all credential earners are concentrators, and not all concentrators are credential earners. By looking at the interplay of these two career-learning opportunities, we can observe the unique contribution of each—and how the combination of pursuing both may relate to different outcomes.
Ohio’s Industry-Recognized Credential Initiatives
While credentials are a national point of focus in the college and career readiness conversation, Ohio has been especially proactive in encouraging the attainment of credentials. First, Ohio includes credentials as an option toward high school graduation. Specifically, students can graduate via a career-technical route that includes a credentials-driven measure. In addition, Ohio requires students to earn two (of twelve possible) state-approved graduation seals, one of which is awarded by earning credentials.[5]
A second recent policy development that incentivizes credentials is Ohio’s Innovative Workforce Incentive Program (IWIP; Ohio Department of Education and Workforce, 2025). The program was first enacted via 2019 budget legislation, and reimbursements for IWIP credentials were first implemented in 2021. The overarching goal of IWIP is to encourage schools to offer (and students to attain) more credentials in state-identified high-demand, high-growth career fields. These credentials are meant to align with Governor Mike DeWine’s Office of Workforce Transformation’s “Ohio’s Top Jobs List,” which identifies critical and in-demand careers. Ohio’s identified critical careers fall into the healthcare, construction, and education fields, while in-demand careers include those in transportation, advanced manufacturing/engineering, information technology, and law and public safety (Office of Workforce Transformation, n.d.). Initially, IWIP credentials were identified from the list of existing credentials that fell into the priority areas and were worth a minimum point value.[6]
IWIP introduced two levers to meet these goals. The first was an implementation grant to fund districts to develop or expand qualifying credential programs in their schools. The second included reimbursement incentive payments directly to districts for each student who earns an IWIP-designated credential. In the original IWIP initiative, the maximum payment was set at $1,250 per credential. However, in fiscal year (FY) 2025, schools received just $470 per IWIP credential since the IWIP budget appropriation was not large enough to cover the total number of IWIP credentials awarded (ODEW, 2025). The most recent state budget, for FY 2026 and FY 2027, reduced the maximum reimbursement to $725 while also increasing the total budget allocation for the program. The increased investment is a move in the right direction, but if students were to continue to earn IWIP credentials at the same rate as in FY 2025, schools still wouldn’t receive the full incentive payment at $725 (they would receive approximately $715 per credential).
Figure 1. Industry-Recognized Credentials, Unique Earners and Total Earned, Over Time
Source: Plasman (2025)
The most recent budget also removed reimbursement of test-fee costs for non-IWIP credentials. This means it is quite likely that more students will earn IWIP credentials in subsequent years, which may necessitate increasing the full set-aside in future budget discussions. The state also recently invested $300 million for one-time equipment and construction grants to support the development of programs that lead to IWIP credentials, though this was authorized for FY 2024, after the window of time covered in this study. Moreover, there has been huge growth in credential earning (both IWIP and non-IWIP) across the state over the past five to ten years, as shown in figure 1 above (Plasman, 2025; Poiner, 2024).
Through Ohio’s recent policy updates related to credentials and CTE concentration, the state clearly aims to lever age career-related education to drive postsecondary success, whether in college or career. High school graduation is a natural outcome of interest, given the state’s inclusion of earning an industry-recognized credential seal as an option to meet graduation requirements. Further, the state indicates that credentials can be used as evidence of prior learning, and as such, they may be used for college credit, which could encourage college-going among credential earners.[7] Finally, credentials and CTE concentration are designed to be of particular relevance for students as they enter the labor market by signaling key skills developed through educational programming, suggesting positive links to employment and income.
This Study
Our report is broken into two main sections:
(1) postsecondary education outcomes—postsecondary enrollment, postsecondary degree earning, and four-year or more versus two-year or less degree earning; and
(2) labor market outcomes—employment status and income.
The following research questions serve to guide our analyses across each of these outcomes:
What is the relationship between earning a credential and later outcomes?
What role does achieving CTE concentrator status (i.e., completing at least two technical courses in a career pathway) play in moderating the relationship between credentials and later outcomes?
How does this relationship differ based on whether a credential is or is not IWIP-designated?
In research question 1, we compare the outcomes of students who earned credentials against those who did not earn any credentials. In research question 2, we directly compare four groups of students: earned a credential, concentrated in CTE, earned both a credential and CTE concentration, and didn’t earn a credential or concentrate in CTE. To respond to these questions, we use data provided through the Ohio Longitudinal Data Archive, which includes high school, postsecondary, and labor market information from the Ohio Department of Education and Workforce and the Ohio Department of Jobs and Family Services.[8] More specifically, we rely on statistical models that incorporate a rich set of control variables and account for potential differences between schools and across time periods, which allows us to better isolate differences attributed to these different educational experiences. Similarly, we include a robust group of control variables that account for student demographics, prior academic achievement, and highest degree earned (for labor market outcomes) to ensure that we are making comparisons across more similar groups of students. We rely on a fixed-effects model (see Appendix A for full details) as the main strategy to estimate these relationships. This model compares students within the same school who began ninth grade in the same year and who had similar sociodemographic characteristics and achievement levels. By including variables related to prior academic achievement and highest degree earned, we are able to further isolate the unique role credentials play in relation to key outcomes by taking into consideration students’ achievement as they enter high school or college and whether they went on to graduate from high school or college. Many of our outcomes are binary (i.e., “yes” or “no”) indicators, which means our results can be interpreted as the expected percentage change related to each predictor. Analyses of income use logged income, which can be interpreted as the percentage difference in income. (For example, an estimate of 0.13 associated with earning a credential would suggest an expected income premium 13 percent higher compared to not earning a credential.)
This report is the second in a series focused broadly on career-related educational opportunities in the state of Ohio. The first focused on broad descriptive changes in CTE concentration, credential earning, and work-based learning over time.[9] The current study builds on this work and focuses predominantly on the impacts of earning credentials, with a secondary focus on CTE concentration.[10] This focus on credentials makes an important contribution to the broader understanding of how career-focused education experiences link to later outcomes. As mentioned previously, this report is separated into two main sections based on outcomes of interest. Section 1 focuses on postsecondary outcomes, while section 2 focuses on labor market outcomes. We conclude with a discussion and recommendations.
Postsecondary Education Outcomes
Before discussing our identified postsecondary outcomes, it’s worth noting that credential earning in high school is linked to higher probabilities of graduating from high school regardless of IWIP designation. Specifically, we find that students who only earned credentials (and did not concentrate in CTE) were about 6 percentage points more likely to graduate from high school compared with students who neither earned a credential nor concentrated in CTE.[11]
With this background in mind, we turn to the relationship between earning a credential, CTE concentration, and postsecondary education. Specifically, we look at whether students who earned a credential and/or CTE concentration were:
A. more likely to ever pursue postsecondary education,
B. more likely to ever earn a postsecondary degree (where a degree could be anything from a certificate earned in less than one year to a PhD or medical degree),
C. more likely to earn a two-year or less degree or a four-year or more degree.
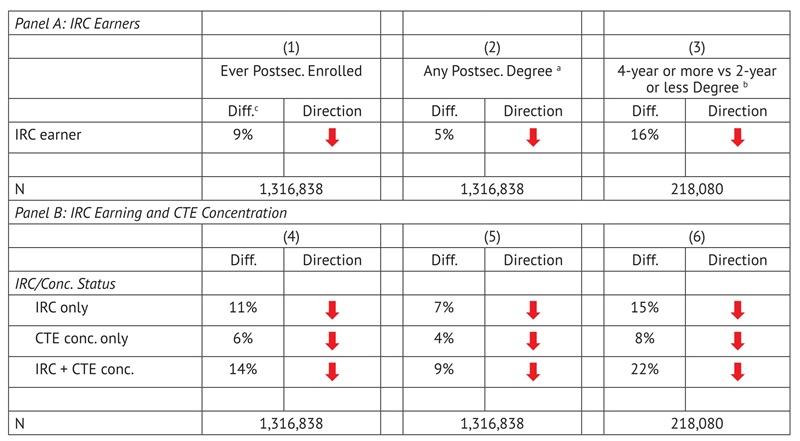
Table 1 presents the results for each of these outcomes. Panel A shows the results when only looking at credential earners, and panel B brings in the moderating relationship of earning a CTE concentration. Across all of these outcomes—and regardless of how CTE concentration is accounted for—the big takeaway is that credentials and CTE concentration are associated with lower likelihood of enrolling in college and earning a postsecondary degree. Focusing on panel B, a credential alone is associated with about an 11-percentage-point lower likelihood of ever going to college, CTE concentration is associated with a 6-percentage-point lower probability, and students with both have about a 14-percentage-point lower probability.[12] A similar pattern emerges in looking at the likelihood of ever earning a postsecondary degree. Here, we see that students who earn a credential are about 7 percentage points less likely to ever earn a postsecondary degree, with CTE concentrators approximately 4 percentage points less likely and those with both about 9 percentage points less likely.
Next, we take a closer look at students who earned credentials and how credential earning and CTE concentration may influence the type of postsecondary degree earned and how long it takes a student to earn a given credential. In model 3 of table 1, we look at a student’s highest degree: whether it was less than a four-year degree or a four-year degree or higher. Among students who eventually earned a postsecondary degree, credentials were associated with a 15-percentage-point lower likelihood of earning a four-year degree or higher, CTE concentration was associated with an 8 percentage point lower likelihood of earning a four-year degree or higher, and earning both a credential and CTE concentration was linked with a 22 percentage point lower likelihood of earning a four-year degree or higher. In other words, students with career-focused education experiences who did earn a postsecondary degree were more likely to earn either a postsecondary certificate or an associate degree as their highest degree. Students who didn’t earn a credential or CTE concentration, on the other hand, were more likely to earn a bachelor’s degree or higher. We explored each of these relationships based on IWIP designation, but there was very little difference related to enrollment in postsecondary education.[13]
Table 1. IRC Earning, CTE Concentration, and Postsecondary Outcomes
Note: The analysis uses a linear probability estimation strategy that includes all control variables identified in appendix section A.2.2 describing postsecondary outcome estimation strategies. School and cohort fixed effects are also included. The analysis sample for models 1 and 2 includes all students (i.e., ninth grade cohorts of 2011–12 through 2019–20). Model 3, looking at four-year or more versus two-year or less degrees, focuses only on the sample of students who ever earned any postsecondary degree. All estimated percentages presented in this table are statistically significant at the 0.1 percent level (p < 0.001). For panel A, the comparison group consists of students who did not earn a credential. “IRC earners” refers to students who earned any credential, regardless of CTE concentration status. For panel B, the comparison group consists of students who neither earned a credential nor a CTE concentration. “IRC only” refers to students who earned any credential but did not concentrate in CTE, and “CTE conc only” refers to students who concentrated in CTE but did not earn a credential; “IRC + CTE conc.” refers to students who earned both a credential and CTE concentration.
a When limiting to students who would have had at least five years (i.e., incoming cohorts of 2011–12 to 2014–2015) to complete a postsecondary degree, the difference becomes even more stark: Credential earners have an 8-percentage-point lower likelihood of earning a postsecondary degree.
b Among those who earned any postsecondary degree
c Percentage-point difference
The Labor Market—Employment and Wages
The bulk of our report focuses on the link between earning a credential and/or concentrating in CTE with key labor market outcomes, specifically whether students were more or less likely to be employed within up to seven years after leaving high school and, subsequently, whether they can expect to have higher incomes in their early careers.[14] Specifically, we examine the following outcomes:
Employment status (i.e., what is the likelihood of ever holding a job after high school?)
Income premiums between one and seven years out from expected high school graduation
Income premium differences across identified student groups (e.g., gender, economic disadvantage status, disability status, and English learner status)
Income premium differences across different career clusters
For each of these outcomes, we estimate links to credentials in three different ways. First, we look at the relationship with credential earning regardless of CTE concentration. Second, we look at how credential earning and CTE concentration interact. Finally, we look at differences based on credentials’ IWIP designation. We turn first to the exploration of employment status.
Employment Status
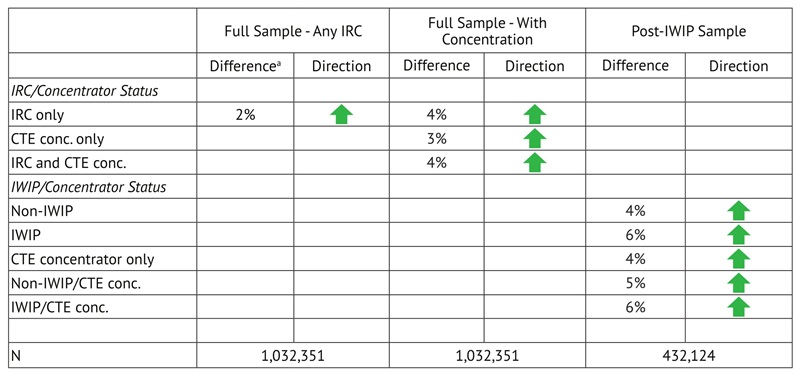
In table 2 below, we show that students who earn credentials are more likely to hold a job within the first seven years after high school.[15] As with our outcomes related to high school and postsecondary outcomes, this baseline finding is based on whether a student ever earned an IRC. Specifically, students who earned an IRC in high school were approximately 2 percentage points more likely to ever have a job after high school than non–IRC earners. When accounting for the interaction with CTE concentration, we see that students in any group—IRC only, CTE concentration only, or combination of the two—are all significantly more likely to hold a job than those who do not participate in career-focused education experiences. Similar conclusions can be drawn when breaking out credentials by IWIP designation, with some evidence that IWIP credentials may have stronger relationships with employment.
Table 2. Employment by IRC and Concentration Status
Note: This table presents the relationship between earning a credential, CTE concentration, or the combination of both (as well as the breakdown by IWIP or non-IWIP designation) and employment status. The analysis uses a linear probability estimation strategy that includes all control variables identified in table A.1, as defined in appendix section A.2.3 describing labor market outcome estimation strategies. School and cohort fixed effects are also included. The analysis sample for model 1 includes all students in the ninth-grade cohorts of 2012–13 through 2019–20. For our IWIP analysis, we focus only on the post-IWIP sample, which includes students who had full access to IWIP credentials (i.e., ninth-grade cohorts of 2017–18 through 2018–19). All estimated percentages presented in this table are statistically significant at the 0.1 percent level (p < 0.001). The comparison group consists of students who earned neither a credential nor a CTE concentration.
a Percentage-point difference
Income Premiums for Credential Earners
Figure 2 below presents our findings when estimating the association between credential earning and later income. As discussed above, this first estimation looks only at the difference between credential earners and those who didn’t earn credentials, without taking into account whether a student combined to earn a credential and CTE concentration. There are a few points worth highlighting. First, there is a significant bump in expected income associated with earning a credential in the years immediately following high school. Second, there is a steady and observable decline over time, with a relatively minimal premium by years 6 and 7 (though still significant). This is likely due in part to a portion of the comparison group choosing to enter college as opposed to the labor market. As this group of college-goers enters the labor market progressively over the seven-year time frame, the income premiums associated with credentials dwindle.[16]
Figure 2. Income Premiums for IRC Earners Over Time
Note: The comparison group consists of students who did not earn any IRC. The black line at the zero mark represents non–credential earners, and the dark orange line shows the average difference associated with earning a credential. The lighter orange shaded zone shows the range associated with earning a credential to determine whether there is a statistical association. The analyses include students from the 2012–13 through 2018–19 incoming ninth-grade cohorts. The dependent variable is logged income, so the IRC indicator can be interpreted as the difference in logged income (i.e., roughly the percentage difference in income). All control variables identified in table A.1 and discussed in section A.2.3 are included in the estimates.
Credential Earning, CTE Concentration, and Income Premiums
While looking only at credential earning can be informative, it is also important to recognize that many credential earners also concentrate in CTE. To address this, figure 3 below expands on the unique relationship between earning a credential and later income and shows the income premiums associated with earning a CTE concentration as well as the combination of earning a credential along with CTE concentration (Table B.4 in the appendix presents the full results for key variables). A first major point worth highlighting is that students who earn a CTE concentration—regardless of whether they also earn a credential—see income premiums throughout the seven years of available data. Second, students who earn both a credential and a CTE concentration are expected to see particularly large income premiums early after high school, though the magnitude of the relationship decreases up through year 5, at which point it becomes relatively stable. Students who earn only a CTE concentration and those who earn only a credential in year 1 after high school see similar expected income premiums; but while the premiums associated with credentials dip almost immediately—with no observed benefit relative to earning no credentials by year 6—CTE concentrators see relatively consistent expected income premiums over the course of time. In sum, credentials are beneficial on their own, but only for so long, whereas CTE concentration appears to remain significantly associated with higher income up to seven years beyond expected high school graduation.[17]
Figure 3. Income Premiums Associated with Earning an IRC, CTE Concentration, and a Combination of the Two
Note: Hollow markers indicate that the relationship is not significant at the 5 percent level (p < 0.05). The comparison group consists of students who earned neither an IRC nor a CTE concentration (i.e., students who do not participate in career-focused education experiences). The analyses include students from the 2012–13 through 2018–19 incoming ninth-grade cohorts. The dependent variable is logged income, so the IRC/CTE concentration indicators can be interpreted as the difference in logged income (i.e., roughly the percentage difference in income).
IWIP, Non-IWIP Credentials, and Income Premiums
Since a major goal of the IWIP initiative was to get students into high-demand, high-paying jobs, it is worth diving deeper into whether they have done so. Accordingly, figure 4 presents the results linking IWIP and non-IWIP credentials to later income, with differences shown for cohorts of students before and after the actual introduction of IWIP. We break these estimates into four different groups: (1) students who earned IWIP-designated credentials after the authorization of IWIP—“True IWIP”; (2) students who earned credentials before IWIP authorization that eventually would become IWIP-designated—“Projected IWIP”; (3) students who earned non-IWIP credentials after IWIP authorization—“Non-IWIP post”; and (4) students who earned non-IWIP credentials before IWIP authorization—“Non-IWIP pre.” Per the figure, students who earned only an IWIP credential were expected to see larger income premiums than students who earned a non-IWIP credential. However, consistent with the analysis of credentials more generally, the relationship between earning a credential and later income, regardless of IWIP classification, diminishes over time. Note, however, that for the True IWIP credentials, there is an observable increase in income premium from year 1 to year 2 while that associated with non-IWIP post credentials becomes non-significant in year 2.[18]
Figure 4. Income Premiums Associated with IWIP IRCs
Note: Pre-IWIP IRCs are defined as those that would have been designated as such after the authorization of IWIP. Individuals in the IWIP category both pre- and post-IWIP earned at least one IWIP credential, though they may have earned non-IWIP credentials as well. Hollow markers indicate that the relationship is not significant. The two pre-IWIP lines (dark green and dark blue) include incoming ninth-grade cohorts 2012–13 through 2016–17, while the two shorter, post-IWIP lines (light green and light blue) include only the cohorts of 2017–18 and 2018–19 incoming ninth graders. The comparison group consists of students who earned neither an IRC nor a CTE concentration (i.e., students who do not participate in career-focused education experiences). The dependent variable is logged income, so the IRC indicator can be interpreted as the difference in logged income (i.e., roughly the percentage difference in income).
Results by Student Group
Figures 5–7 present the income premium differences for identified students groups: male students compared with female students; economically disadvantaged students compared with non–economically disadvantaged students; and students with disabilities compared with students without disabilities. We find that male students, non–economically disadvantaged students, and students without disabilities are expected to benefit more than their identified comparison groups. These estimates all come from looking only at the income premiums associated with earning a credential. Supplemental table B.14 in the appendix presents the findings related to the interaction of credential earning and CTE concentration for each of these subgroups. Additionally, table B.14 presents outcomes for English language learner (ELL) students, but any findings should be interpreted cautiously because the number of ELL students earning IRCs is very small.
Figure 5. Income Premiums Associated with Earning an IRC: Gender Differences
Note: The analyses include incoming ninth-grade cohorts of 2012–13 through 2018–19. Standard errors at the 95 percent confidence level are represented by the whisker bars. Where these bars cross the zero line, the relationship is not statistically significant (p < 0.05). The comparison group is students who did not earn a credential. The dependent variable is logged income, so the “IRC” indicator can be interpreted as the difference in logged income (i.e., roughly the percentage difference in income).
Figure 6. Income Premiums Associated with Earning an IRC: Differences Based on Economic Disadvantage Status
Note: The analyses include incoming ninth-grade cohorts of 2012–13 through 2018–19. Standard errors at the 95 percent confidence level are represented by the whisker bars. Where these bars cross the zero line, the relationship is not statistically significant (p < 0.05). Economic disadvantage is defined by ODEW as a student who is eligible for free or reduced-price lunch, has a household member who is eligible for free or reduced-price lunch, receives (or has a parent/guardian who receives) public assistance, or has a parent/guardian who has completed a Title I application. The comparison group is students who did not earn a credential. The dependent variable is logged income.
Figure 7. Income Premiums Associated with Earning an IRC: Differences Based on Student Disability Status
Note: The analyses include incoming ninth-grade cohorts of 2012–13 through 2018–19. Standard errors at the 95 percent confidence level are represented by the whisker bars. Where these bars cross the zero line, the relationship is not statistically significant (p < 0.05). Student with disability (SWD) status is identified by ODEW as a student who has been officially identified by an evaluation team report to have a disability falling within one of the valid disability options: multiple disabilities, deaf-blindness, deafness, visual impairments, speech and language impairments, orthopedic impairments, emotional disturbance, intellectual disabilities, specific learning disabilities, autism, traumatic brain injury, other health impaired (minor), other health impaired (major), or developmental delay. The comparison group is students who did not earn a credential. The dependent variable is logged income.
There are a few points worth mentioning with respect to each of the figures above. In figure 5, the expected income premium for male students who earn credentials grows over time compared with non-earners, while the expected income premium for female credential earners not only diminishes over time but also becomes negatively associated with income in later years. In figure 6, we see comparable trends for students identified as economically disadvantaged and non–economically disadvantaged who earn credentials, such that the income premium associated with credential earning diminishes over time and eventually becomes negative for economically disadvantaged students. Finally, in figure 7, we see that students with disabilities who earn credentials do not see a positive income premium at any point, with credential earning becoming negative as early as year 2 for this group of students.
Results by IRC Cluster
In addition to understanding differences across student groups, we were also interested in exploring differences across different career clusters.[19] Ohio identifies 15 different CTE career clusters, but only 13 of them have associated credentials.[20] Based on these analyses, we identified four categories—defined by the relationship with later income—into which the different credential clusters can be grouped: (1) consistent positive income premiums; (2) positive income premiums initially with a non-significant relationship over time; (3) positive income premiums initially with a negative relationship over time; and (4) consistent negative or non-significant relationship. As with our analyses above, all analyses related to credential clusters here take into account baseline demographics (gender, race/ethnicity, economic disadvantage status, English learner status, homeless status, and disability status), the highest level of education attained (less than high school up to a doctorate), and whether an individual concentrated in a CTE field. Table B.15 presents the point estimates for credential clusters, while table B.16 provides a descriptive breakdown across each of the clusters by the demographic characteristics highlighted in the section above.[21]
Group 1—Positive income premiums over time: “Enduring IRC Clusters.” Four clusters fall into the group defined by consistently positive and significant income premiums over time: construction, law and public safety, manufacturing, and transportation. Credentials in these fields, the “Enduring,” are associated with higher income across the full timeline of our sample, up to seven years beyond high school. Individuals who earn a manufacturing credential in particular are expected to see a large income boost, with these individuals earning almost 40 percent more than non–credential earners in year 7. Figure 8 below shows the relationship with income for each of these clusters. It is worth noting that the overall pattern for each of these clusters does follow that of all credentials in general. Specifically, even though there are significant and positive relationships across all seven years, the size of these relationships decreases over time. There does appear to be some flattening across years 5–7, which could imply lasting links further beyond high school.
Figure 8. Income Premiums for Enduring IRC Clusters
Note: The analyses include incoming ninth-grade cohorts of 2012–13 through 2018–19. The comparison group consists of students who did not earn a credential. Hollow markers indicate that the relationship is not significant. The dependent variable is logged income, so the “IRC” indicator can be interpreted as the difference in logged income (i.e., roughly the percentage difference in income).
Group 2—Positive income premiums initially with a non-significant relationship over time: “Early Benefit IRC Clusters.” The second group of credentials (figure 9), “Early Benefit,” is characterized by positive and significant income premiums in the first few years after high school, turning to essentially no relationship over time. For engineering and health credentials, this positive relationship is evident in years 1–4, with no relationship in years 5–7. Cross-cluster credentials were associated with positive income premiums from years 1–5, with essentially no relationship in years 6 and 7. For each of these four clusters, there is no significant relationship between earning a credential and income by year 7.
Figure 9. Income Premiums for Early Benefit IRC Clusters
Note: The analyses include incoming ninth-grade cohorts of 2012–13 through 2018–19. The comparison group consists of students who did not earn a credential. Hollow markers indicate that the relationship is not significant. The dependent variable is logged income, so the “IRC” indicator can be interpreted as the difference in logged income (i.e., roughly the percentage difference in income).
Group 3—Positive income premiums initially with a negative relationship over time: “Inverting Returns IRC Clusters.” Three clusters fall into the “Inverting Returns” category: education, hospitality, and human services. As with our second group, each of the credentials in these clusters is associated with a positive and significant income premium in year 1 after high school. However, each of these clusters ultimately crosses over to a negative relationship with income.[22] For this group, students who earned an education credential only see an expected income boost in year 1—though that is more likely due to low salaries in the education field than the credential itself. By year 3, the relationship is significant and negative, and it remains so through year 7. Figure 10 below shows the relationship between credential earning and income for this third group.
Figure 10. Income Premiums for Inverting Returns IRC Clusters
Note: The analyses include incoming ninth-grade cohorts of 2012–13 through 2018–19. The comparison group consists of students who did not earn a credential. Hollow markers indicate that the relationship is not significant. The dependent variable is logged income, so the “IRC” indicator can be interpreted as the difference in logged income (i.e., roughly the percentage difference in income).
Group 4—Consistent negative or non-significant relationship: “Earnings Peripheral IRC Clusters.” The final group of credentials—“Earnings Peripheral”—also contains three clusters. Figure 11 below shows the trends for these credential clusters. In this category, we see credentials related to arts and communication, business and administrative services, and information technology. The defining feature of this group is that at no point is there a positive relationship between earning a credential and income. For business, there is no significant relationship, either positive or negative, at any point between year 1 and year 7. Arts credentials, on the other hand, are significantly related to negative outcomes every year except year 3, which is negative but not significant. Information technology (IT), along with education, is the other field targeted in the IWIP initiative that presents a negative relationship to income associated with earning a credential. Unlike education credentials, however, there is no positive relationship at any point. Of note, though negative in year 7, the relationship for IT credentials is not significant. (It is negative and significant in years 4–6.)
Figure 11. Income Premiums for Earnings Peripheral IRCs
Note: The analyses include incoming ninth-grade cohorts of 2012–13 through 2018–19. The comparison group consists of students who did not earn a credential. Hollow markers indicate that the relationship is not significant. The dependent variable is logged income, so the “IRC” indicator can be interpreted as the difference in logged income (i.e., roughly the percentage difference in income).
Discussion
Ohio has invested heavily in career-related educational opportunities in recent years, with promises to maintain high levels of state funding moving forward (Plasman, 2025; Poiner, 2024). These state investments come on top of the funding from the federal government through the Perkins Act. Though not all investments have focused on industry-recognized credentials for high school students, there is clear evidence that credentials are of interest for state policymakers through initiatives such as IWIP. This report aims to provide evidence regarding accountability for taxpayers and policymakers regarding these initiatives and evidence of the return on investment as illustrated by outcomes across high school and the labor market in particular.
To recap the main findings, credential earning is positively associated with high school completion but negatively associated with college-going and attainment. In the labor market, however, the improved outcomes appear to favor credential earners and CTE concentrators, at least for the first five years after high school, after which credential earners no longer see an income premium (though CTE concentrators continue to exhibit higher expected income through year 7). Further, we find evidence that earning a credential may be most beneficial when combined with CTE concentration. There is also some initial evidence that IWIP-designated credentials may be particularly beneficial for students as they enter the labor market. The finding that male students are more likely to experience higher income premiums from earning credentials aligns with our cluster-specific analyses. Specifically, the fields in the Enduring IRCs group—construction, law and public safety, manufacturing, and transportation—are historically male-dominated jobs (Roche et al., 2016; U.S. Department of Labor, 2025).
Based on these findings—and considering the existing policy initiatives in Ohio—there are a handful of implications worth discussing here. First, workforce development policies emphasizing credential earning in high-priority fields, such as IWIP, likely support students’ entry into the labor market. As mentioned previously, the annual IWIP set-aside was recently increased substantially. However, the state also recently decided to no longer reimburse non-IWIP credentials to any extent. With this in mind, there are two important future trends worth monitoring: (1) whether there is an impact on the number of IWIP credentials earned by students in the coming years and (2) what happens to pursuit of non-IWIP credentials. This second point is particularly relevant, given that three of the five most historically popular credentials with the largest income premiums by year 6 (e.g., ICAR Collision Repair, ASE Suspension & Steering, and ASE Engine Repair; table B.17) would not have been designated as IWIP credentials. On the other hand, the credential associated with the highest income premiums (AWS Certified Welder) does now carry the IWIP designation. Given the relative youth of IWIP, it will be worth keeping an eye on whether credentials reimbursed under IWIP produce strong labor market outcomes moving forward.
Second, the potential labor market benefits that come with earning credentials shine light on an important issue related to access to career-related opportunities. The first report in this series presented two relevant points to this issue (Plasman, 2025). First, the proportion of credentials falling under IWIP designation has increased rapidly, with the joint vocational school districts (JVSDs, or “career centers”) that provide career-related education to approximately half the CTE students in the state producing nearly 80 percent of IWIP credential earners in 2022–23.[23] The second point relates to the differences in demographic characteristics of students who attend career centers, as opposed to traditional high schools. Traditional high schools are more likely to serve economically disadvantaged students and Black students, whereas career centers are more likely to serve students with disabilities, thereby suggesting differential access to IWIP programs for different student populations. The finding that economically disadvantaged students saw lower income premiums from earning credentials suggest that these students may have more limited access to high-value offerings such as those identified under IWIP. These findings align with work related more broadly to CTE participation in Connecticut that middle-income students see higher income premiums (Brunner et al., 2021). In light of this result, the state should look to ensure access to IWIP offerings for students in these traditional high schools.
Third, there are important differences in labor market outcomes based on key student characteristics, gender in particular, and the cluster in which a credential falls. Of the six clusters in which a substantial majority—60 percent or more—of credential earners are female, only health shows positive income premiums beyond year 3, and health only shows benefits for one additional year. Meanwhile, of the five clusters in which a substantial majority are male, only IT has poor labor market returns. This result also aligns with prior work, which in this instance found that male students are more likely to benefit on the labor market from participation in CTE (Kemple & Willner, 2008). In our work, this is a particularly noteworthy finding, given the state’s inclusion of health and education (and IT) credentials on the IWIP designation list. While these fields are indeed identified critical for the state (six of the top eight “critical” careers fall into either the health field or the education field as defined by Ohio’s Top Jobs List), many of these careers do not meet the threshold of paying a living wage (defined in Ohio as approximately a $42,400 annual salary; Living Wage Institute, 2025).
Finally, our results show evidence that students are likely to experience larger income premiums if they pair credential earning with CTE concentration. As the state looks to review high school graduation requirements as they relate to demonstration of career readiness, future iterations of this policy may seek to better emphasize linked career-education opportunities as opposed to a single opportunity such as credentials or CTE concentration. Specifically, policymakers could require students to demonstrate career readiness through earning a high-value credential alongside completing a CTE concentration in the same pathway. Recent federal initiatives related to the Perkins Act have focused on developing and encouraging students to pursue stackable credentials (Center for Occupational Research and Development, 2021). With this in mind, a high-value credential could therefore be defined as one that has direct links to further credentials, ties to a specific career, and provides positive income premiums. By requiring a more robust career readiness graduation indicator, the state could help students better progress along a specific career pathway that could include additional education.
One additional consideration relevant to scholarship and practice relates broadly to the idea of college and career readiness. While there is evidence that career-related educational opportunities such as CTE coursework and credentials have become more rigorous and relevant over time as is encouraged by the federal Perkins Act (Plasman et al., 2020a, 2020b), this report suggests that there may be some key differences related to college readiness and career readiness. While we show there is a relationship between earning a credential and later income premiums (at least in the short term), credential earning is also negatively related to postsecondary education. In other words, there is still a likely divide suggesting the development of either college or career readiness, and credentials are much more strongly related to the latter (at least as measured by college-going and income). This finding mirrors some of the implications from Giani’s (2022) report on credentials and related commentary (Plasman, 2022).
Final Thoughts
Based on our work here in Ohio, this study presents strong evidence that credentials can help prepare students to succeed in the labor market, at least in the early years. However, the truth is that most careers now require some level of postsecondary education or training (Carnevale et al., 2018). Credentials are meant to provide avenues into college (by helping students develop interests in certain careers and by providing students with college credits through articulation agreements) and careers (by providing students with tangible evidence of skill attainment that employers desire). This brings up important considerations regarding the future of industry-recognized credentials. If we (e.g., policymakers, practitioners, scholars, etc.) decide that the purpose of credentials is only to prepare students for the labor market, then they appear to be fulfilling their purpose. However, if we decide that credentials also should provide a more direct path into postsecondary education or training, we need to reconsider how to make this a reality, too.
Center for Occupational Research and Development. (2021). Introduction to stackable credentials. Office of Career, Technical, and Adult Education; U.S. Department of Education.
I offer my deepest gratitude to Dr. Jay Plasman for his fine work carrying out this project. Special thanks to the Ohio Department of Education and Workforce, the Ohio Department of Job and Family Services, and the Ohio Education Research Center for providing the data that made possible this report. On the Fordham Institute team, I thank Chad L. Aldis, Chester E. Finn, Jr., David Griffith, Amber M. Northern, and Michael J. Petrilli for reviewing drafts and offering feedback. Thanks is also due to Dr. Shaun M. Dougherty of Boston College and Dr. Stéphane Lavertu of The Ohio State University for providing expert feedback on the report. David Yontz copyedited the manuscript, and Andy Kittles produced the layout of the report. This report was funded in part by the College Board. Any opinions, findings, and conclusions or recommendations expressed in this material are those of the author(s) and do not necessarily reflect the views of the College Board. The report was also funded in part by our sister organization, the Thomas B. Fordham Foundation.
Aaron Churchill
Ohio Research Director, Thomas B. Fordham Institute
Endnotes
[1] These percentages reflect students who earn at least twelve points in Ohio’s system that assigns points, from one to twelve, to each credential.
[2] This theory would be consistent withother studiesshowing that labor market forces (e.g., minimum wage increases or economic development) decrease participation in education.
[4] Differences in high-school graduation rate, postsecondary enrollment, and income are calculated as predicted probabilities/values; see appendix A.2.5 for details on calculations and table A.3 for predicted values.
[5] For more information on the Industry-Recognized Credential Seal, visit the Ohio Department of Education and Workforce’s (ODEW) IRC Seal webpage, linked here. For more information on the general Graduation Seal requirement, visit ODEW’s Demonstrating Readiness page.
[6] Ohio’s credentials are each assigned a point value, ranging from one to twelve, based on industry feedback and labor market research related to demand for the credential and related careers. Points are used as a baseline in determining whether students can use credentials to meet high-school graduation requirements.
[7] The Ohio Department of Higher Education awards college credit for a variety of different educational experiences in high school through different transfer credit agreements. Specifically, the Industry-Recognized Credential Transfer Assurance Guides guarantee college credit for anyone who earns an approved IRC. (See here for more details.)
[8] See Appendix A for full details on data and methodology
[9]See this link for the full first report, which provides additional contextualization for this current study.
[10] Work-based learning (WBL) is another core aspect of CTE programming in high schools. However, because of data limitations, we are unable to evaluate the role of WBL on these outcomes at this time.
[11] Full results on high school graduation are presented in appendix table B.1. These estimates remain stable under multiple different robustness checks that take into account the changes in graduation requirements over time that allow credentials to count toward graduation requirements. Additionally, table B.21 presents predicted values associated with estimates from our main analyses (e.g., high school graduation, postsecondary enrollment and attainment, employment status, and income).
[12] Table B.2 in the appendix presents the results of these same analyses limited to the cohort of students expected to graduate in 2016. This ensures a uniform time period to have potentially earned a postsecondary degree of seven years. Overall conclusions are the same: IRCs and CTE concentration are negatively related to each of the identified postsecondary outcomes. Table B.19 presents the results of our inverse probability matching results for high school and postsecondary outcomes. Under this more rigorous estimation strategy, we find very similar results as under our baseline approach.
[13] Given the availability of data and the relative newness of the IWIP initiative, it does not make much sense to look at most of the outcomes associated with earning an IWIP or non-IWIP credential. However, we do have enough data to look at whether students in the post-IWIP authorization period enrolled in postsecondary education (see table B.3 in the appendix). Both IWIP and non-IWIP credentials were associated with about a 10-percentage-point lower likelihood of college enrollment. Notably, the combination of CTE concentration and non-IWIP credential earning is associated with a 16-percentage-point lower likelihood of postsecondary enrollment, compared with an 8-percentage-point lower likelihood for CTE concentration with IWIP IRCs.
[14] There are a few important points to note regarding employment outcomes. First and foremost, labor market information is pulled from the Ohio unemployment insurance (UI) dataset. There are two potential reasons an individual wouldn’t show up in the UI dataset. First, if an individual earned money in a different state, they would not show up. Second, if an individual was never employed, they also would not show up. For this reason, if an individual does not show up in the dataset in a given year, they are dropped from the related analysis because it is not possible to distinguish between the above two scenarios. Nationally—and within Ohio—a large majority of students remain in state after high school for both college and later employment (Hillman, 2023; Ohio Department of Higher Education, 2023). As such, we have a good deal of confidence our analyses capture most Ohio high school students.
[15] For this study, we include up to seven years of post–high school employment data depending on the student’s cohort. So “ever hold a job” refers to this time period of up to seven years after high school. Again, this is identified as reported income in Ohio.
[16] We ran a series of robustness checks based on levels of CTE participation, as well as observed and expected college-going. With respect to CTE participation, we first examined the credential-to-income relationship separately for CTE concentrators and non-concentrators (table B.6). Credentials were beneficial to both groups initially but remained significantly associated with higher income premiums for CTE concentrators even through year 7. We also ran a model in which we limited our analytic sample only to those students who had some level of CTE participation (i.e., took at least one CTE course; table B.7). The overall results are nearly identical to the full population. For college-going, we first ran an analysis limited to students who were never observed as enrolling in postsecondary education. We found the relationship between credential earning and later income for non-college-goers to be comparable to our full sample (see table B.5). We ran an additional analysis focusing only on those students who graduated from high school, again with similar results (see table B.8). We ran a second set of sub-analyses looking at students based on their probability of going to college (calculated using baseline achievement and demographic factors). For students expected to go to college but who ultimately did not, we observed large income premiums associated with earning a credential in the three years immediately after high school. However, by year 4, this relationship is no longer evident, and it is significantly negative in year 5. In contrast, the group of students who were not expected to go to college and who did not, the immediate benefit of credentials on their own is relatively smaller but remains positive and significant through year 5. (Though not significant in year 6, the estimate is still positive.) Tables B.9 and B.10 in the appendix present the full results of these analyses.
[17] Table B.11 in the appendix provides another interpretation of this relationship between earning an IRC and earned income in a given year. Specifically, the table shows the expected income benefits of earning an IRC for a single cohort (the graduating class of 2016) over time, helping to provide further evidence that potential differences are not due to changes in policy emphases on earning IRCs (e.g., IWIP or high school graduation requirements). Table B.20 presents the results of our labor market analyses using an inverse probability weighting approach as a robustness test. Under this more rigorous estimation strategy, we find similar results as under our baseline approach.
[18] While Figure 4 here shows only the credential relationship with income, it does not account for the interaction with CTE concentration. The full results when accounting for the interaction with CTE concentration are presented in tables B.12 and B.13 in the appendix. As with credentials generally speaking, there is evidence that students who earn IWIP credentials and have a CTE concentration or students who earn non-IWIP credentials along with having a CTE concentration do continue to see expected income boosts across the seven-year time period.
[19] See data and methodology description in Appendix A for a detailed description of how IRC cluster fields were determined. Briefly, this is essentially a measure of whether a student earned an IRC and concentrated in the same field or earned an IRC that is unique to the identified field.
[20] Agricultural and environmental systems, arts and communication, business and administrative services, construction technologies, education and training, engineering and science technologies, finance (no IRCs), health science, hospitality and tourism, human services, information technology, law and public safety, manufacturing technologies, marketing (no IRCs), and transportation systems. There were a number of students who earned an IRC that was cross-listed with multiple different clusters and who did not concentrate in the associated field. These students were deemed to have earned a cross-cluster credential, which makes up our fourteenth credential cluster.
[21] While not presented in the main body, table B.17 presents results for estimated income premiums associated with earning specific credentials. To identify these credentials, we focused on the fifteen most common credentials awarded to incoming ninth-grade cohorts of 2013–14 and 2014–15. The top two credentials—CPR and OSHA 10—are excluded from this analysis, as they are not typically related to one specific field, nor are they typically identified in specific job requirements (Poiner, 2024). As such, we included the next two most awarded credentials, allowing us to focus on the fifteen credentials that were most likely related to the labor market. Five of these credentials—AWS Certified Welder, NCCER Core, ASE Suspension & Steering, ICAR Collision Repair, and ASE Engine Repair—remained significantly related to positive income premiums in year 6. Three others—Cosmetology License, ServSafe, and Adobe-Photoshop—were negatively related to income in year 6.
[22] Note that though hospitality presents a negative relationship, it is not significant in either year 6 or year 7.
NOTE: Today, the Senate Higher Education Committee heard testimony on Senate Bill 345. The bill would, among other things, create an incentive structure for Ohio colleges to better support students through their postsecondary education and to earn a degree or credential. Fordham’s Vice President for Ohio Policy provided the following proponent testimony. It is identical to his testimony previously presented on House Bill 644, which is the House companion version of SB 345.
Ohio has made meaningful progress in expanding access to higher education, but access alone does not guarantee success. Too many students, especially those from low-income backgrounds, enroll in college but do not complete a credential. That reality carries real consequences for individuals, families, and the state’s workforce. Senate Bill 345 represents a practical, research-driven effort to improve those outcomes.
Overview of Senate Bill 345
At its core, Senate Bill 345 is about encouraging colleges to invest in strategies that have been shown to work. The bill creates a dedicated fund and competitive grant opportunity that allows public institutions to pilot, expand, and evaluate programs aimed at improving student success.
Rather than funding initiatives based on good intentions alone, the proposal emphasizes approaches supported by credible research and measurable results. Institutions seeking support must clearly articulate how their proposed efforts will improve outcomes such as retention, completion, and time to degree, and how those efforts will be evaluated over time.
The bill also places a strong focus on serving students who face the greatest barriers to success, ensuring that new investments are aligned with Ohio’s broader goals around equal opportunity and workforce readiness.
Why Evidence-Based Investment Matters
We are not starting from scratch when it comes to improving college completion. A growing body of research shows that certain types of student support—such as structured course pathways, proactive advising, and targeted financial assistance—can significantly improve both graduation rates and long-term earnings.
One of the most compelling examples comes from Lorain County Community College’s SAIL program, which is built on the nationally recognized ASAP model. Evaluations of the ASAP approach in Ohio found that students receiving these supports completed degrees at substantially higher rates than their peers—35 percent compared to 19 percent after three years (and 46 percent to 31 percent after eight years).
The benefits extend well beyond graduation. Years after participating, students in these programs are earning more, with average wages about 14 percent higher than comparable students who did not receive the same support. These results demonstrate that well-designed interventions can meaningfully change students’ trajectories.
Why a Competitive Grant Program Makes Sense
Senate Bill 345 takes a disciplined approach by requiring institutions to compete for funding based on the strength of their proposals. This ensures that resources are directed toward colleges that are ready to implement thoughtful, research-backed strategies and not just another mandate that puts another program on their plate.
This structure also helps address a common challenge in higher education finance. Ohio rightly rewards institutions for improved outcomes in its funding system, but there can be a delay between when a program is launched and when those results actually generate improvement. A targeted grant program can help institutions cover the upfront costs needed to get effective programs off the ground.
In this way, the bill supports innovation while maintaining accountability. Colleges must define clear goals, measure progress, and plan for long-term sustainability beyond the initial grant period.
Conclusion
Senate Bill 345 is a strong example of policy grounded in evidence and focused on results. It creates a pathway to extend a successful program in Lorain while at the same time opening the door to more innovative efforts. By encouraging institutions to adopt proven models, Ohio can move more quickly toward a system where student success is the norm rather than the exception.
This bill will likely help more Ohioans earn meaningful credentials, improve their economic prospects, and contribute to the state’s long-term prosperity.
Thank you for the opportunity to provide testimony.
NOTE: Today, the Ohio Senate Education Committee heard testimony on Senate Bill 328. It would, among other things, improve on the state’s workforce readiness and career-connected learning initiatives for K-12 students. Fordham’s Vice President for Ohio Policy provided the following proponent testimony.
Ohio has made real progress over the past several years in expanding career-connected learning. Students have more opportunities today than they did a decade ago. But despite that progress, too many students still move through school without a clear sense of what comes next or how their education connects to their future.
Senate Bill 328 takes an important step toward fixing that. This testimony will focus on three parts of the bill that will likely have the greatest impact: the middle school career exploration requirement, the new approach to academic and career planning, and the return on investment initiative.
Let’s start with middle school.
One of the most valuable aspects of this bill is that it doesn’t wait until high school to begin career-related conversations. It requires schools to provide students in grades 6 through 8 with meaningful exposure to careers, including hands-on experiences, financial literacy, and at least one structured career coaching session.
That matters more than it might seem at first glance.
Right now, we typically expect students to make important decisions early in high school—what courses to take, whether to pursue career-technical education, how to think about college or training programs—without ever having explored their interests in a serious way. For many students, those decisions are made with very little context.
This bill helps change that by making sure students have time before high school to explore options, reflect on their strengths, and think about what they might want to pursue. Research and experience both tell us that those early exposure opportunities—job shadowing, career speakers, and even simple interest inventories—can make a real difference in how students engage with school and the choices they later make.
It’s much easier to build a coherent pathway when students have had a chance to see what’s out there.
That leads directly to the second piece: academic and career planning.
Senate Bill 328 asks students, beginning in eighth grade, to create a plan that goes beyond just earning a diploma. Instead of focusing narrowly on graduation requirements, students will be asked to think about their interests, their goals, and the steps needed to get where they want to go.
That shift is significant.
Too often, planning in high school is treated as a compliance exercise—something to check off rather than something that meaningfully guides decisions. The approach in this bill is different. Plans must be updated each year, they must reflect real experiences like career exploration and work-based learning, and families are expected to be part of the process.
That combination—starting earlier, revisiting plans regularly, and involving families—makes it much more likely that these plans will actually matter.
And frankly, they need to. As we’ve seen, many students graduate without a clear sense of direction, which makes the already difficult transition to college or the workforce even harder. Helping students connect their coursework to real goals is one of the most practical ways to address that problem.
Finally, I want to touch on the return on investment initiative.
Ohio has invested a great deal in education and workforce programs. But it’s often hard for students, families, and policymakers to see which pathways are leading to strong outcomes. This initiative is designed to change that by connecting data across agencies and making it more useful and accessible.
That includes information on things like employment outcomes, wages, and how well different programs are preparing students for what comes next.
That kind of transparency is long overdue.
Students and families should be able to see, in clear terms, what different pathways lead to. Educators should have better feedback on what’s working. And policymakers should be able to make decisions based on evidence, not guesswork.
Taken together, these three components—early career exploration, meaningful planning, and better data—fit together in a way that strengthens the overall system.
Students explore options earlier. They build and refine a plan over time. And the state provides clearer information about which pathways deliver results.
That’s a coherent approach, and it builds directly on the work that Ohio has already done.
Senate Bill 328 doesn’t try to reinvent everything. Instead, it fills in some important gaps and makes existing efforts more connected and more effective. It’s a good bill, and I would urge you to pass it without too many changes. Some of the amendments that have been discussed, especially around the middle school career exploration requirement, pose a significant risk of watering down the requirement to the point of making it almost irrelevant. I urge you to resist those efforts.