How do the English Learners who enroll in public charter schools compare to their peers in traditional public schools? Which sector is getting the best results with this student group, which now includes one in six American students? And how have English Learners’ academic outcomes evolved in Texas, a state that is home to a fifth of the country’s English Learners—and where the number of English Learners in charter schools has quintupled over the past decade?
Conducted by Oklahoma University’s Deven Carlson, this study uses nearly two decades of student-level data to explore how charter school enrollment is related to Texas English Learners’ achievement, attainment, and earnings.
To read the full report and its implications for educational leaders and policymakers, scroll down or download the PDF.
Foreword
By Michael J. Petrilli and David Griffith
As most readers are at least dimly aware, the number of English Learners in U.S. schools has increased in recent decades. Yet, unlike racial categories (which are more or less permanent) the “EL” designation is meant to be temporary. Consequently, even seasoned education policymakers tend to underestimate the number of “ever EL” students.
Because states aren’t required to report this number, clarity on this point is surprisingly hard to come by; however, based on the data we do have, it seems likely that the “true” figure is closer to 15 percent[1] than 10 percent (which is the figure that’s usually cited). And it may be higher. For example, 19 percent of students in California are current English Learners, but another 16 percent are former English Learners.[2]
Like other student groups, students in both of those categories are increasingly served by charter schools. Yet, in part because of the aforementioned data issues, our knowledge of how well they are served in these schools hasn’t kept pace with this growth. For example, we have little sense of how the rapid expansion of charters’ enrollment share within the English Learner population has affected their performance vis-à-vis this population. Nor, with the notable exception of English Learners in Boston,[3] do we know much about the long-term outcomes of English Learners who enroll in charters, or about how the sector is approaching the unique challenges (and opportunities) that are associated with educating this population.
Importantly, while some studies suggest a positive relationship between charter school attendance and English Learners’ academic progress,[4] questions about the validity of these estimates have persisted,[5] along with questions about whether charters are pulling their weight when it comes to the number and types of English Learners they serve.[6] Because most parents of English Learners aren’t fluent in English, concerns have also been raised about how non-English-speaking families learn about, evaluate, and access schools of choice in a country where most official business is conducted in English.[7]
Finally, it’s worth noting that English Learners as a group were particularly affected by pandemic-related school closures – and have yet to recover.[8]
For all of these reasons, we decided it was time for a closer look at the educational experiences and outcomes of English Learners in charter schools. And upon further investigation, it became increasingly clear where we needed to be looking.
Currently, about one in five English Learners in the United States lives in Texas, which is also home to one of the country’s largest and fastest-growing charter sectors. In the past decade, the number of English Learners in the Lone Star State’s charters has quintupled to about 125,000 students. And the state has also served as a launching pad for some of the country’s biggest charter school networks, including KIPP, IDEA, and Harmony (to name just a few).
To conduct the analysis we envisioned, we recruited University of Oklahoma Associate Professor Deven Carlson, who is well-known for his work on charters[9] and the experiences of English Learners.[10] And to ensure that Dr. Carlson received the best possible advice, we also reached out to Elizabeth Setren (whose study of English Learners in Boston charters remains the gold standard) and Will Fullerton (who was chief of staff at the Texas Education Agency when the sector experienced some of its fastest growth).
Finally, to provide some context for the results, we decided to talk to practitioners. Specifically, we conducted fifteen semi-structured interviews with principals and other leaders of high-performing charter and traditional public schools with unusually high concentrations of English Learners.[11] On the charter side, we talked to superintendents, bilingual education coordinators, and principals from the IDEA, Harmony, Uplift, Yes Prep, Vanguard, and Step networks. On the traditional public school side, we spoke with principals and other leaders of high-performing schools in Houston, Dallas-Fort Worth, Austin, and the Lower Rio Grande Valley.
To our knowledge, the result of all this activity is the first truly large-scale study to control for factors such as students’ baseline English proficiency when estimating “ever EL” students’ academic progress in charters. (After all, the state of Texas has more English Learners in charter schools than the city of Boston has K-12 students of any description.)
Similarly, we believe this is the first truly large-scale study to examine the relationship between “ever EL” students’ charter school enrollment and longer-term outcomes such as postsecondary enrollment and earnings.
In short, this study broadens, deepens, and updates our understanding of an important and somewhat underappreciated national phenomenon.
So, what did we find?
Finding 1: Charter schools now enroll a disproportionate share of Texas’s English learners.
Finding 2: Compared to their traditional public school peers, English Learners in Texas’s charter schools make somewhat more progress in reading but slightly less progress in math.
Finding 3: Compared to their traditional public school peers, English Learners in Texas’s charters are more likely to graduate high school and enroll in college, and they earn more money in the post-college years.
Finding 4: As Texas’s charter sector has expanded, English Learners’ reading gains have remained relatively consistent, but their math gains have fluctuated.
On the strength of these findings, we draw the following conclusions.
1. Overall, English Learners in Texas are benefitting from attending charter schools.
As noted, English Learners in charters are significantly more likely to graduate high school and enroll in a four-year institution. Moreover, they earn considerably more in the years after college, suggesting that those students who enroll in college tend to benefit from it.
2. In Texas, as elsewhere, the charter school movement will not meet its goals unless rapid expansion is paired with appropriate accountability and funding.
Per Finding 4, the progress that English Learners in Texas charter schools made in math declined rapidly in the first half of the study period but improved significantly in the second half, consistent with prior research by the Center for Research on Education Outcomes that suggests that accountability and funding reforms enacted in 2013 led to broader improvement in the Lone Star State’s charter sector.[12] Accordingly, we urge the Texas Board of Education (and other charter school authorizers in other states) to continue to set a high standard for the approval of new charter schools and to close schools that are consistently low-performing. Similarly, we urge lawmakers in Texas (and other states) to remain committed to equitable charter funding. Over time, adhering to these basic principles should lead to further increases in charter school quality, even as the sector continues to expand.
3. In some cases, efforts to boost English Learners’ reading achievement may be coming at the expense of their math achievement.
Perhaps the most difficult question raised by the report is why English Learners in Texas’s charter schools are seeing more progress in reading, while those in the state’s traditional public schools are making (slightly) more progress in math; however, based on our conversations with educators in both sectors, we believe that two hypotheses deserve consideration.
First, the fact that charters are schools of choice means they may be more responsive to the demands of some English Learners’ parents for more English instruction and/or English-focused supports (see How do parents of English Learners in Texas want their children educated?). And despite the positive tenor of the findings, there may be trade-offs associated with this preference. Notably, a significant body of research finds that dual immersion programs, which are among the least English-intensive approaches, tend to get the strongest results, though much of this research is associational.[13]
Second, the general shortage of bilingual educators in Texas, the regulatory hurdles associated with bilingual and/or ESL programming, and the fact that charters tend to recruit their teachers from a different pool of potential applicants than traditional public schools may make it particularly difficult or unappealing for the state’s charter networks to staff an “official” bilingual program (see What do Texas educators say is the biggest barrier to serving English Learners effectively?). In other words, some combination of limited supply and unmet demand may be conspiring to produce a somewhat different set of learning environments in the charter school context.
In addition to these factors, it seems likely that there are philosophical differences between educators in charter and traditional public schools – such as a preference or distaste for data-driven instruction – that have implications for English Learners’ education (see Which approaches to English Language instruction do Texas Educators support?). However, after speaking with leaders in both sectors, our sense is that their personal experiences – including but not limited to growing up in an English- or Spanish-speaking community or household – matter far more than the distinction between traditional public schools and charters.
As Steinbeck famously wrote after traversing the state with his poodle, “Texas is a nation in every sense of the word.” In other words, it might just be big enough, diverse enough, and indisputably American enough to tell us something important about where the rest of the country’s K-12 education system is heading. If so, we have reason to be optimistic about the growing number of English Learners served by charter schools.
Introduction
Thanks to rapid increases in the state’s Hispanic and Asian populations, the number of Texas students classified as English Learners has surged in the past decade, from approximately 830,000 in 2010 to more than 1.1 million today.
In the charter sector, change has been even more rapid. In 2010, 16 percent of charter students in Texas were classified as English Learners. Yet by 2021, that figure had nearly doubled to just under 30 percent, even as the share of all Texas students who enrolled in charters also doubled (and then some). Consequently, the total number of English Learners in Texas charters has quintupled in the past decade, from less than 25,000 in 2010 to nearly 120,000 in 2021.
The rapid growth in Texas’s English-Learner population puts a premium on analyzing the educational experiences of this student group, and the disproportionate share of this growth that has occurred in the state’s charter sector makes it particularly important to understand how English Learners in that sector are faring. Accordingly, this report addresses three research questions:
1. How do the English Learners who enroll in Texas charter schools compare to their peers in traditional public schools?
2. How do the academic and economic outcomes of English Learners in Texas charter schools compare to those of their peers in traditional public schools?
3. How have the academic outcomes of English Learners in Texas charter schools evolved as the number of English Learners in charters has increased?
To address these questions, this report uses student-level data spanning much of the first two decades of this century and a wide range of analytic techniques. In so doing, it brings important new evidence to bear on the educational experiences of one of the fastest-growing student populations in one of the fastest-growing sectors in one of the fastest-growing states in the country.
Background
While both English Learners and charter schools have been the subjects of numerous studies, only a handful of analyses have examined the academic performance of English Learners in charters. Of these, perhaps the most well-known have been published by the Center for Research on Education Outcomes (CREDO), which has conducted a series of studies comparing the math and reading achievement growth of all students, including English Learners, in charter and traditional public schools. Yet when it comes to English Learners, the results of these studies are all over the map, both literally and figuratively.
Some CREDO studies, including those conducted in Washington State, California, and New Jersey, as well as CREDO’s National Charter School Study, find that English Learners in charters make significantly more progress than their traditional public school peers; however, a second set of studies, including those conducted in South Carolina, New Mexico, Pennsylvania, Idaho, Indiana, and Florida, find no significant difference between the two sectors. And a third group of studies, including analyses conducted in Ohio, Massachusetts, and Michigan, find that English Learners make significantly less progress than their traditional public school peers.
CREDO has also published three reports with information on English Learners’ performance in Texas charters—in 2009, 2015, and 2017. The 2009 report, which analyzed data from the 2002–03 to 2006–07 school years, concluded that English Learners in Texas charters outperformed their traditional public school peers in reading, while exhibiting no significant difference in math achievement gains. The 2015 report, which analyzed data from the 2007–08 through 2012–13 school years, found that English Learners in charters made more progress than their traditional public school peers in both reading and math (though the differences in math were small). Finally, the most recent report, which gauged charter performance from 2011–12 through 2014–15—thus overlapping with the 2015 report—found that English Learners in charters made slightly less academic progress than their traditional public school peers, though these differences were small and statistically insignificant.
In addition to CREDO’s work, a rigorous study that leveraged thirty admissions lotteries held by Boston charter schools between the 2003–04 and 2014–15 school years found that charter enrollees were more than thirty percentage points less likely to be classified as English Learners.[14] This reduction in English-Learner classification was accompanied by immense gains on both standardized tests and the likelihood of postsecondary enrollment. Indeed, charter school enrollment boosted the probability that English Learners attended college by more than twenty-five percentage points.
Needless to say, Boston isn’t Texas. And it’s tough to say whether or how findings from a single northeastern city with a relatively small English-Learner population and one of the highest-performing charter sectors in the country generalize to a state with more English Learners than Boston has students. In contrast, while the CREDO reports contain valuable information on the relative performance of English Learners in the charter and traditional public school sectors, that was not their focus. Consequently, they don’t consider the full range of available data on English Learners, such as their home language or test-based measures of English proficiency. Nor do they consider how charter school enrollment is associated with long-term outcomes such as high school graduation, postsecondary enrollment, and earnings.
In short, the literature on English Learners in charters is broad. But with the exception of the aforementioned Boston study, it is not deep.
The Texas context
Federal law requires districts, including those that consist of one or more charter schools, to identify students who may benefit from English-language services. In Texas, districts in both sectors identify these students by administering a home-language survey to every student that includes two questions: (1) “What language is spoken in the child’s home most of the time?” and (2) “What language does the child speak most of the time?” If the answer to either of these questions is anything other than English, the district administers the Texas English Language Proficiency Assessment System (TELPAS), which informs the English-Learner classification.[15]
In principle, parents can always opt out of English-language services (see “How does Texas educate its English Learners?”). But in practice, both identification and deidentification are typically determined by students’ performance on the TELPAS. To exit English-Learner status, students in Texas must receive a score of “advanced high” on the TELPAS. And because of the stringency of this requirement, a nontrivial share of the state’s English Learners are never formally deidentified.
It’s no exaggeration to say that Texas is ground zero for English-Learner education in the U.S. As noted previously, more than one million K–12 students in the state—about 20 percent of all Texas public school students—are classified as “emergent bilinguals” (though to avoid confusion, this report uses the term “English Learners”). Collectively, Texas’s public schools serve nearly one in five English Learners in the United States. About 95 percent of Texas school districts enroll at least one English Learner. And a meaningful number of English Learners can be found in almost every corner of the state, from the Rio Grande Valley to major cities such as Dallas-Fort Worth, Houston, San Antonio, and Austin, as well as more rural areas.
While about 83 percent of Texas’s English Learners speak Spanish at home, more than a hundred different languages are spoken by at least one English Learner’s family. Similarly, there is wide diversity when it comes to English Learners’ levels of English proficiency, racial and ethnic backgrounds, and any number of other characteristics.
For these and other economic, cultural, and institutional reasons, programming for Texas’s English Learners also varies widely (see below).
How does Texas educate its English Learners?
In Texas, as elsewhere in the country, most approaches to educating English Learners can be thought of as falling on a broad language-delivery continuum (see Figure 1). At one end of this continuum are traditional English-as-a-second-language (ESL) programs, which tend to be more English-centric. These include “content-based ESL” (in which all instruction is theoretically conducted in English) and “pull-out ESL” programs (in which non-English pull-outs supplement predominantly English instruction).
Bilingual programs, which rely less on English, can be divided into “transitional” and “dual immersion” programs. In the former, English instruction is phased in gradually and ultimately replaces instruction in a student’s home language, with “early exit” transitional programs phasing in English more quickly and “late exit” transitional programs phasing it in more slowly. In dual immersion programs, approximately half of instruction is in English and the other half in some other language (typically Spanish), and the goal is full proficiency in both languages. Per the figure, dual immersion includes “one-way” options, wherein the typical class consists primarily of Spanish-speaking students, and “two-way” options, wherein the typical class consists of a mix of English and Spanish speakers.
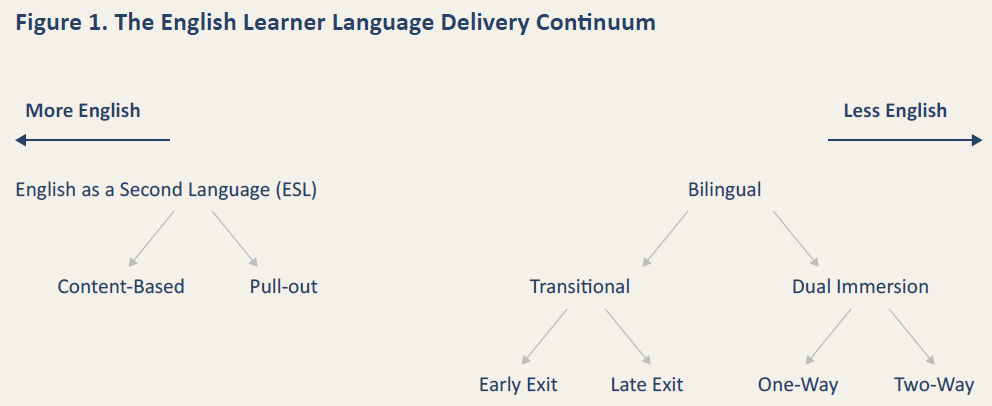
As bilingual programs, dual immersion and transitional programs are subject to different rules and regulations than ESL programs. For example, regardless of sector, most teachers in bilingual education programs must be bilingual certified (as opposed to ESL certified), meaning they must be sufficiently fluent in both English and Spanish (or another language) to pass the state’s bilingual certification exam.
In theory, Texas law requires any traditional school district or charter school network with more than twenty English Learners in a single grade level to establish a bilingual education program. Similarly, any district with at least one but fewer than twenty English Learners is required to establish an ESL program. However, in practice, the Texas Education Agency can grant exemptions to districts or charter networks that are unable to staff such a program. And because of the increasingly acute shortage of ESL and bilingual certified teachers,[16] a growing number of teachers in ESL and bilingual programs are the beneficiaries of ESL or bilingual education waivers.[17]
For these and other reasons, over half of Texas’s English Learners are still enrolled in ESL programs, despite a growing body of research that finds dual immersion programming is associated with strong outcomes for students.[18] To address this challenge, Texas’s recently released “Emergent Bilingual Strategic Plan” calls for an increase in the number of bilingual programs and dual immersion programs in particular.[19]
Data and methods
This report takes advantage of two sets of annual records from the Texas Education Agency (TEA): (1) records with information on student characteristics and outcomes and (2) records describing school characteristics. The former contain a wide range of information, including the standard set of demographic characteristics. Demographics of particular interest for this report include students’ English Learner status, the language they speak at home, and an indicator for students’ immigrant status. In addition to these demographics, the records contain information on students’ test scores and high school graduation. And for students with an English-Learner classification, they also contain information on students’ English-language proficiency, as measured by the TELPAS. At the school level, the TEA records contain information on whether the school is a charter, its grade span, and the district and county in which it is located.
In addition to the TEA records, this study draws on information from the Texas Higher Education Coordinating Board (THECB), the National Student Clearinghouse (NSC), and the Texas Workforce Commission (TWC). Records from the THECB contain information on postsecondary enrollment, persistence, and completion for individuals enrolling in Texas postsecondary institutions. The NSC records provide comparable information for students attending college outside the Lone Star State. Finally, records from the TWC detail individuals’ quarterly earnings from employers who are required to pay into Texas’s Unemployment Insurance (UI) system—a group that includes almost all employers in the state, except for self-employed individuals.
In most cases, these records begin in the early- to mid-2000s, allowing this report to characterize English Learners’ educational experiences and outcomes over a period of nearly two decades; however, while more recent data exist, the end point for most analyses is the 2018–19 school year, as there is simply too much uncertainty about data quality and comparability during the years affected by Covid-19.
In general, these analyses rely on regression techniques, which account for factors related to both English-Learner status and the outcome of interest, thus producing a better “apples-to-apples” comparison. In most cases, these models account for both standard demographic characteristics (e.g., student race/ethnicity, sex, and economic disadvantage) and factors more directly relevant to English-Learner education, such as immigrant status, home language, and English proficiency (as measured by the TELPAS). Importantly, the models also account for county of residence, meaning that they compare the outcomes of English Learners in the charter and traditional public schooling sectors who reside in the same county.
Finally, in addition to analyzing administrative data, we conducted fifteen semi-structured interviews with principals and other leaders of high-performing charter and traditional public schools with unusually high concentrations of English Learners. On the charter side, we talked to superintendents, bilingual education coordinators, and principals from the IDEA, Harmony, Uplift, Yes Prep, Vanguard, and Step networks. On the traditional public school side, we spoke with principals and other leaders of high-performing schools in Houston, Dallas-Fort Worth, Austin, and the Lower Rio Grande Valley. Themes from these interviews appear as sidebars throughout the report.
For a full description of the methods, see Appendix A.
Results
Our analysis of the aforementioned data sources yields four findings: First, charter schools now enroll a disproportionately share of Texas’s English Learners. Second, compared to their peers in traditional public schools, English Learners in Texas’s charter schools make somewhat more progress in reading and slightly less progress in math. Third, English Learners in charter schools are more likely to graduate high school and enroll in college, and they make more money in the post-college years. And finally, as Texas’s charter sector has expanded, English Learners’ reading progress has remained relatively consistent, but their progress in math has fluctuated.
See below for a more detailed discussion of each of these findings.
Finding 1: Charter schools now enroll a disproportionate share of Texas’s English Learners.
As noted previously, charter schools now enroll a disproportionate share of Texas’s English Learners. Per Figure 2, the average student in the charter sector now attends a school where 28 percent of students are classified as English Learners, compared to 22 percent for the average student in a traditional public school.

Notes: This figure shows the percentages of charter and traditional public school students who were classified as English Learners between 2003–04 and 2020–21. For example, in the 2020–21 school year, approximately 28 percent of charter school students and 22 percent of traditional public school students were English Learners. For each individual school year, the analytic sample is restricted to schools in counties that contain at least one traditional public school and at least one charter school.
Focusing on students who were ever classified as English Learners paints an even more dramatic picture. Per Figure 3, the average student in Texas’s charter sector now attends a school where nearly 40 percent of students held an English-Learner classification at some point.

Notes: This figure shows the percentages of charter and traditional public school students who were ever classified as English Learners between 2003–04 and 2020–21. For example, in the 2020–21 school year, approximately 39 percent of charter school students and 31 percent of traditional public school students were or ever had been classified as English Learners. For each individual school year, the analytic sample is restricted to schools in counties that contain at least one traditional public school and at least one charter school.
Figure 4 shows how the percentages of English Learners in charter and traditional public schools changed within individual counties between 2005 and 2019, revealing a broad shift toward charters overall.

Notes: This figure shows how the percentages of students who were English Learners in charter and traditional public schools changed in each individual county between 2005 and 2019. Larger dots represent counties with more students (for example, the largest dot is Houston). The two dotted lines indicate perfectly proportional distributions of English Learners across sectors. Counties where charters enrolled a disproportionately low percentage of English Learners fall below the dotted lines, while those where charters enrolled a disproportionately high percentage of English Learners fall above them. For example, charter schools in Houston enrolled a disproportionately low percentage of English Learners in 2005 but a disproportionately high percentage by 2019.
Per Figure 5, most English Learners in both sectors—about 88 percent in recent years—speak Spanish at home, though that number has been steadily declining in traditional public schools. In charters, English has historically been the second most frequently spoken home language; however, in recent years, only about 1–2 percent of the sector’s English Learners have come from homes where English is spoken most of the time, bringing them closer to traditional public schools. Finally, the percentage of English Learners whose home language is something other than English or Spanish has increased over time, though even today fewer than one in ten English Learners fall into this group. The most frequently spoken home languages after Spanish and English are, in order, Vietnamese, Arabic, and Urdu. In short, as charters have become a more popular option for English Learners, the home language profile of their English Learner population has come to more closely resemble that of traditional public schools.

Notes: This figure presents the distributions of English Learners’ home language in Texas’s charter and traditional public schools for the 2003–04 to 2018–19 school years. For example, in the 2018–19 school year, roughly nine out of ten English Learners in both sectors lived in homes where the primary language was Spanish. Information on a student’s home language is collected from all Texas parents when they enroll their child in a public school and does not necessarily reflect a student’s knowledge of English and/or other languages.
Broadly speaking, the trends in charter and traditional public school students’ English proficiency mirror the trends in their home language. For example, about 45 percent of English Learners in charters had a baseline English proficiency level of “beginning” in 2009-10, compared to 58 percent in traditional public schools (Figure 6). Yet by 2018–19, this gap was only half as large. Similarly, about 13 percent of English Learners in charters had “advanced high” baseline English proficiency in 2009-10. Yet by 2018–19, that number had declined to about 7 percent, versus 5 percent in traditional public schools.

Notes: This figure presents the distribution of students’ baseline English proficiency level as measured by the TELPAS in charter and traditional public schools for the 2009–10 to 2018–19 school years. The TELPAS collapses students’ composite scale score into four proficiency levels—beginning, intermediate, advanced, and advanced high. The figure begins with the 2009–10 school year to ensure that each student is observed for at least five years and to maximize the probability of capturing a “true” baseline English proficiency score. Per the figure, the share of English Learners in charters with “advanced” or “advanced high” baseline English proficiency declined between 2009–10 and 2018–19.
Finally, while English Learners’ baseline reading and math achievement is below average (compared to all Texas students), there is little difference between the two sectors’ achievement profiles, especially in more recent years (Figure 7). In short, as the percentage of English Learners in charters has grown, the English-Learner populations in the two sectors serve have become increasingly similar.

Notes: This figure presents the distributions of charter and traditional public school students’ baseline reading and math quartiles as measured by their TAKS/STAAR performance in the 2009–10 to 2018–19 school years. The figure begins with the 2009–10 school year to ensure that each student is observed in the data for at least five years and maximize the probability of capturing a “true” baseline achievement score. Although assessment data are provided in the form of student scale scores, for the purposes of analysis, they were standardized (using the statewide mean and standard deviation from the relevant test administration) and then binned into quartiles for each individual year based on the statewide distribution. Per the figure, roughly 75 percent of English Learners in charter and traditional public schools fall in the first or second quartiles of reading performance, and roughly 70 percent fall into the first or second quartiles of math performance.
Finding 2: Compared to their peers in traditional public schools, English Learners in Texas’s charter schools make slightly more progress in reading and slightly less progress in math.
Per Figure 8, charter school students who were ever classified as English Learners made slightly more progress in reading than their traditional public school peers but slightly less progress in math (estimates that restrict the sample to students who were actively classified as English Learners are available upon request). In both cases, the magnitude of the estimates is modest—0.026 standard deviations in reading and -0.017 standard deviations in math. For context, the reading gains are roughly equivalent to moving a student from the fortieth percentile to the forty-first percentile of reading achievement over the course of a school year.

Notes: This figure shows the difference between the annual reading and math achievement gains of Texas’s charter and traditional public schools’ English Learners’ in grades 3–8 after controlling for race/ethnicity, sex, economic disadvantage, immigrant status, home language, English proficiency (as measured by the TELPAS), and county of residence. Test scores were standardized at the grade-year level using the mean and standard deviation from the statewide population of test takers. The estimates reflect the experiences of students who were ever classified as English Learners. For context, a difference of 0.25 standard deviations is roughly equivalent to moving a student from the fortieth to the forty-first percentile of reading achievement over the course of a school year.
As the reading estimates suggest, charter schools in Texas reclassify English Learners as fully English proficient somewhat more quickly than traditional public schools do (Figure 9). For example, three years after English-Learner identification, about 20 percent of English Learners in traditional public schools were reclassified, versus 27 percent of English Learners in charters.

Notes: This figure shows the percentages of English Learners in charter and traditional public schools who retained their identification status up to eleven years after entering the dataset. For example, after three years in the dataset, 27 percent of English Learners in charter schools were reclassified versus 20 percent of English Learners in traditional public schools. For the purposes of this figure, each student’s initial observation is considered time zero.
Interestingly, this difference is driven by charters moving English Learners with baseline TELPAS scores of one—the lowest level of English proficiency—toward full proficiency more quickly than traditional public schools (Figure 10). In contrast, traditional public schools reclassify English Learners with baseline scores of three or four more quickly (Figure 11). However, because most English Learners enter school with a baseline proficiency level of one or two, charters’ overall reclassification rate is higher.

Notes: This figure shows the percentages of English Learners in charter and traditional public schools with baseline TELPAS scores of one or two (the two lowest levels of English proficiency) who retained their identification status up to eleven years after their initial enrollment (or after entering the dataset). For the purposes of this figure, each student’s initial observation is considered time zero.

Notes: This figure shows the percentages of English Learners in charter and traditional public schools with baseline TELPAS scores of 3 or 4 (the highest levels of English proficiency) who retained their identification status up to eleven years after entering the dataset (or after entering the dataset). For the purposes of this figure, each student’s initial observation is considered time zero.
Finding 3: Compared to their traditional public school peers, English Learners in Texas charter schools are more likely to graduate high school and enroll in college, and they earn more money in the post-college years.
Because English Learners are an unusually mobile student population, characterizing the long-term outcomes of those in charters requires comparisons between multiple cohorts of students. For example, per Figure 12, English Learners who were enrolled in a charter school in eighth or tenth grade were four to five percentage points more likely to graduate high school than their traditional public school peers, while English Learners who were enrolled in a charter in twelfth grade were only about one percentage point more likely to graduate (presumably because twelfth graders are less likely to drop out).

Notes: This figure shows the difference between Texas’s charter and traditional public schools’ English Learners’ probabilities of on-time high school graduation after controlling for race/ethnicity, sex, economic disadvantage, immigrant status, home language, eighth-grade math and reading achievement, eighth-grade English proficiency (as measured by the TELPAS), county of residence, and alternative school status. The estimates reflect the experiences of students who were ever classified as English Learners who were enrolled in a charter or traditional public school in eighth, tenth, or twelfth grade. Per the figure, English Learners who were enrolled in charters in eighth or tenth grade were approximately five percentage points more likely to graduate high school than their peers in traditional public schools.
Per Figure 13, English Learners who were enrolled in a charter school in eighth grade were also about five percentage points more likely to enroll in a postsecondary institution than their traditional public school peers, with this difference driven almost entirely by a seven to eight percentage-point difference in enrollment in four-year institutions. Similarly, English Learners who were enrolled in charters in tenth grade were about six percentage points more likely to ever enter postsecondary education and ten percentage points more likely to enroll in a four-year institution, while twelfth-grade charter enrollees were about eight percentage points more likely to enroll in any postsecondary institution and fourteen percentage points more likely to enroll in a four-year institution.

Notes: This figure shows the differences between Texas’s charter and traditional public schools’ English Learners’ probabilities of enrolling in a two-year or four-year institution after controlling for race/ethnicity, sex, economic disadvantage, immigrant status, home language, eighth-grade math and reading achievement, eighth-grade English proficiency (as measured by the TELPAS), county of residence, and alternative school status. The estimates reflect the experiences of students who were ever classified as English Learners who were enrolled in a charter or traditional public school in eighth, tenth, or twelfth grade. Per the figure, English Learners who were still enrolled in charter schools in twelfth grade were approximately eight percentage points more likely to enroll in any postsecondary institution and approximately fourteen percentage points more likely to enroll in a four-year institution.
Per Figure 14, the increased likelihood of postsecondary enrollment among English Learners is driven by the years immediately following high school completion. For example, English Learners who are enrolled in charters in tenth grade are about fifteen percentage points more likely to be enrolled in a postsecondary institution in the year following their expected high school graduation—though the difference in subsequent years is smaller. Increases for the eighth- and twelfth-grade cohorts are strikingly similar (see Appendix B).

Notes: This figure shows the difference between Texas’s charter and traditional public schools’ English Learners’ probabilities of postsecondary enrollment up to fourteen years after expected high school graduation after controlling for race/ethnicity, sex, economic disadvantage, immigrant status, home language, 8th grade math and reading achievement, 8th grade English proficiency (as measured by the TELPAS), county of residence, and alternative school status. The solid line is above zero in years where English Learners in charter schools have higher postsecondary enrollment rates. The two dotted lines denote the 95 percent confidence intervals. The estimates reflect the experiences of students who were ever classified as English Learners who were enrolled in a charter or traditional public school in 10th grade. Per the figure, charter school students in these groups were nearly 15 percentage points more likely to be enrolled in a postsecondary institution one year after their expected high school graduation.
Finally, English Learners attending charter schools in the 10th grade earn less than their traditional public school peers during the years that correspond to increased postsecondary enrollment (per Figure 14) but significantly more in the long run (per Figure 15). And once again, this pattern holds for students attending charter schools in eighth and tenth grade too (see Appendix B).

Notes: This figure shows the difference between Texas’s charter and traditional public schools’ English Learners’ earnings up to fourteen years after their on-time high school graduation after controlling for race/ethnicity, sex, economic disadvantage, immigrant status, home language, 8th grade math and reading achievement, 8th grade English proficiency (as measured by the TELPAS), county of residence, and alternative school status. The solid lines are above zero in years where English Learners in charter schools have higher earnings and below zero in years where English Learners in traditional public schools have higher enrollment rates. The two dotted lines denote the 95 percent confidence intervals. The estimates reflect the experiences of students who were ever classified as English Learners who were enrolled in a charter or traditional public schools in 10th grade. Per the figure, charter school students in these groups earned significantly less than traditional public school students in the years corresponding to postsecondary enrollment, but significantly more in the long run.
Finding 4: As Texas’s charter sector has expanded, English Learners’ reading progress has held steady, but their math progress has fluctuated.
The fivefold increase in English-Learner enrollment in Texas charter schools over the past decade begs the question of whether student and school performance have changed over time. Accordingly, Figure 16 shows that as Texas’s charter sector has expanded, English Learners’ reading gains have remained relatively consistent, but their math gains have declined—at least between the first time period and later time periods, though there is evidence of improvement in more recent years.
In all periods, these differences are modest. For example, in the 2016–19 period, English Learners in charters made about 0.01 standard deviations less progress in math per year and about 0.02 standard deviations more progress in reading. As noted previously, that is roughly equivalent to moving the average student from the fortieth to the forty-first percentile.

Notes: This figure shows the historical differences between Texas’s charter and traditional public schools’ English Learners’ annual reading and math achievement gains after controlling for race/ethnicity, sex, economic disadvantage, immigrant status, home language, English proficiency (as measured by the TELPAS), and county of residence. Test scores were standardized at the grade-year level using the mean and standard deviation from the statewide population of test takers. The estimates reflect the experiences of students who were ever classified as English Learners. For context, a difference of 0.25 standard deviations is roughly equivalent to moving a student from the fortieth to the forty-first percentile of reading achievement over the course of a school year.
Upon closer inspection, some version of this pattern seems to hold for both multi-school charter management organizations (CMOs) and stand-alone charters (Figure 17). In each type of charter, English Learners’ reading progress has held steady, but their math progress now lags that of their traditional public school peers. This is especially true in stand-alone charters, which account for less than a quarter of Texas’s charter sector.

Notes: This figure shows the historical differences between the annual reading and math achievement gains of English Learners in Texas’s stand-alone and CMO-affiliated charter schools and the annual reading and math achievement gains of their peers in the state’s traditional public schools after controlling for race/ethnicity, sex, economic disadvantage, immigrant status, home language, English proficiency (as measured by the TELPAS), and county of residence. Test scores were standardized at the grade-year level using the mean and standard deviation from the statewide population of test takers. The estimates reflect the experiences of students who were ever classified as English Learners. For context, a difference of 0.25 standard deviations is roughly equivalent to moving a student from the fortieth to the forty-first percentile of reading achievement over the course of a school year.
Takeaways
1. Overall, Texas charter schools stack up well against traditional public schools when it comes to serving the state’s English Learners. Perhaps most important, English Learners who enroll in a Texas charter school are significantly more likely to graduate high school and enroll in a four-year institution—and, on average, they earn significantly more in the post-college years.
2. Examining longer-term outcomes is essential to understanding English Learners’ educational experiences. After all, analysis of achievement gains shows only modest differences between English Learners in charter and traditional public schools. Only when the focus turns to longer-run outcomes, such as postsecondary enrollment and earnings, do the differences between sectors become meaningful.
3. In some cases, efforts to boost English Learners’ reading achievement may be coming at the expense of their math achievement. To be clear, this is neither certain nor inevitable. Still, in addition to other factors, it’s possible that the disconnect between charters’ reading and math outcomes partly reflects the opportunity costs associated with more intensive English interventions. Regardless, the attention that charters are paying to English Learners’ math skills is a topic that deserves further investigation.
Appendices
The differences between English Learners’ achievement gains in charter and traditional public school peers are estimated using the following model:
![]() (1)
(1)
where Yit is the reading or math achievement[20] of individual i in year t, Yit-1 is that same individual’s achievement in the prior school year, Cit is a binary variable that indicates whether a given student was enrolled in a charter or traditional public school in a given school year, Xit is a bundle of demographic and English Learner specific characteristics,
Similarly, the presented differences in graduation, postsecondary enrollment, and earnings are estimated using the following model:
![]() (2)
(2)
where Gic is
From the standpoint of the report, the most important term in both of these equations is
To generate figures 16 and 17, the model in Equation 1 was estimated separately for each of the three time periods in the figures. To generate figures 14 and 15, the model in Equation 2 was estimated separately for each of the fifteen years in the study period. To distinguish between the achievement growth of English Learners in CMO-affiliated and stand-alone charter schools in Figure 17, the indicator for charter school enrollment was interacted with an indicator for enrollment in a CMO-affiliated school.
The estimator for the Kaplan-Meier survival function that is the basis for Figure 9 can be written as:
![]() (3)
(3)
where the probability that an English Learner retains the classification longer than t years is given by the difference between the number of English Learners who could lose the classification (nj) and the number who do (dj), scaled by the number who could lose the classification.
The plots in figures 10 and 11, which adjust for English Learners’ baseline English proficiency, were generated by first fitting a Cox proportional hazards model where the sole covariate is an indicator for the baseline TELPAS level of interest (e.g., baseline TELPAS of 1) and then retrieving and plotting the estimated baseline survivor function.
Appendix B: Additional Figures


Endnotes
About this study
This report was made possible through the generous support of the Sid W. Richardson Foundation and The Louis Calder Foundation. In addition to those institutions, we are grateful to Elizabeth Setren, Professor of Economics at Tufts University, for her timely feedback, to Will Fullerton, formerly chief of staff at the Texas Education Agency, for his helpful perspective, to Pamela Tatz for her thorough copyedit, and to Dave Williams for designing the figures and tables. At Fordham, we would like to thank Chester E. Finn, Jr. and Amber M. Northern for reviewing drafts, William Rost for handling funder communications, Victoria McDougald for her role in dissemination, and Jeanette Luna and Meredith Coffey for their invaluable research assistance at various stages in the process. Last but not least, we are deeply grateful to the educators and leaders in both sectors who made time for us, despite the busyness of their schedules. In Texas, as elsewhere, theirs is the most important work.