For decades, calculus has towered over the high-school math landscape, its mastery viewed as the surest marker of high academic achievement. Yet in New England as across the nation, changes are underway: Statistics and data science courses are multiplying, and state leaders are re-engineering graduation rules so students can choose the pathway that best fits their goals.
So what does participation in calculus and statistics look like and how is New England developing and diversifying its math pathways? To find out, we combed sixteen years of public‐school data, AP course ledgers, and state enrollment files from six New England states, then complemented that analysis with insights from state agency officials and other stakeholders who are rewriting the region’s math playbook.
The study identifies several trends in high school math in New England. Consider that since 2008, the share of New England high schools offering AP Statistics has doubled, and statistics enrollments are catching up to calculus. Meanwhile, three states have loosened rigid “Algebra II-to-Calculus” mandates in favor of more flexible, proficiency-based or STEM-credit requirements, and several other states are drafting new standards meant to keep data science pathways as rigorous as the traditional track.
In short, the report shows a region in transition: Calculus still matters, but statistics is fast becoming its peer. Ensuring every pathway remains rigorous will require clear course standards, tighter K-12-college coordination, and state-level support so districts don’t have to reinvent math reform one classroom at a time.
Introduction
The benefits of advanced math coursework for students' long-term outcomes of high school students are well-documented. Rigorous math course-taking has been linked to a higher chance of attending a four-year college,[1] majoring and persisting in a STEM major (i.e., science, technology, engineering, or mathematics),[2] better academic performance in college,[3] and higher long-term earnings.[4] However, access to such coursework is limited for many students in the United States, particularly for students attending high schools with a majority of students of color and/or low-income students.[5]
In recent years, policymakers have taken an interest not only in expanding access to advanced math coursework overall, but also in diversifying the types of advanced math courses available to students. These efforts help to align each student’s classes in high school with their intended postsecondary major or career interest.
However, the role of one advanced math course in high school, specifically calculus, has proven controversial. To some, it is the pinnacle of rigorous high school work and the foundation for later advanced study and lucrative STEM careers. By this reasoning, dropping it as the target for advanced students would amount to a further erosion of academic standards and limit the trajectories of students who might otherwise study advanced math in college.
Others contend that calculus today plays a role similar to the mastery of Latin in earlier generations: Few workers use it. However, many families and educators pressure students to pursue it because success in the subject signals elite academic ability.[6] Even though only a small minority of students take calculus in high school, the vast majority take courses such as Algebra II and Precalculus largely in preparation for it.
This default “calculus pathway” tends to crowd out other types of high school math, including statistics, even though some recent research indicates that statistical skills are often more applicable to today’s job market than calculus skills. For example, a 2016 analysis of the Survey of Skills, Technology, and Management Practices showed that every category of workers—including “white collar,” “blue collar,” and service workers—reported using statistics-related skills far more than calculus-related skills.[7] And another 2016 study based on resume data from LinkedIn found that statistical analysis was the second-most-valued skill in job candidates across all fields.[8] All this suggests that, for many students, calculus may not be the most useful advanced math course in the long term.
Reform efforts across the country have attempted to provide more math course-taking flexibility to high school students via several types of policy changes, including the revision of state graduation requirements (Rhode Island),[9] the modernization of admissions criteria for state institutions of higher education (California),[10] and the creation of new high school data science courses (in states like Ohio, Oregon, New Jersey, and Maine).[11] Many state education officials are eager to diversify the math pathways available to their students, even as critics worry that alternative courses may be less rigorous than those in the traditional high school math pathway. Yet little research examines the extent to which students who pursue different pathways experience different postsecondary trajectories, such as completing college, selecting a STEM major, or increasing their income.
To better understand these academic and career trajectories, a 2025 study conducted by Matt Giani, Franchesca Lyra, and Adam Tyner used data on 17 cohorts of high school students in Texas to analyze differences in outcomes for similar high-achieving students who opt for either AP Calculus or AP Statistics as their capstone course. The study, published by the Fordham Institute, compared the long-term postsecondary academic and workforce outcomes of students in advanced math courses (including calculus and statistics).
That study found that statistics courses have become much more popular in recent years. Between 2003 and 2020,[12] the proportion of Texas schools offering a statistics course increased from roughly one-quarter to over 40 percent, and student participation has risen accordingly, from about two percent to ten percent of students over the same time period. Meanwhile, the proportion of schools offering AP Calculus AB and AP Calculus BC remained quite stable[13], as did the percentage of participating students, which hovered consistently around 10 percent.
Moreover, it found that the highest math course completed by a student is strongly linked to later postsecondary outcomes, with AP Calculus AB-takers roughly 10 percentage points more likely to major in STEM fields and complete STEM degrees than AP Statistics students, even after applying a rich set of student control variables. However, although AP Calculus AB students initially have an earnings advantage over AP Statistics students, that difference gradually disappears. In the long term, AP Calculus-takers do not significantly outearn AP Statistics-takers, nor are they more likely to work in a STEM-related industry.
The present report explores math pathways specifically in the New England region. As with the Texas study, it includes descriptive analyses of calculus and statistics course offerings and course participation rates, as well as in-depth examinations of efforts to develop and diversify math pathways in New England.
Data and Methodology
The present analysis uses publicly available calculus and statistics participation and course offering data from state education data systems, the College Board’s AP Course Ledger, and the National Center for Education Statistics’ Elementary and Secondary Information System (ELSi). Data were gathered from all six New England states: Connecticut, Maine, Massachusetts, New Hampshire, Rhode Island, and Vermont.
The AP Course Ledger provides a comprehensive list of private and public secondary schools that offer authorized AP courses, enabling us to identify all secondary schools in each New England state that offer AP Calculus AB, AP Calculus BC, or AP Statistics courses in four school years (2008, 2013, 2018, and 2023).[14] To filter out the private schools, we used the ELSi table generator from the National Center for Education Statistics (NCES) website to identify all public high schools in each state that were active in the same four school years and manually compared them to schools on the AP Course Ledger list that were public.[15]
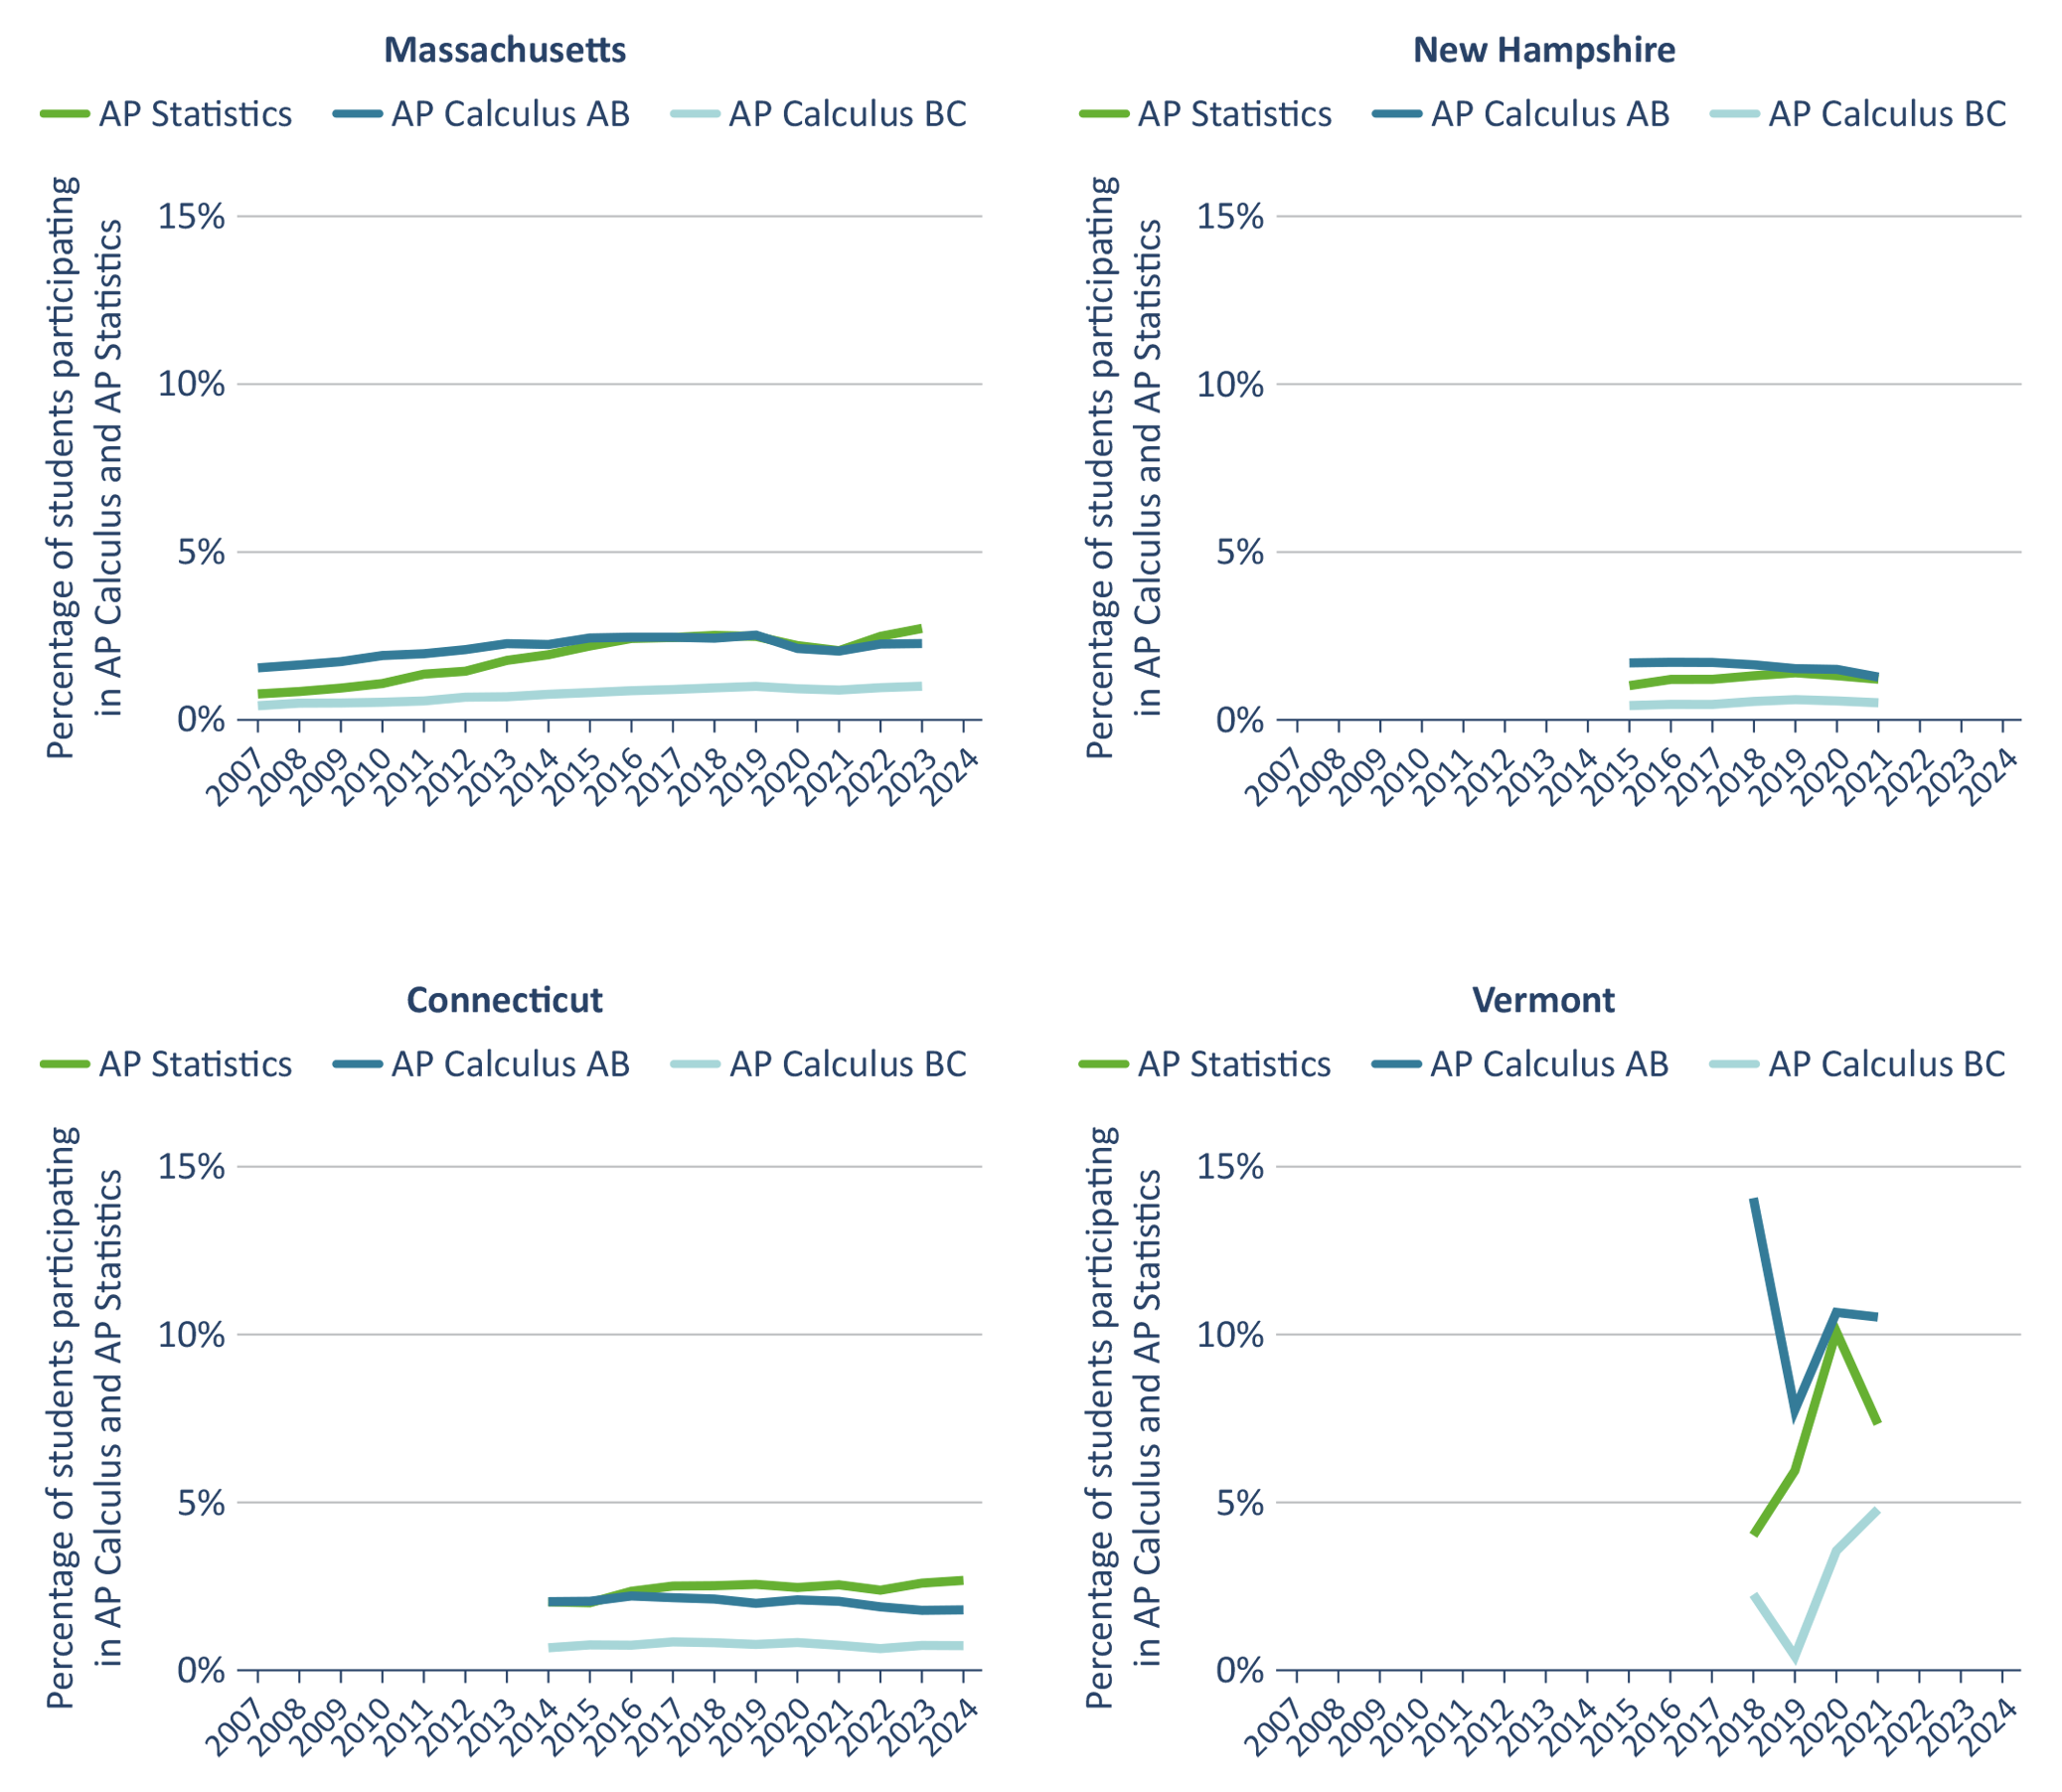
To determine the proportion of students participating in calculus and statistics, we searched the websites of state agencies of education and gathered course enrollment data when available. AP course enrollment data were available for Connecticut, Massachusetts, New Hampshire, and Vermont, albeit in different years.[16] To provide information about AP Calculus and AP Statistics course participation across the region, enrollment data were aggregated across states for each year in which three or more states provided data, resulting in aggregated AP course participation information from 2015 through 2021. AP course participation data disaggregated by state can be found in the Appendix.
Enrollment data for non-AP Calculus and Statistics courses were available only in Connecticut and Vermont. Calculus course enrollment was available for Connecticut from 2014 through 2024, and for Vermont from 2018 through 2021. Statistics course enrollment data were available for Connecticut in 2021 through 2024, and for Vermont in 2018 through 2021. Aggregate course participation data are not presented in this report due to the large differences in course-taking volume and patterns in the two states.
The report also includes information on math pathways-focused initiatives and other related work, gathered from state education agency website searches and in-depth conversations with representatives from state education agencies and other stakeholders across the region. Following a brief introduction to the project and the information we hoped to gain from the conversation, these interviews proceeded informally. We gathered important details about initiatives that had surfaced in the initial search and learned more about successes and challenges in implementing math pathways initiatives and the policies supporting them. Information gathered in these meetings supports the key takeaways about math pathways reform efforts outlined below.
The Advanced Math Landscape in New England
The data on course offerings and enrollment rates in advanced math courses in New England show a changing landscape for high school math. This section shows that statistics has grown in both availability and popularity, though it remains slightly less favored than calculus. While the focus is on data aggregated across all six New England states, state-specific variations can be found in the Appendix.
Key Takeaway #1: The proportion of New England high schools offering AP Statistics doubled between 2008 and 2023, while the proportion offering AP Calculus courses has increased more modestly.
AP Statistics, which was first released by the College Board in 1997, has been made much more widely available in the New England region in the available data (since 2008).[17] AP Statistics remains more common than AP Calculus BC but less common than AP Calculus AB, both of which were introduced decades earlier. However, the percentage of schools offering AP Statistics in New England has plateaued recently.[18] Moreover, changes in AP course offerings over time differ slightly from state to state: In Maine, the overall increase in AP course offerings between 2008 and 2023 was much smaller than in other states, and in Vermont, AP Statistics course offerings plateaued in 2013, five years earlier than the New England average.[19]
Figure 1 shows the percentage of public schools in New England, on aggregate, offering AP Calculus AB, AP Calculus BC, and AP Statistics over time. The percentage offering AP Calculus BC has risen steadily over time, increasing by nearly 15 percentage points over fifteen years—but not as sharply as the percentage of schools offering AP Statistics, which has risen by about 27 percentage points since 2008 (though the largest increases occurred between 2008 and 2018, after which it plateaued). In contrast, the percentage of schools offering AP Calculus AB, which was over 20 percentage points higher than the percentage offering AP Calculus BC or AP Statistics in 2008, increased by only 4 percentage points over the fifteen years.
Figure 1. The percentage of public schools offering AP Statistics rose sharply between 2008 and 2018 but has since plateaued.

Key Takeaway #2: Overall, calculus and statistics participation rates have remained relatively stable in the recent years for which we have data.
Figure 2 shows AP Calculus AB, AP Calculus BC, and AP Statistics course-taking rates in New England, on aggregate, between 2015 and 2021. Course-taking rates for AP Calculus BC have slowly increased in New England but remain lower than AP Calculus AB and AP Statistics participation rates.[20]
Figure 2. There has been little change in course-taking rates for AP Calculus AB, AP Calculus BC, and AP Statistics since 2015.

In general, AP Calculus AB and AP Calculus BC participation have remained relatively stable over time in New England, except for a brief spike in Calculus AB course-taking during the 2017-18 school year. Between 2015 and 2021, AP Calculus AB participation increased by 0.1 percentage points, while AP Calculus BC participation increased by about a quarter of a percentage point. AP Statistics participation in New England rose by only half of a percentage point between 2015 and 2020, then declined slightly in 2021—although AP Statistics course offerings increased during the same time period.
AP participation data are available for many of the states in New England due to relatively consistent reporting by the College Board. Still, non-AP Calculus and Statistics course participation data are more difficult to attain because of the lack of a single centralized source for these data. Available data from Connecticut and Vermont reveal that trends in general Calculus and Statistics course-taking rates do not necessarily mirror patterns in AP course-taking. Figure 3 shows these trends in non-AP course-taking using data from the two states.
Figure 3. Participation in non-AP Calculus and non-AP Statistics follows different patterns in Connecticut and Vermont, but growth in the latter outpaces growth in the former.
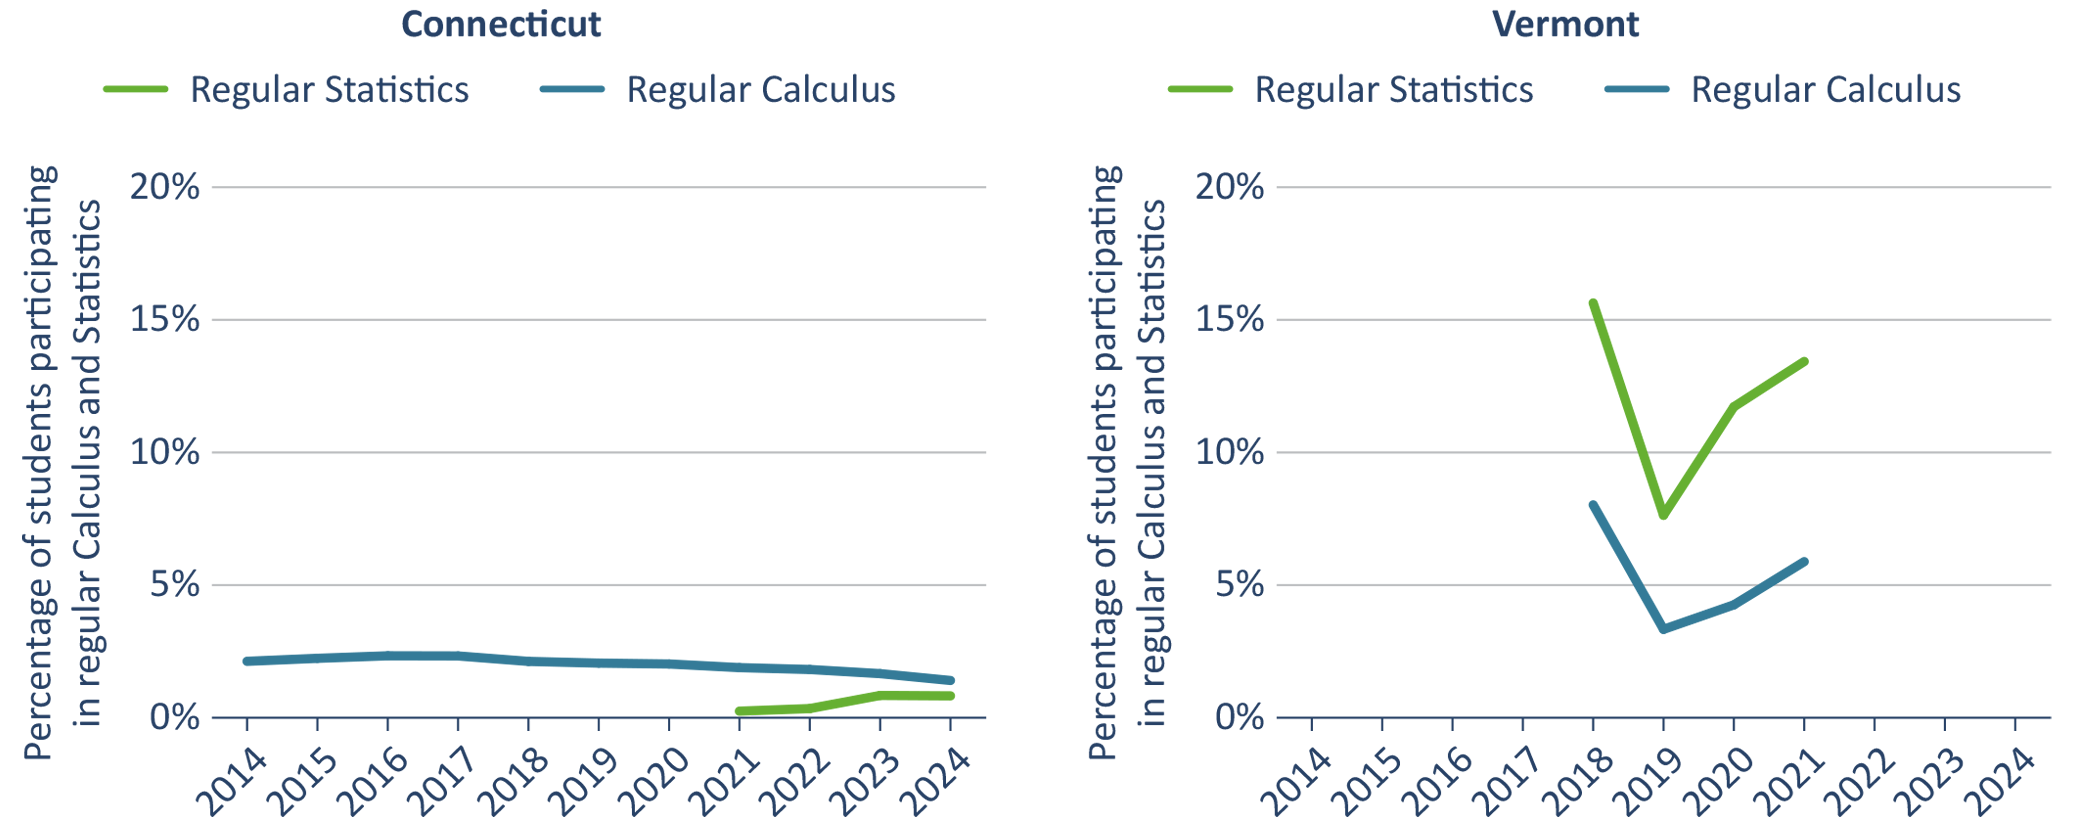
In Connecticut, regular Calculus course-taking decreased from just over 2 percent to about 1.5 percent over ten years, while regular Statistics course-taking increased from 0.2 percent to 0.8 percent between 2021 and 2024. In Vermont, however, Calculus and Statistics participation rates followed similar patterns, increasing by 3 and 6 percentage points, respectively, between 2019 and 2021, following an outlying year in which enrollment in both courses was much lower.
Despite these changes, statistics generally remains less popular than calculus for high schools in New England. However, many New England states have recently launched efforts to boost participation in secondary math pathways outside the traditional calculus pathway. We look at those efforts next.
State-level Work in Developing Math Pathways in New England
State efforts to develop diverse secondary math pathways have gained momentum nationwide, with 22 states participating in the Launch Years Initiative. This program, led by the Charles A. Dana Center at the University of Texas at Austin, supports states in diversifying and expanding mathematics pathways from high school through postsecondary education and into the workplace, ensuring that secondary math learning opportunities are better aligned with students’ goals for the future. Participating states focus on designing and implementing postsecondary and high school mathematics pathways, modernizing math courses and content, and improving advising practices. Within New England, Maine, Massachusetts, and Rhode Island are collaborating with Launch Years already, and Connecticut recently submitted a letter of intent to join the initiative.[21]
Our research on state-level initiatives, coupled with in-depth discussions with stakeholders across New England, reveals several recurring themes across the region. Commonalities surface relative to reforming graduation requirements and struggles to ensure that alternative pathways uphold academic rigor.
Key Takeaway #3: Promoting effective math pathways often requires changing statewide graduation requirements in math.
Three New England states (Connecticut, Vermont, and Rhode Island) have changed their statewide graduation requirements in recent years.
In Connecticut, a requirement for each student to earn three math credits to graduate was replaced with a looser requirement that students earn nine overall STEM credits. This new requirement, which took effect beginning with the graduating class of 2023, allows schools to exercise more flexibility in their course offerings. Rather than having to complete three math-specific courses, students can now earn math credit through courses like Computer Science or Data Science, which may be more relevant to students’ interests.[22]
Vermont’s graduation requirements went through an even more significant change in 2020, when the state shifted from course-based requirements to a proficiency-based system, in which students must demonstrate mastery against a core set of indicators in each content area to graduate, rather than complete a specific number of courses in each subject as the previous system required. Like in Connecticut, the change in Vermont gave schools and students more flexibility in deciding how students develop the mathematical proficiencies they need to meet their college or career goals. Students can pursue a number of flexible pathways outside traditional coursework to meet the proficiency requirements, including virtual or blended learning, dual enrollment courses, career and technical education (CTE) courses, and work-based learning opportunities.[23]
Unfortunately, this flexibility may come at the cost of higher-order mathematical skills for students if the assessments used to measure mastery of mathematical proficiencies are not sufficiently rigorous. To encourage the use of more rigorous assessments, the state has entered into a contract with the Great Schools Partnership, which will work with educators to create assessments aligned to benchmarks. However, while the state may provide districts with guidance related to these assessments, they are ultimately determined locally, which could lead to variation in assessment quality across the state.
More recently, Rhode Island updated its graduation requirements, allowing students to enroll in their new “RIDE-Approved Readiness Pathways” to pursue courses that better align with their college and career goals. These pathways, which will take effect beginning with the graduating class of 2028, allow students pursuing CTE to make room in their schedules for courses more relevant to their CTE interests by substituting two of the four traditionally required college-prep math courses with an approved Readiness Pathway course. Their new options include Statistics, Probability and Statistics, and Data Science, among other courses.[24]
In theory, these changes to graduation mandates remove the barrier of more inflexible math credit requirements for graduation, allowing students to pursue advanced math through more interdisciplinary coursework. However, there are implementation challenges to consider as districts put these policy changes into practice.
Of particular concern is the alignment, or lack thereof, between state graduation requirements and the expectations of institutions of higher education. In Rhode Island, the RIDE-Approved Readiness Pathways offer CTE students the flexibility to replace Algebra II with an approved alternative in certain cases. While these pathways aim to align coursework with students' future aspirations, substituting Algebra II could restrict later postsecondary opportunities for some students. For example, many of the state’s higher education institutions still require Algebra II as a prerequisite for admission, potentially limiting access for those who opt for an alternative course. To address this issue, RIDE has established an approval process for enrolling in a RIDE-Approved Readiness Pathway that includes both student and parent acknowledgement that enrolling in the pathway may limit the student’s eligibility for admission to state institutions of higher education.[25]
Higher education institutions are often resistant to change,[26] but attempts to better align secondary and postsecondary math pathways are not only occurring on the secondary education side; institutions of higher education across New England have also been working to ensure that their admissions criteria are better aligned with state graduation requirements. For example, a recent campaign led by the New England Secondary Schools Consortium encouraged at least 85 New England institutions of higher education to allow students to meet their admissions requirements through diplomas based on alternative, “proficiency-based” diplomas.[27]
As states reform graduation requirements, students have opportunities to take new kinds of courses. To expand course offerings, some Connecticut districts have partnered with the Computer Science Professional Learning Action Network at Sacred Heart University and Bootstrap, an external curriculum provider that helps districts create new courses with aligned curricula that integrate math with data science topics. Bootstrap provides fully developed curricular modules, as well as a “Build Your Own” course option that allows districts to tailor materials more specifically to meet the needs of their students.[28] Still, although some districts took advantage of the opportunity to create courses with Bootstrap (such as “Algebra for Manufacturing”), these courses are not widespread.[29]
Vermont has taken a different approach to broadening the availability of math courses. As a part of the state’s Flexible Pathways Initiative, Vermont leverages its own virtual and blended learning program to offer both calculus and statistics courses to students regardless of whether they are available at their school.[30] (These virtual and blended learning courses may contribute to Vermont’s notably higher Calculus and Statistics course-taking rates compared to other New England states. See Figure 3.)
Key Takeaway #4: States must proactively develop rigorous and consistent expectations in new statistics and data science pathways.
While many New England states have made progress in introducing new statistics and data science courses, their state education agencies also share concerns regarding the rigor of these new math pathways. The common perception—particularly in higher education admissions—that calculus is more rigorous than statistics has led some to worry that new course pathways may result in students seen as unprepared for calculus being funneled into the statistics or data science route.[31]
States face several challenges in ensuring alternative pathways are as rigorous as the traditional calculus pathway. One is the broader lack of standards for statistics or data science instruction across the United States. While standards and curricula for calculus are relatively consistent and widely accepted across the country, they do not yet exist for newer (and, until recently, much less popular) advanced math courses. To address this gap, multiple groups, including the University of Chicago’s Data Science 4 Everyone, have provided recommendations for state data science standards,[32] and states like West Virginia are currently developing them.[33]
Unfortunately, many New England states use “local control” as the reason that they can’t monitor the rigor of new advanced math courses. They contend that their state education systems prevent them from prescribing, approving, or even collecting information on the curricula that schools use. That means that the content and rigor of a course labeled “Statistics” could vary from district to district. However, state officials aren’t helpless; many “local control” states have found effective strategies for promoting rigor in alternative advanced math courses.
In 2022, Maine piloted a data science course using materials from an external curriculum provider, CourseKata,[34] that included free professional development and ongoing support to participating teachers. This partnership, like Connecticut's collaboration with Bootstrap, provided educators with detailed content examples and resources to enhance their understanding and teaching of data science. Although the initial partnership was temporary, some districts have continued using CourseKata's curriculum.[35]
Massachusetts is working to address rigor in statistics courses by defining the characteristics of “Probability and Statistics” courses at the state level. Aiming to ensure that statistics courses in different districts are uniformly rigorous, the Department of Elementary and Secondary Education will be developing and sharing clear guidance regarding the content of such courses with districts.[36]
State representatives also highlighted anecdotal evidence that new statistics and data science pathways are already appropriately rigorous. In Maine, for instance, a state representative shared that she had seen a student who struggled with functions in Algebra II complete data modeling problems in a data science course, utilizing math content that was more complex than the concepts that the student was unable to master in Algebra II.[37] The example illustrates a sentiment heard often in our interviews: Rather than decreasing the rigor for students who may struggle with calculus, alternative advanced math courses should push them to access high-level math concepts through content and instruction that is better aligned with their interests and strengths.
Recommendations
Across New England, the popularity of statistics is catching up with that of calculus, as measured both by the share of schools that offer the courses and the share of students who take them. In addition, significant work is now underway in New England states to establish more diverse secondary math pathways and ensure that students have access to advanced math courses that are interesting and relevant to their future goals. Our findings suggest three recommendations for the region as it continues pushing these efforts forward.
Recommendation #1: States should develop clear standards for newer advanced math courses and/or encourage the adoption of AP Statistics.
To ensure the rigor of alternative math pathways in the long term, states should create clear standards for statistics and data science courses—similar to the guidance being developed in Massachusetts and the standards under development in West Virginia—to ensure that students gain the high-level conceptual skills they need to meet their college and career goals. States should also consider developing aligned end-of-course assessments to help set expectations and promote transparency.
A relatively simple way for some districts to expand pathways while maintaining rigor is to offer AP Statistics. Students in this course follow a structured and externally validated curriculum and have been found to perform just as well as their Calculus-taking counterparts in terms of college enrollment, degree completion, and long-term earnings.[38] Yet, nearly half of New England high schools still do not offer the course. For these schools, offering AP Statistics may be the lowest-hanging fruit as high school math pathways reform moves forward.
Recommendation #2: States should promote collaboration between K-12 and higher education institutions to align their expectations regarding college preparation.
Colleges often admit new students to programs based on success in traditional math pathways, presenting a barrier to developing new pathways in high schools. Students taking a new pathway, however rigorous, might be excluded from higher education opportunities if admissions requirements do not adapt. If they plan to attend college, that poses a dilemma: Take the traditional pathway and miss out on important skills, or take a new pathway and put college at risk. Representatives from across New England mentioned this concern in our conversations, and officials from Maine and Connecticut told us that prioritizing greater collaboration with their states’ institutions of higher education would help address this problem in the coming years.[39]
Efforts to alter the admissions requirements of institutions of higher education may face resistance, however, if the rigor of alternative math pathways is not validated. For example, in 2017, California began allowing an Introduction to Data Science course to replace Algebra II as a core course to determine admission to the state’s higher education system. However, that decision was reversed in 2024 by the University of California due to the lack of clarity around the content of the data science courses.[40] As they develop alternative math pathways, K-12 policymakers must coordinate with institutions of higher education so that students pursuing other pathways can earn transferable credits without fear of limiting their later postsecondary opportunities.
Recommendation #3: States should provide additional guidance and resources to support districts in expanding the advanced math courses available to their students.
The development of rigorous alternatives to the traditional calculus pathway can be resource-heavy and time-consuming, and districts should not have to go it alone. State education leaders are important in supporting local implementation, providing guidance, coordination, and clear academic standards from which individual districts can benefit. States are uniquely positioned to create and distribute shared resources—such as curriculum frameworks, professional development, assessment resources, and instructional materials—so that districts don’t each have to invest significant time and resources to develop them independently.
This type of leadership already exists in some states. Maine, for example, recently released extensive resources for districts related to the development and implementation of diverse secondary math pathways, including student questionnaires, course frameworks, professional learning resources, examples of successful implementation models, and more.[41] Providing such resources at the state level is a boon to districts, and state officials in Connecticut and Rhode Island told us that similar efforts are currently underway in their states.[42]
***
Developing robust and diverse high school mathematics pathways requires intentional planning—particularly when navigating ambiguous expectations for new courses. In New England and across the country, the success of these initiatives hinges on state leaders playing a critical role in establishing clear course standards, facilitating collaboration among stakeholders, and securing necessary resources.
Appendix: State-Specific Trends
This appendix includes additional data and analysis of AP course offerings and participation in New England.
Figure A1. Individual state trends in annual AP Calculus and AP Statistics course-offering rates for all six New England states

Figure A2. Individual state trends in annual AP Calculus and AP Statistics course participation rates for Connecticut, Massachusetts, New Hampshire, and Vermont
Endnotes
[1] Alison Aughinbaugh, "The effects of high school math curriculum on college attendance: Evidence from the NLSY97," Economics of Education Review 31, no. 6 (December 2012): 861-870, https://doi.org/10.1016/j.econedurev.2012.06.004; Soo-yong Byun, Matthew J. Irvin, and Bethany A. Bell, "Advanced Math Course Taking: Effects on Math Achievement and College Enrollment," The Journal of Experimental Education 83, no. 4 (2015): 439-468, https://doi.org/10.1080/00220973.2014.919570.
[2] Phillip L. Ackerman, Ruth Kanfer, and Charles Calderwood, "High School Advanced Placement and Student Performance in College: STEM Majors, Non-STEM Majors, and Gender Differences," Teachers College Record 115, no. 10 (October 2013): 1-43, https://doi.org/10.1177/016146811311501003; Xueli Wang, “Why Students Choose STEM Majors: Motivation, High School Learning, and Postsecondary Context of Support,” American Educational Research Journal 50, no. 5 (October 2013): 1081-1121, https://doi.org/10.3102/0002831213488622.
[3] Mark C. Long, Patrice Iatarola, and Dylan Conger, “Explaining Gaps in Readiness for College-Level Math: The Role of High School Courses,” Education Finance and Policy 4, no. 1 (2009): 1-33, https://doi.org/10.1162/edfp.2009.4.1.1; Philip Sadler and Gerhard Sonnert, “The Path to College Calculus: The Impact of High School Mathematics Coursework,” Journal for Research in Mathematics Education 49, no. 3 (May 2018): 292-329, https://eric.ed.gov/?id=EJ1178090.
[4] Heather Rose and Julian R. Betts, Math Matters: The Links Between High School Curriculum, College Graduation, and Earnings (San Francisco: Public Policy Institute of California, 2001), https://www.ppic.org/wp-content/uploads/content/pubs/report/R_701JBR.pdf.
[5] Awilda Rodriguez, “Inequity by Design? Aligning High School Math Offerings and Public Flagship College Entrance Requirements,” The Journal of Higher Education 89, no. 2 (2018): 153-183, https://doi.org/10.1080/00221546.2017.1341757.
[6] A recent report finds that 93 percent of high school counselors say calculus gives students an edge in admissions. See Pamela Burdman and Veronica Anderson, “Calculating the Odds: Counselor Views on Math Coursetaking and College Admissions,” Just Equations, September 2022, https://justequations.org/resource/calculating-the-odds-counselor-views-on-math-coursetaking-and-college-admissions.
[7] See table 2 in Michael J. Handel, "What do people do at work?." Journal for Labour Market Research 49, no. 2 (2016): 177-197. https://labourmarketresearch.springeropen.com/articles/10.1007/s12651-016-0213-1.
[8] See Catherine Fisher, “LinkedIn Unveils The Top Skills That Can Get You Hired In 2017, Offers Free Courses for a Week,” LinkedIn, October 20, 2016, https://blog.linkedin.com/2016/10/20/top-skills-2016-week-of-learning-linkedin.
[9] "The Rhode Island Diploma System & Graduation Requirements," Rhode Island Department of Education, accessed December 16, 2024, https://ride.ri.gov/students-families/ri-public-schools/diploma-system.
[10] Mikhail Zinshteyn, “Cal State Drops Intermediate Algebra as Requirement to Take Some College-Level Math Courses,” EdSource, August 1, 2017, https://edsource.org/2017/cal-state-drops-intermediate-algebra-requirement-allows-other-math-courses/585595.
[11] Veronica Anderson, “OPINION: It May Be Time to Rethink the Emphasis on Taking Calculus in High School,” The Hechinger Report, May 5 2022, https://hechingerreport.org/opinion-it-may-be-time-to-rethink-the-emphasis-on-taking-calculus-in-high-school; Maine Department of Education, “Seeking Schools and Educators to Pilot New High School Statistics and Data Science Course,” last modified June 2 2022, https://mainedoenews.net/2022/06/02/seeking-schools-and-educators-to-pilot-new-high-school-statistics-and-data-science-course/.
[12] We use the spring term to identify the year of data, meaning that the year 1999 denotes the academic year 1998-99.
[13] AP Calculus AB focuses on the core ideas of differential and integral calculus, while AP Calculus BC includes much of the same content, along with added topics such as sequences, series, and parametric equations.
[14] The four years for which data were collected cover the full time span for which course offering data were available, in 5-year increments, allowing for the identification of overarching trends in course offering rates over time; “AP Course Ledger,” AP Central, College Board, accessed December 16, 2024, https://apcourseaudit.inflexion.org/ledger/.
[15] As the AP Course Ledger entries only include school names and addresses, schools from the lists were matched by name; "Elementary/Secondary Information Center," National Center for Education Statistics, accessed December 16, 2024, https://nces.ed.gov/ccd/elsi/default.aspx?agree=0.
[16] The data span different years in each state: 2014 to 2024 in Connecticut, 2007 to 2023 in Massachusetts, 2015 to 2021 in New Hampshire, and 2018 to 2021 in Vermont; “Course Enrollments by Subject,” EdSight, accessed December 16, 2024, https://public-edsight.ct.gov/instruction/course-enrollments-by-subject; “Advanced Placement Performance,” School and District Profiles, Massachusetts Department of Elementary and Secondary Education, accessed December 16, 2024, https://profiles.doe.mass.edu/statereport/ap.aspx; “Non-Statewide Assessment College Board Reports,” New Hampshire Department of Education, accessed December 16, 2024, https://www.education.nh.gov/who-we-are/division-of-educator-and-analytic-resources/bureau-of-education-statistics/non-statewide-assessment-college-board-reports; “Vermont Education Dashboard: Course Enrollment,” State of Vermont Agency of Education, accessed December 16, 2024, https://education.vermont.gov/data-and-reporting/vermont-education-dashboard/course-enrollment.
[17] When school years are shortened in this report, they are referred to by the calendar year in which the spring semester took place (e.g., the 2007-08 school year is referred to as 2008).
[18] When comparing the course participation data from New England with Texas, note that New England states reported annual participation rates, while Texas participation data are cohort-based (and thus tend to be higher).
[19] State-specific trends in AP Calculus and Statistics course offerings are displayed in Figure A1 in the Appendix.
[20] State-specific trends in AP Calculus and Statistics course participation are displayed in Figure A2 in the Appendix.
[21] "Launch Years Initiative," Charles A. Dana Center, The University of Texas at Austin, accessed December 16, 2024, https://www.utdanacenter.org/our-work/k-12-education/launch-years-initiative; Jennifer Michalek (Connecticut Department of Education) in conversation with authors, November 25, 2024.
[22] Marybeth Sullivan, Required Public School Program of Study (Hartford, CT: Office of Legislative Research, July 8, 2022), https://www.cga.ct.gov/2022/rpt/pdf/2022-R-0145.pdf; Michalek, 2024.
[23] "Proficiency-Based Graduation Requirements," State of Vermont Agency of Education, accessed December 16, 2024, https://education.vermont.gov/student-learning/proficiency-based-learning/proficiency-based-graduation-requirements; Rachael Ledwidge, Pat Fitzsimmons, Ian Burfoot-Rochford, and Ryan Parkman (VT Agency of Education) in conversation with authors, December 11, 2024.
[24] "RIDE Readiness-Based Graduation Requirements: Math Requirement Guidance for Implementation & Resources," Rhode Island Department of Education, November 2024, https://ride.ri.gov/sites/g/files/xkgbur806/files/2024-11/Math_Graduation_Requirement_Guidance_V3%2811.20.2024%29_0.pdf.
[25] "RIDE Readiness-Based Graduation Requirements: RIDE-Approved Readiness Pathway Guidance for Implementation & Resources,” Rhode Island Department of Education, September 2023, https://ride.ri.gov/sites/g/files/xkgbur806/files/2023-12/RIDE-Approved%20Readiness%20Pathway%20Guidance%20Draft%20%28September%202023_%29%20for%20Publication.pdf.
[26] Kathy Johnson Bowles, "Why Can’t Higher Education Change?", Inside Higher Ed, January 10, 2022, https://www.insidehighered.com/blogs/just-explain-it-me/why-can%E2%80%99t-higher-education-change.
[27] “85 New England Institutions of Higher Education State that Proficiency-Based Diplomas Do Not Disadvantage Applicants,” College Admissions, New England Secondary Schools Consortium, accessed December 16, 2024, https://www.newenglandssc.org/resources/college-admissions/.
[28] "Bootstrap," accessed December 16, 2024, https://www.bootstrapworld.org/.
[29] Michalek, 2024.
[30] "Flexible Pathways," State of Vermont Agency of Education, accessed December 16, 2024, https://education.vermont.gov/student-learning/flexible-pathways.
[31] Jill Barshay, “Is calculus an addiction that college admissions officers can’t shake?,” Hechinger Report, December 9, 2024, https://hechingerreport.org/proof-points-high-school-calculus-college-admissions-survey/.
[32] Javeria Salman, "Do we need a "Common Core’ for data science education?,” Hechinger Report, July 4, 2024, https://hechingerreport.org/do-we-need-a-common-core-for-data-science-education/.
[33] Tim Flatley (West Virginia Department of Education), personal communication, December 9, 2024.
[34] ”About CourseKata,” CourseKata, accessed December 16, 2024, https://coursekata.org/about.
[35] Beth Lambert (Maine Department of Education) in conversation with authors, December 5, 2024.
[36] Ian Stith (Massachusetts Department of Elementary and Secondary Education) in conversation with authors, November 13, 2024.
[37] Lambert, 2024.
[38] Matt Giani, Franchesca Lyra, and Adam Tyner, Calculus or Statistics: Does it Matter? (Washington, D.C.: The Thomas B. Fordham Institute, 2025),
https://fordhaminstitute.org/national/research/calculus-or-statistics-does-it-matter.
[39] For example, Maine’s work with the Launch Years Initiative resulted in the creation of the Maine Math Collaborative, a group whose goals include auditing the admissions requirements of public and private universities across the state; Lambert, 2024.
[40] Mikhail Zinshteyn, “Cal State Drops Intermediate Algebra as Requirement to Take Some College-Level Math Courses,” EdSource, August 1, 2017, https://edsource.org/2017/cal-state-drops-intermediate-algebra-requirement-allows-other-math-courses/585595; John Fensterwald and Michael Burke, “UC Committee Changes Admission Standard for Data Science, Causing Confusion over Math Framework,” EdSource, July 11, 2023, https://edsource.org/2023/uc-committee-changes-admission-standard-for-data-science-causing-confusion-over-math-framework/693892.
[41] "Math Pathways," Maine Department of Education, accessed December 16, 2024, https://www.maine.gov/doe/learning/mathpathways.
[42] Michalek, 2024; Joshua Lach (RIDE) in conversation with authors, November 20, 2024.
About this Study
This report is made possible thanks in part to support from the Barr Foundation and our sister organization, the Thomas B. Fordham Foundation. We thank Heena Kuwayama and Adam Tyner for collecting data and authoring the final report. We also thank Ian Burfoot-Rochford, Pat Fitzsimmons, Joshua Lack, Beth Lambert, Rachael Ledwidge, Jennifer Michalek, Adrian Mims, Ryan Parkman, and Ian Stith for providing their perspectives on secondary math pathways in the New England region. We appreciate the work of Chester E. Finn, Jr., Michael J. Petrilli, and Amber M. Northern for providing feedback on drafts, Stephanie Distler for managing report production and design, and Victoria McDougald for overseeing media dissemination. Finally, our gratitude goes to Rebecca Mahoney for copyediting and Dave Williams for laying out the report’s figures.